Share this blog:
.png)
In Part 1, we found the floor: $80,000 in aggregate cost basis beneath $127 billion in institutional capital. But that analysis treated the ETF complex as a single entity. It isn't.
The aggregate is an average across 11 issuers with 11 different strategies, 11 different investor bases, and 11 different pain thresholds. Averages flatten the story. The real action lives in the dispersion.
The $27,000 Spread
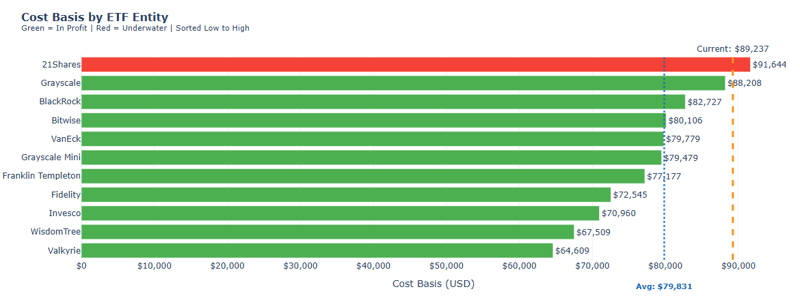
The entity with the lowest cost basis sits at $64,609. The highest sits at $91,644. That's a $27,000 gap, a 42% difference between the best and worst positioned players in the complex.
One is +38% profitable with a substantial cushion. The other is already 2.6% underwater and actively bleeding capital.
Same asset class. Same time period. Radically different outcomes based on accumulation strategy and timing.
This spread reveals something the aggregate obscures: vulnerability isn't evenly distributed. Some entities can absorb a 30% drawdown without stress. Others are already in the red. Understanding who sits where, and how much capital they control, determines whether a pullback stays orderly or cascades into forced selling.
The Entity Leaderboard
Eleven issuers. Eleven cost bases. Eleven vulnerability profiles. The full report ranks every spot Bitcoin ETF from lowest cost basis (strongest) to highest (most vulnerable). Three names deserve immediate attention.
- Fidelity: 341,443 BTC at $72,500 cost basis — +23% — +$5.70B unrealized
- BlackRock: 758,745 BTC at $83,000 cost basis — +7.9% — +$4.94B unrealized
- 21Shares: 38,668 BTC at $91,644 cost basis — -2.6% — -$93M unrealized
Cost Basis by Entity
The Anchor: Fidelity
341,443 BTC at $72,500 cost basis. Currently +23% with $5.70 billion in unrealized profits.
Fidelity accumulated early and didn't chase. Their cost basis sits $7,500 below the aggregate floor, providing a substantial cushion before any stress emerges. More importantly, they're the only major entity still accumulating. Over the past 30 days, Fidelity added 6,712 BTC while nearly everyone else sold.
Lowest cost basis among the majors. Highest conviction in the current environment. They're buying what others are selling. If everyone behaved like Fidelity, there would be no vulnerability story to tell.
The Giant: BlackRock
758,745 BTC at $83,000 cost basis. Currently +7.9% with $4.94 billion in unrealized profits.
BlackRock represents 53% of the entire ETF complex. When you talk about institutional Bitcoin exposure, you're mostly talking about BlackRock. Their cost basis sits notably above the aggregate floor of $80,000.
At current prices, they're profitable. But a 7.3% decline from here puts the largest holder underwater. The math matters. BlackRock going underwater isn't just one entity flipping to a loss. It's 53% of the entire complex flipping to a loss. The psychological weight of that headline alone could accelerate selling.
Monitor $83,000 more closely than the aggregate floor. That's the level where the narrative shifts.
The Warning: 21Shares
38,668 BTC at $91,644 cost basis. Currently, -2.6% with $93 million in unrealized losses.
Out of our sample, 21Shares is the only entity currently underwater. Their positioning reflects accumulation during the Q4 2024 rally when prices peaked. Every tick lower increases the pain. And they're not sitting still. Over the past 30 days, 21Shares saw outflows of 3,505 BTC, representing 9% of their holdings.
21Shares is the early warning signal. When stress spreads beyond this single entity, when a second name joins them in the red, that's when cascade risk becomes real. For now, the damage is contained. One entity representing 2.7% of the complex can absorb losses without systemic impact. But containment has limits.
The Dollar View
Percentages tell one story. Dollars tell another.
Fidelity at +23% and Valkyrie at +38% might suggest Valkyrie is better positioned. But Fidelity's +23% translates to $5.7 billion in unrealized gains. Valkyrie's +38% translates to $126 million. Scale changes everything.
Two entities account for 89.8% of total gains. Fidelity and BlackRock together hold $10.64 billion of the $11.85 billion aggregate profit. The other nine issuers combined contribute roughly $1.2 billion.
This concentration cuts both ways. On one hand, it means the aggregate health depends almost entirely on two players. If Fidelity and BlackRock are comfortable, the market is comfortable. On the other hand, it means stress at either of these names ripples through everything.
The 90-Day Problem
Entity positioning tells half the story. The other half is the marginal buyer: capital that entered in the last 30, 60, or 90 days. They have the shortest track record with the asset. They experience immediate negative feedback if price drops. They capitulate first.
- 30-Day Buyers: $97,625 cost basis, down 8.6%
- 60-Day Buyers: $113,609 cost basis, down 21.5%
- 90-Day Buyers: $115,210 cost basis, down 22.5%
Nearly 100,000 BTC sits in the 90-day cohort at an average cost of $115,210. That's $11.5 billion in capital showing 22.5% losses. These aren't traders who bought yesterday and might wait it out. These are allocations made over a three-month window, positions that had time to build conviction, now facing significant drawdowns.
That's not a minor pullback. That's "explain this to the investment committee" territory.
Marginal momentum compounds the concern. The 30-day marginal cost basis has fallen $20,020 over the past month, a 17% decline. New buyers are only willing to enter at lower prices. They're not chasing. They're demanding more discount before committing capital. This lack of urgency from fresh buyers removes a potential support mechanism.
If the 90-day cohort folds, expect $8 to $10 billion in potential selling pressure before the aggregate floor provides meaningful support. The marginal floor breaks before the aggregate floor.
The Domino Sequence
As prices drop, entities flip underwater in a predictable order. The sequence is determined by cost basis. Highest breaks first. Lowest breaks last. Knowing the order lets you anticipate stress before it becomes systemic.
- Current ($89,237): 21Shares is already underwater
- -7% ($83,000): BlackRock goes underwater, 53% of holdings in loss
- -10.5% ($80,000): Aggregate floor breached
- -19% ($72,500): Fidelity finally feels pressure
The $83,000 level matters more than $80,000 level. The aggregate floor is a mathematical construct. The BlackRock threshold is where 53% of the complex flips red in a single move. Psychology often matters more than math.
The Complete Analysis
The full report includes:
- Complete Entity Leaderboard: All 11 issuers with cost basis, holdings, P&L, and vulnerability scores
- Dollar View Analysis: Why Fidelity and BlackRock control 89.8% of aggregate gains
- Quadrant Framework: Mapping holdings size against cost basis to identify concentration risk
- Marginal Buyer Deep Dive: 30/60/90-day cohort analysis with momentum indicators
- Cascade Propagation Model: How selling begets selling through the entity sequence
- Stickiness Analysis: Which capital is structural versus hot money
[Download the complete report: "Who Breaks First: ETF Cost Basis Part 2"]
Three Signals to Watch
$83,000 - BlackRock's cost basis. When the 53% holder goes underwater, the narrative shifts from consolidation to crisis.
Entity Count Underwater - Currently 1 of 11. If a second entity joins 21Shares below break-even, stress is spreading beyond isolated positioning.
Fidelity Accumulation - The only major buyer. If Fidelity stops buying, the primary bid disappears. If Fidelity starts selling, the anchor is slipping.
[Download Part 1 of the report here & download Part 3 of the report here!]
Full-Market Research. Institutional Depth. Derivatives, ETFs, on-chain, DEXs, microstructure, risk signals, and more. Subscribe at the bottom of our page for research that covers every corner of crypto and visit the Amberdata Research Blog.
Access Amberdata Intelligence for institutional-grade digital asset intelligence powering actionable insights across blockchain and market data, or contact our team to discuss custom solutions for your risk management strategy.

Links & Resources
Amberdata Research Library
https://www.amberdata.io/research-library
Amberdata Intelligence Platform
Amberdata Docs
Contact Us
https://www.amberdata.io/contact-us
Recent from Amberdata (most recent at the top)
- [LINK TO PART 1]
- The ETF Exodus Decoded: Basis Arbitrage, Not Capitulation
- Coincidence or Signal? Did WLFI Telegraph Crypto's $6.93B Meltdown
- How $3.21B Vanished in 60 Seconds: October 2025 Crypto Crash Explained Through 7 Charts
- Five Signals of FOMC Impact: How Interest Rate Decisions Reshape Crypto Market Microstructure
- Beyond the Spread - Understanding Market Impact and Execution
- The Rhythm of Liquidity - Temporal Patterns in Market Depth
- DeFi Activity, Stablecoins, and the Impact on Price Volatility: Part 1
- DeFi Activity, Stablecoins, and the Impact on Price Volatility: Part 2
- DeFi Activity, Stablecoins, and the Impact on Price Volatility: Part 3
- How Do On-Chain Metrics Explain Bitcoin Volatility? Part 1
- How Do On-Chain Metrics Explain Bitcoin Volatility? Part 2
- Amberdata 2024 Digital Asset Market Intelligence Report: Exchanges & Derivatives
- Crypto Pairs Trading: Part 1 — Foundations of Moving Beyond Correlation
- Crypto Pairs Trading: Part 2 — Verifying Mean Reversion with ADF and Hurst Tests
- Crypto Pairs Trading: Part 3 — Constructing Your Strategy with Logs, Hedge Ratios, and Z-Scores
- Crypto Pairs Trading: Part 4 — Empirical Results & Performance Analysis
Disclaimers
The information contained in this report is provided by Amberdata solely for educational and informational purposes. The contents of this report should not be construed as financial, investment, legal, tax, or any other form of professional advice. Amberdata does not provide personalized recommendations; any opinions or suggestions expressed in this report are for general informational purposes only.
Although Amberdata has made every effort to ensure the accuracy and completeness of the information provided, it cannot be held responsible for any errors, omissions, inaccuracies, or outdated information. Market conditions, regulations, and laws are subject to change, and readers should perform their own research and consult with a qualified professional before making any financial decisions or taking any actions based on the information provided in this report.
Past performance is not indicative of future results, and any investments discussed or mentioned in this report may not be suitable for all individuals or circumstances. Investing involves risks, and the value of investments can go up or down. Amberdata disclaims any liability for any loss or damage that may arise from the use of, or reliance on, the information contained in this report.
By accessing and using the information provided in this report, you agree to indemnify and hold harmless Amberdata, its affiliates, and their respective officers, directors, employees, and agents from and against any and all claims, losses, liabilities, damages, or expenses (including reasonable attorney’s fees) arising from your use of or reliance on the information contained herein.
Copyright © 2025 Amberdata. All rights reserved.