Share this blog:
.png)
Our comprehensive weekly coverage of price action and volatility, trading volumes and market structure (orderbook depth/spreads), derivatives markets (open interest, funding rates, long/short positioning, term structure/basis), institutional flows (Bitcoin ETFs, stablecoin supply across chains), and DeFi credit markets (lending protocol TVL, utilization, liquidations).
News
- Ethereum Sees Whale Bets and Staked ETF Move: Whales opened $426 million in long positions on Ether as BlackRock filed for a staked ETH exchange-traded fund, boosting market confidence. ETH prices held above $3,000 with bullish momentum building toward a key $3,500 resistance level.
- Solana Dominates DeFi as Firm Amasses SOL Hoard: Solana led all blockchains in decentralized exchange activity for a 16th straight week. Meanwhile, Forward Industries unveiled a 6.9 million SOL treasury—the largest corporate Solana stash—after a $1.65 billion raise and launching a liquid staking token to maximize on-chain yields.
- EU Pushes Unified Crypto Oversight Under ESMA: The European Commission proposed shifting crypto company supervision from national regulators to the EU’s securities authority (ESMA) to eliminate fragmented oversight. The plan, backed by major member states, would make ESMA a central crypto watchdog pending approval by EU lawmakers and ministers.
- CFTC Launches Pilot for Crypto Collateral Use: The U.S. derivatives regulator rolled out a pilot program allowing Bitcoin, Ether and USDC to be used as collateral in futures and options markets. The test aims to modernize trading by safely integrating tokenized assets into regulated clearing and margin practices.
- Major U.S. Bank Offers Direct Bitcoin Trading: PNC Bank launched in-app spot Bitcoin trading for its high-net-worth clients via Coinbase’s platform, becoming the first major U.S. bank to enable direct crypto purchases. The integration marks a significant step as traditional banks increasingly cater to rising client demand for digital assets.
- Tether Invests €70M in European Robotics Startup: The issuer of the USDT stablecoin made a €70 million investment in Generative Bionics, touted as Europe’s largest robotics spin-off. The deal broadens Tether’s portfolio beyond crypto markets, leveraging part of its reserves to back innovative tech while supporting its stablecoin’s collateral.
Market Analytics
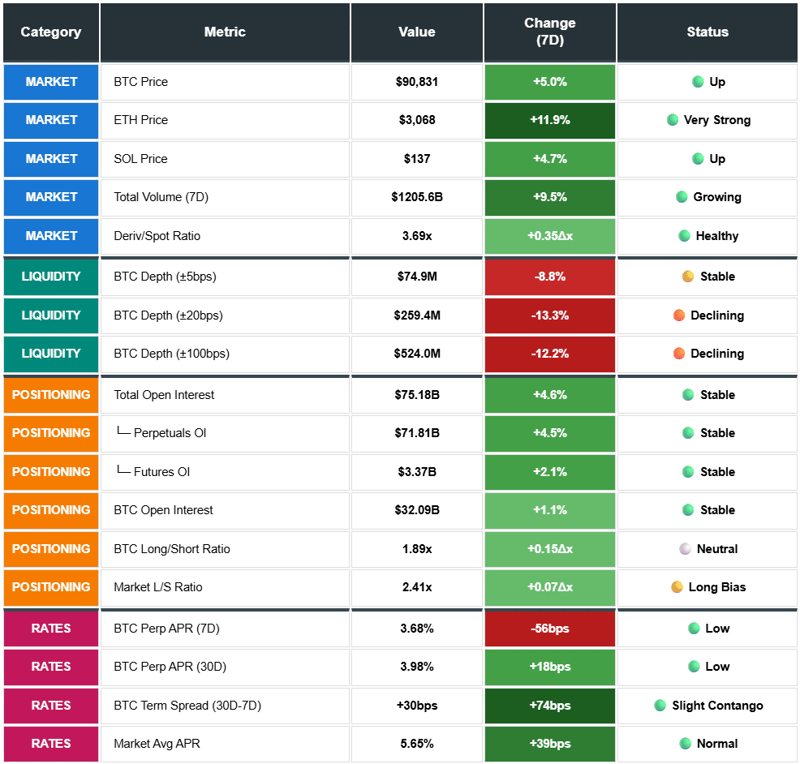
Recovery Rally with Structural Confirmation: Digital assets rebounded sharply with BTC rising 5.0% to $90,831, ETH outperforming at +11.9% to $3,068, and broad altcoin participation (LINK +13.9%, AAVE +12.1%, BNB +8.8%, SOL +4.7%). Total volume recovered 9.5% to $1.21T as derivatives/spot ratio increased to 3.69x (+0.35x). Open interest rose $3.31B (+4.6%) to $75.18B, the first meaningful weekly increase since early November. ETH OI surged +10.7% versus BTC's restrained +1.1%, indicating selective re-leveraging into the rally.
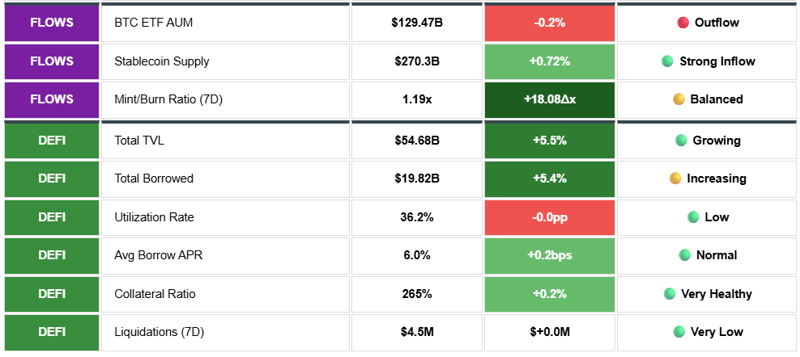
Capital Flows Diverging Constructively: Bitcoin ETFs returned to -$229.2M outflows after prior week's brief +$63M inflow. The scale of redemptions continues to narrow compared with the peak crisis period. Stablecoins told the opposite story with +$1.94B minting (USDT +$2.05B leading), the largest weekly inflow in months. Combined signal suggests institutional ETF distribution maturing while fresh trading capital enters via stablecoins. DeFi TVL expanded +5.5% to $54.7B as credit stress fully resolved.
Funding Normalized, Positioning Bifurcated: BTC funding at +0.19% (26% annualized) and ETH +0.30% (41% annualized) sit in healthy territory without crowding risk. Market average remains negative at -0.33%, providing tailwind for longs. BTC L/S ratio at 1.89x (balanced) contrasts sharply with SOL's extreme 4.01x crowding, creating asymmetric alt downside risk.
Liquidity Resilient, Credit Healthy: BTC depth stable at $537M (±200bps) with spreads holding 0.10 bps. DeFi liquidations collapsed 97% to $4.5M as collateral values stabilized. Utilization at 36.2% with $35B available capacity. Market infrastructure supporting price recovery without stress.
Forward Outlook: Multiple confirmation signals aligning: price recovery, OI rebuild, stablecoin inflows, funding normalization, credit stress resolution. Primary risk remains alt crowding (SOL 4.01x, BNB 3.49x). Watch for: (1) ETF flows inflecting positive, (2) SOL L/S declining below 3.5x, (3) BTC sustaining above $90k. Current state: early-stage recovery with healthy majors structure but alt vulnerability persists.
PRICES, VOLATILITY AND VOLUMES
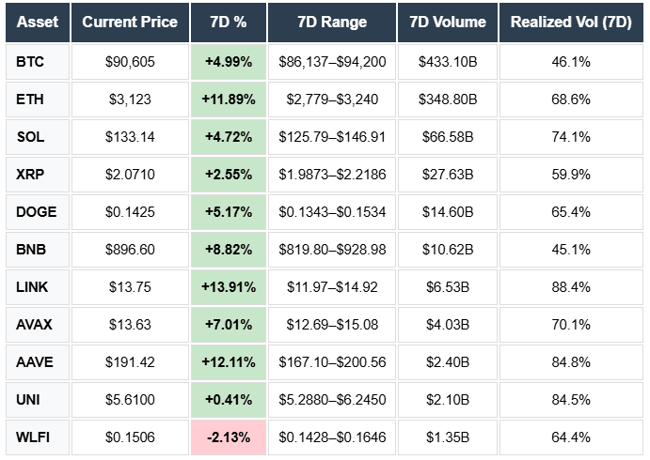
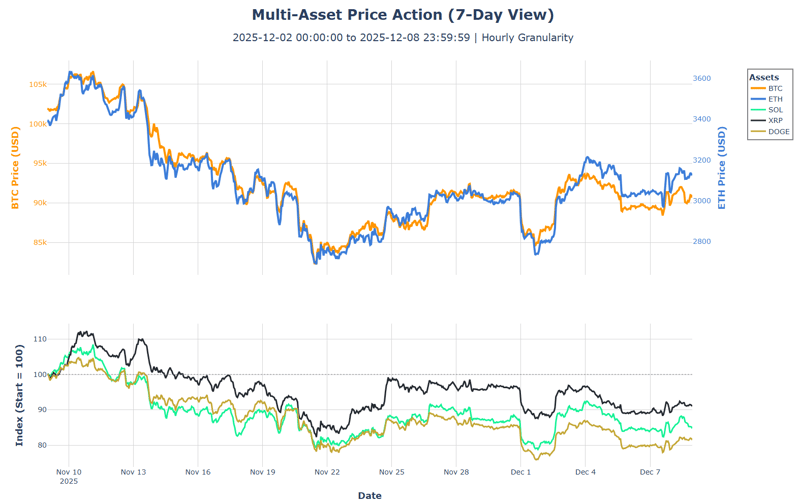
Recovery Rally with Broad Participation: Digital assets rebounded sharply with BTC rising 5.0% to $90,605 and ETH outperforming at +11.9% to $3,123. Altcoins joined the rally: LINK led at +13.9%, AAVE +12.1%, BNB +8.8%, AVAX +7.0%, DOGE +5.2%, SOL +4.7%. Only WLFI declined (-2.1%). First coordinated green week since early November as multiple stabilization signals from prior week translated into price action.
Volume Recovery from Extreme Lows: Total volumes rose 9.5% week-over-week to $1.21T ($257B spot, $948B derivatives), a partial recovery from the prior week's 35% collapse. Derivatives/spot ratio increased to 3.69x from 3.33x (+0.35x), indicating leverage returning as prices stabilize. Volume recovery remains modest relative to the extreme contraction, suggesting cautious re-engagement rather than aggressive risk-on positioning.
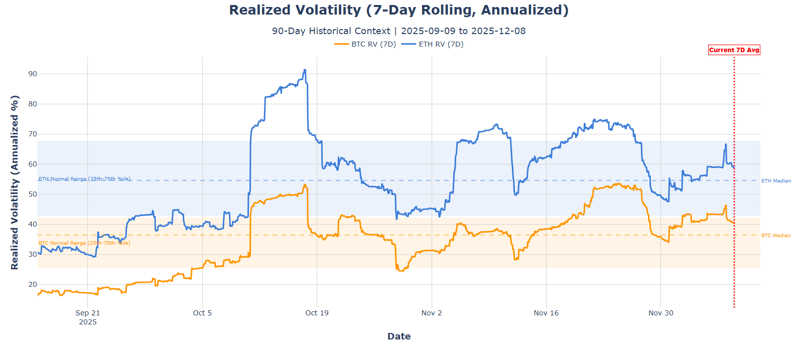
Volatility Normalizing Toward Historical Norms: BTC realized vol compressed to 46.1% (down from 48.4% prior), now sitting at 75th percentile versus 90-day median of 36.4%. ETH vol at 68.6% (vs 67.8% prior), holding at 75th percentile boundary. Both majors declining from extreme stress levels toward normal ranges as the volatility spike digests. Altcoin vol remains elevated: LINK 88.4%, AAVE 84.8%, UNI 84.5%, SOL 74.1%. Alts running 1.5-2x BTC's volatility despite positive returns.
Current Levels: BTC traded $86.1k-$94.2k range (9% width), ETH $2,779-$3,240 (17% width). Range widths expanding from prior week's compression as recovery rally tests resistance. ETH outperformance (+11.9% vs BTC +5.0%) suggests risk appetite returning to the second-largest asset. Volume recovery with rising D/S ratio indicates leverage rebuilding. Watch for funding rate response as positioning increases.
OPEN INTEREST
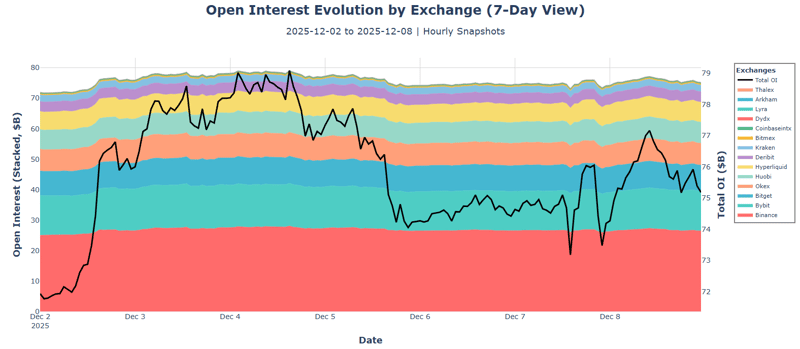
Re-Leveraging Begins: Total OI rose $3.31B (+4.6%) to $75.18B, first meaningful weekly increase since early November. Recovery follows three consecutive weeks of deleveraging that shed $15B+ from cycle highs. Perpetuals dominate at 95.5% ($71.8B) versus futures at 4.5% ($3.4B). Market structure remains retail-heavy with elevated liquidation cascade risk, though OI rebuild suggests positioning confidence returning.
ETH Leads Re-Leveraging: ETH OI surged +10.7% (+$1.97B) to $20.40B, outpacing BTC's modest +1.1% (+$0.36B) to $32.09B. ETH's disproportionate OI increase (10.7% vs 11.9% price gain) indicates traders adding leverage at similar pace to spot appreciation. SOL OI rose +3.5% to $3.63B, lagging its +4.7% price move. BTC's restrained OI growth (+1.1% vs +5.0% price) suggests majors-focused traders remain cautious on leverage despite price recovery.
Alt OI Showing Selective Strength: ZEC OI jumped +26.3%, SUI +25.1%, BCH +23.6%, LINK +13.1%, ADA +9.7%, BNB +7.7%, XRP +5.7%. Notable new entrants CHEEMS ($1.73B, 2.3% share) and HYPE ($1.33B, 1.8% share) reflect continued meme/narrative speculation on native venues. ASTER (-9.1%) and LTC (-7.3%) saw position reduction against the broader trend.
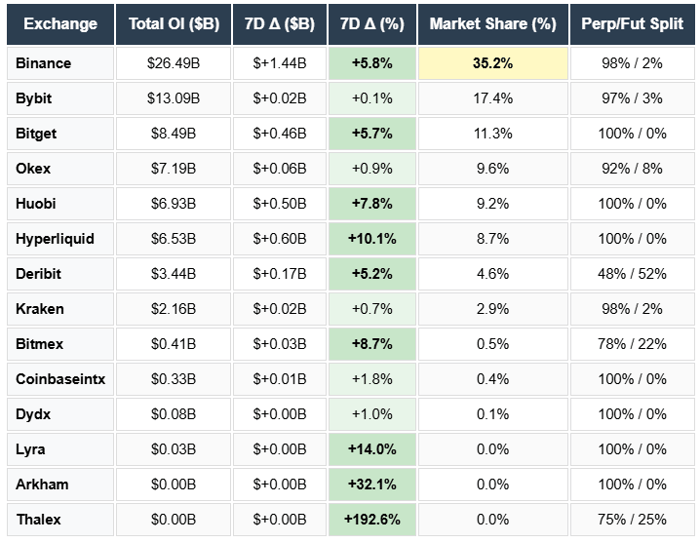
Exchange Flows Favor Native Venues: Hyperliquid led growth at +10.1% (+$0.60B) to $6.53B, recovering from prior week's -19.7% exodus. Huobi +7.8%, Binance +5.8% (+$1.44B absolute), Bitget +5.7%. Bybit essentially flat (+0.1%) despite 17.4% market share. Binance maintains dominance at 35.2% share with $26.5B OI. Deribit (+5.2%) shows options/futures activity increasing as volatility normalizes.
Forward Signal: OI rebuilding alongside price recovery is healthy if funding rates remain contained. ETH's outsized OI growth warrants monitoring for crowding risk. Watch for: (1) BTC OI acceleration above +5% weekly as confirmation of sustained positioning, (2) funding rate response to leverage rebuild, (3) Hyperliquid flows as signal of sophisticated trader sentiment. Current state: early re-leveraging phase with ETH leading, structure improving but perpetual dominance maintains liquidation sensitivity.
FUNDING RATES
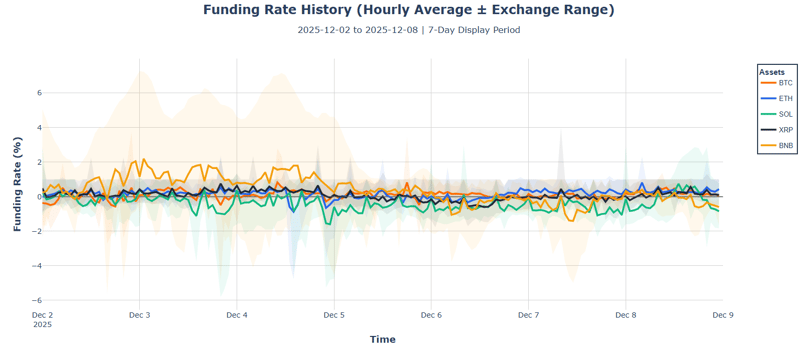
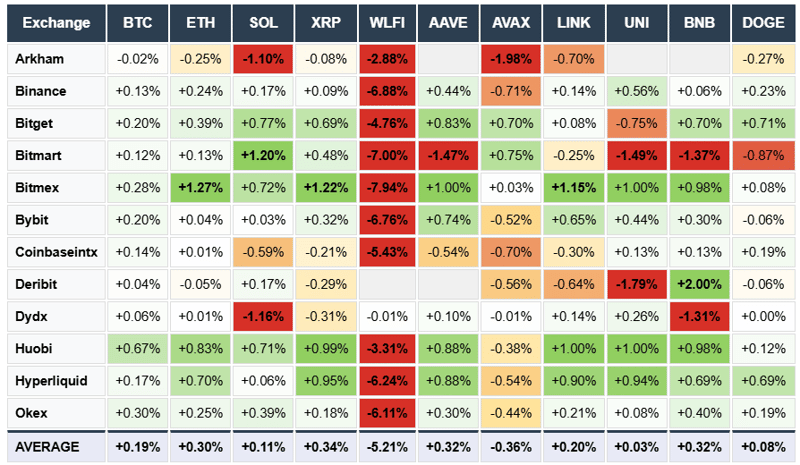
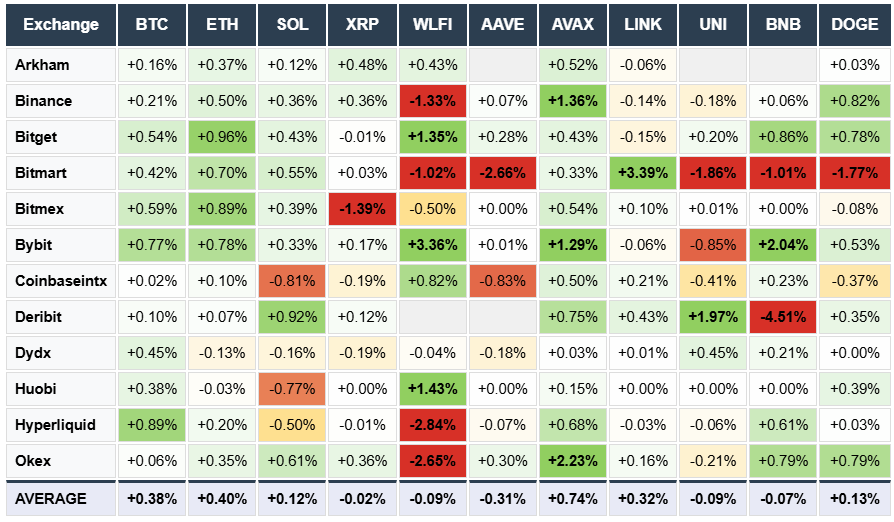
Market Average Flips Negative: Market-wide funding collapsed to -0.22% (-29.9% annualized)—first negative reading in this report series. Shorts now paying longs across aggregate positioning. BTC and ETH remain positive but compressed: BTC 0.15% (20.6% annualized), ETH 0.22% (29.9% annualized), SOL near-zero at 0.03%. Significant shift from prior week's positive carry environment.
Intraweek Volatility Extreme: Funding swung wildly—BTC ranged -1.10% to +0.88% (199bps), ETH -1.07% to +1.18% (225bps), SOL hit -1.84% to +0.47% (231bps). BNB saw the largest swing at -0.53% to +1.66% (219bps). The week ended with BTC hitting -1.10% low on Dec 1—most bearish hourly print of the period. Rapid oscillations indicate unstable positioning with algo-driven mean reversion dominating.
WLFI Deeply Short: WLFI funding averaged -3.53%—extreme short positioning with Binance at -5.51%, Bitget -5.53%. Week-over-week change of +3.95% (less negative) suggests partial short covering but positioning remains heavily bearish. AVAX also negative at -0.66% average. In contrast to the broader market, Huobi ran hot on multiple assets (+0.44% BTC, +0.73% ETH, +0.98% XRP).
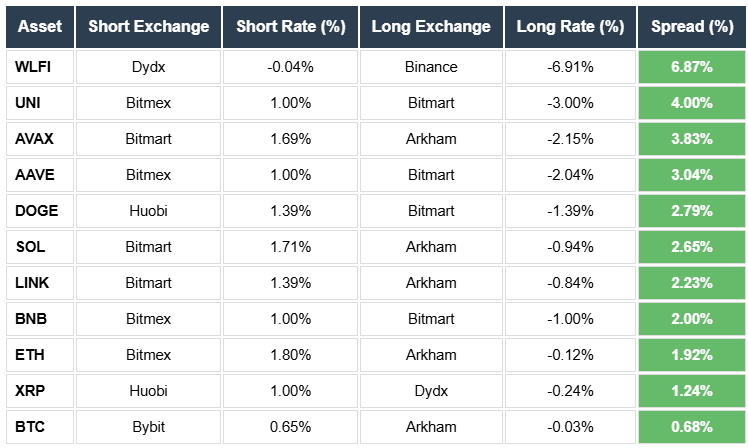
Arbitrage Spreads Wide: WLFI 5.19% spread (Bitmex +1.00% vs Coinbaseintx -4.19%), AVAX 4.17% spread, BNB 3.73% spread. Persistent venue divergence indicates capital constraints and asymmetric positioning. BTC showed 4.47% latest spread despite majors typically arbitraged tight—market makers demanding premium during volatility.
Forward Signal: Negative market-wide funding is a classic capitulation signal—shorts dominating for first time this cycle. However, BTC/ETH remaining positive suggests majors haven't fully capitulated. Watch for sustained negative BTC funding as confirmation of sentiment shift. Current structure favors mean reversion trades but directional conviction is absent.
Funding Rates
Week on Week
Funding Rate Arbitrage Opportunity
ORDERBOOK DEPTH
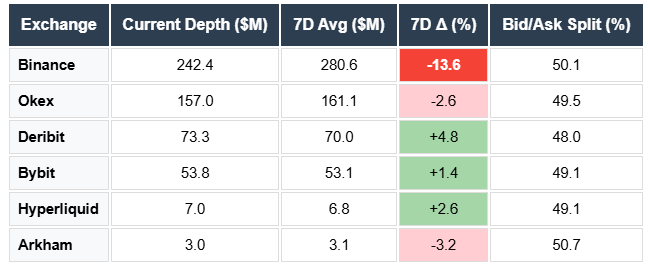
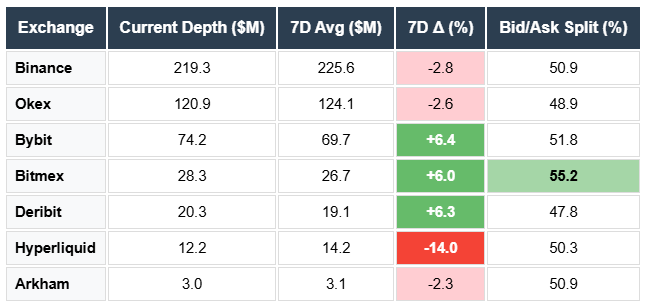
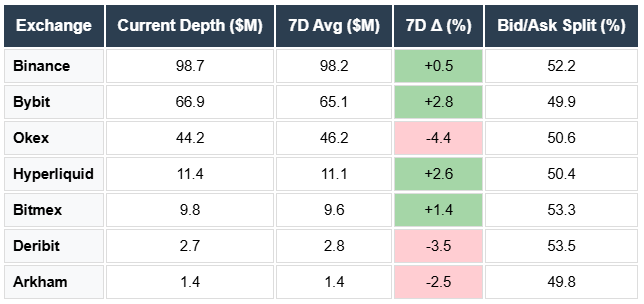
Liquidity Stable Through Recovery: BTC depth at $536.6M (±200bps) declined modestly (-1.8% WoW), while ETH held steady at $478.2M (-0.4%) and SOL at $235.0M (-0.4%). At tighter spreads (±100bps), BTC shows $524.0M (-5.6% vs 7D avg), ETH $437.2M (+0.7%), SOL $184.1M (-0.8%). Liquidity contracting slightly in BTC while ETH/SOL remain resilient through the price recovery.
BTC Depth More Volatile: BTC depth ranged $508M to $590M over the week (14.8% volatility), significantly wider than ETH's 5.7% range or SOL's 5.3%. Higher BTC depth volatility suggests market makers adjusting quotes more aggressively as price tests resistance. ETH/SOL stability indicates consistent two-sided interest.
Balanced Positioning Across Assets: BTC bid/ask split at 49.4%, ETH at 50.8%, SOL at 51.4%. No directional pressure building in orderbooks despite price recovery and OI rebuild. Market makers positioned symmetrically, suggesting range-bound expectations rather than directional conviction.
Forward Signal: Stable depth with balanced bid/ask through price recovery is constructive microstructure. BTC depth volatility warrants monitoring as a potential leading indicator. Watch for: (1) BTC depth stabilizing above $550M as liquidity confirmation, (2) bid/ask skew above 55% as directional signal, (3) depth contraction at tight spreads as volatility warning. Current state: healthy liquidity environment supporting price recovery.
BTC Depth
ETH Depth
SOL Depth
ORDERBOOK SPREADS
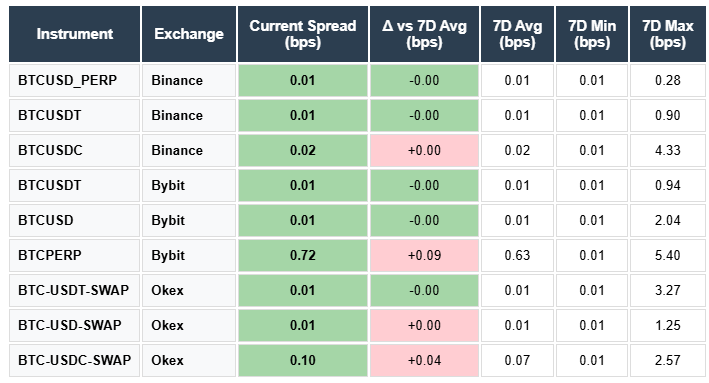
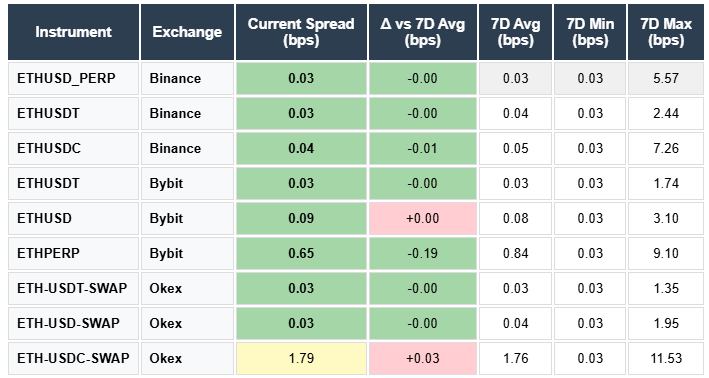
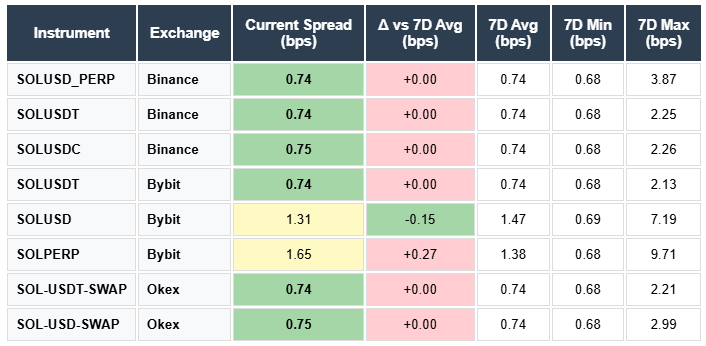
Institutional-Grade Execution Maintained: BTC spreads averaging 0.10 bps across major venues, ETH at 0.30 bps, SOL at 0.93 bps. All spreads stable week-over-week with minimal changes (BTC +0.01 bps, ETH -0.02 bps, SOL +0.02 bps). Market makers maintaining tight quotes through the recovery rally, a healthy microstructure signal.
Clear Execution Hierarchy: BTC offers tightest execution (0.01-0.72 bps range), followed by ETH (0.03-1.79 bps), then SOL (0.74-1.65 bps). SOL execution costs run 5-10x majors, an important consideration for portfolio rebalancing. Binance BTCUSD_PERP at 0.01 bps and Okex ETH-USDT-SWAP at 0.03 bps offer best-in-class execution for size.
USDT Pairs Consistently Tighter: USDC pairs show wider spreads across all assets. ETH-USDC-SWAP (Okex) at 1.79 bps versus ETH-USDT-SWAP at 0.03 bps highlights the liquidity premium in USDT markets. Routing size through USDT pairs remains optimal for minimizing execution costs.
Forward Signal: Stable sub 1 bps spreads in majors during price recovery indicates market makers confident in providing liquidity. No spread widening despite increased volume and OI rebuild suggests healthy two-sided flow. Watch for: (1) BTC spreads widening above 0.20 bps as early stress indicator, (2) SOL spread compression below 0.80 bps as liquidity improvement signal. Current state: excellent execution environment across all major assets.
BTC Spreads
ETH Spreads
SOL Spreads
LONG/SHORT RATIO
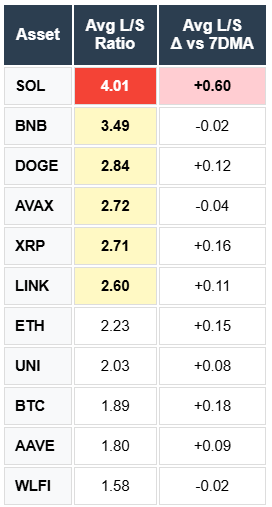
Majors Normalized, Alts Crowded: BTC L/S ratio at 1.89x (+0.18 WoW) remains balanced below the 2.0x threshold. ETH at 2.23x (+0.15) also in healthy territory. Both majors showing balanced positioning despite price recovery, suggesting sustainable rally rather than leverage-driven squeeze. Prior week's deleveraging successfully reset major asset positioning.
SOL Crowding Intensifies: SOL L/S surged to 4.01x (+0.60 WoW), deep into extreme territory above 3.5x. This represents the most crowded positioning across tracked assets and creates meaningful cascade risk if support breaks. SOL's +4.7% price gain came with disproportionate long accumulation, a warning signal for continuation.
Altcoin Long Bias Elevated: BNB at 3.49x, DOGE 2.84x, AVAX 2.72x, XRP 2.71x, LINK 2.60x all sit in long-biased territory (2.5-3.5x range). Weekly changes mixed: XRP +0.16, DOGE +0.12, LINK +0.11 increased crowding while BNB -0.02 and AVAX -0.04 slightly reduced. Alt positioning remains elevated despite price appreciation, creating asymmetric downside risk.
Balanced Assets: UNI 2.03x, AAVE 1.80x, WLFI 1.58x all showing healthy positioning with minimal weekly changes. These assets offer cleaner risk/reward profiles without crowding concerns.
Forward Signal: BTC/ETH balanced positioning supports continued price stability. SOL's extreme crowding (4.01x) is the primary risk factor for the broader market. Watch for: (1) SOL L/S declining below 3.5x as capitulation signal, (2) BTC maintaining below 2.0x as floor confirmation, (3) alt L/S compression toward 2.0x for healthier market structure. Current state: majors healthy, alts vulnerable.
TERM STRUCTURE / BASIS
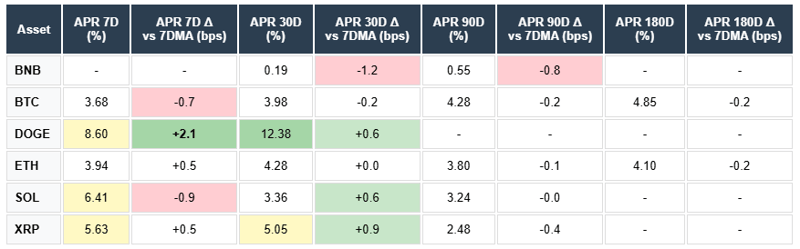
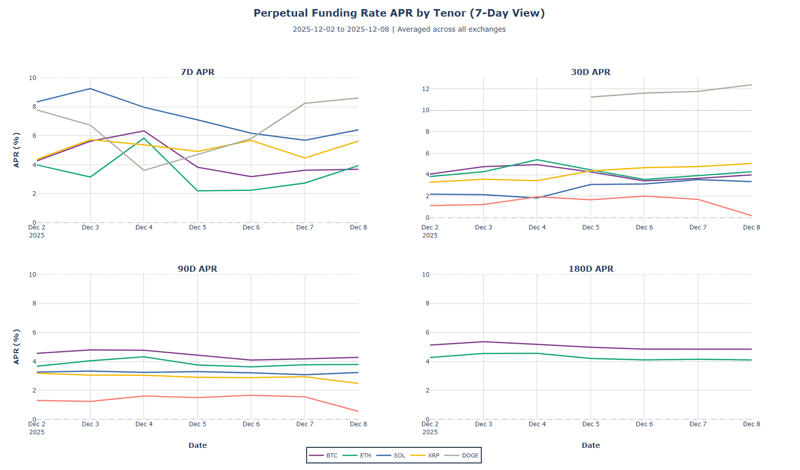
Majors Showing Healthy Contango: BTC term structure flat at 7D 3.68%, 30D 3.98%, 90D 4.28%, 180D 4.85% (+117bps front-to-back). ETH similarly stable at 7D 3.94%, 30D 4.28%, 90D 3.80%, 180D 4.10%. Both majors maintaining mild contango with minimal weekly changes (BTC -0.7bps, ETH +0.5bps). Normalized curves indicate carry trade viability without excessive speculative premium.
SOL/XRP Curves Inverted: SOL 7D at 6.41% collapsing to 30D 3.36% and 90D 3.24% signals elevated near-term hedging demand or squeeze potential. XRP shows similar inversion with 7D 5.63%, 30D 5.05%, 90D 2.48% (-315bps backwardation). Front-end premium during price strength typically indicates short squeeze building or forced covering pressure.
DOGE Elevated, BNB Compressed: DOGE 7D at 8.60% rising to 30D 12.38% (+2.1bps WoW) shows strongest basis appreciation, consistent with meme rotation. BNB remains compressed at 30D 0.19%, 90D 0.55%, reflecting minimal speculative premium and lower volatility expectations.
Forward Signal: BTC/ETH stable curves suggest majors insulated from alt positioning stress. SOL/XRP inversions historically precede either sharp rally (squeeze) or extended weakness (hedging correct). Watch for: (1) SOL curve normalization (7D < 30D) as volatility resolution signal, (2) BTC 30D sustaining above 4% as healthy carry confirmation, (3) DOGE basis compression as rotation exhaustion indicator. Current state: contained stress in alts, stable majors supporting price floor.
BITCOIN ETF FLOWS
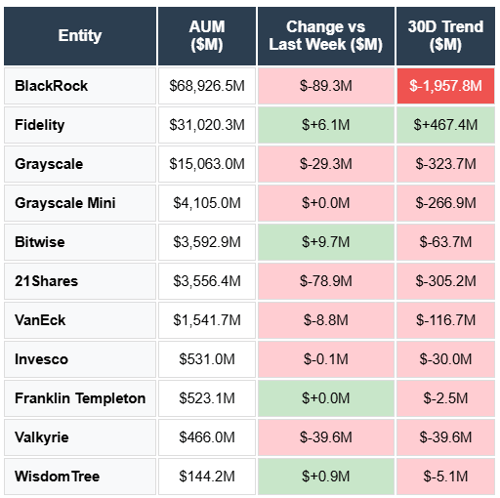
Outflows Resume After Brief Respite: Total ETF flows returned to -$229.2M for the week after prior week's +$63.0M inflow. Total AUM at $129.47B across 11 funds. 30-day trend remains deeply negative at -$2.64B. Brief inflow reversal proved temporary as institutional distribution resumed, though at reduced intensity versus October/November peaks when weekly outflows exceeded $1B regularly.
BlackRock Continues Bleeding: BlackRock led outflows at -$89.3M weekly (-$1.96B 30D) despite holding 53% market share ($68.9B AUM). 21Shares -$78.9M, Valkyrie -$39.6M, Grayscale -$29.3M, VanEck -$8.8M. However, BlackRock's weekly outflow magnitude down significantly from prior multi-billion dollar weeks, suggesting distribution phase maturing. Grayscale Mini flat at $0.0M after sustained -$266.9M monthly trend.
Fidelity/Bitwise Accumulating: Fidelity +$6.1M weekly (+$467.4M 30D) showing consistent institutional accumulation against the trend. Bitwise +$9.7M, WisdomTree +$0.9M, Franklin Templeton flat. Divergence between BlackRock selling and Fidelity buying may reflect different client bases (retail vs institutional) or basis arbitrage unwinds versus fundamental allocation. Fidelity's persistent positive 30D trend (+$467M) stands alone among major issuers.
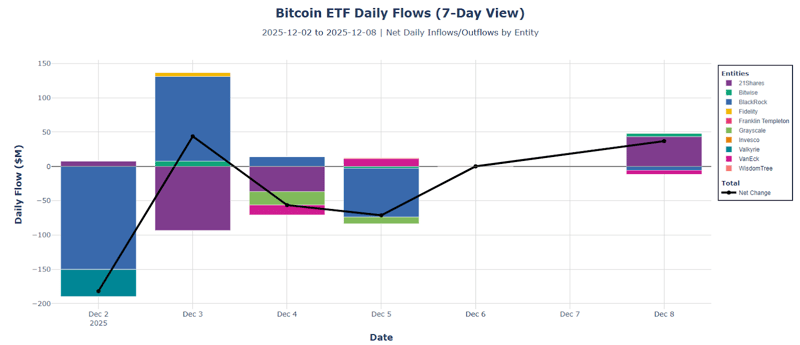
Daily Pattern Mixed: Three positive days (Dec 3, 6, 8) versus three negative (Dec 2, 4, 5). Dec 2 saw the largest single outflow at -$182.0M, followed by smaller oscillations. Dec 8 closed with +$36.9M inflow. Average daily flow at -$38.2M, well below crisis levels but still negative. No clear directional momentum in daily flows suggests consolidation rather than capitulation or renewed accumulation.
Forward Signal: Outflow magnitude compressing from crisis levels but not yet reversed. Watch for: (1) sustained daily inflows above +$50M as accumulation confirmation, (2) BlackRock flows turning positive as sentiment shift signal, (3) 30D trend inflecting toward zero as distribution exhaustion indicator. Current state: late-stage distribution with mixed signals, awaiting catalyst for directional resolution.
STABLECOIN FLOWS
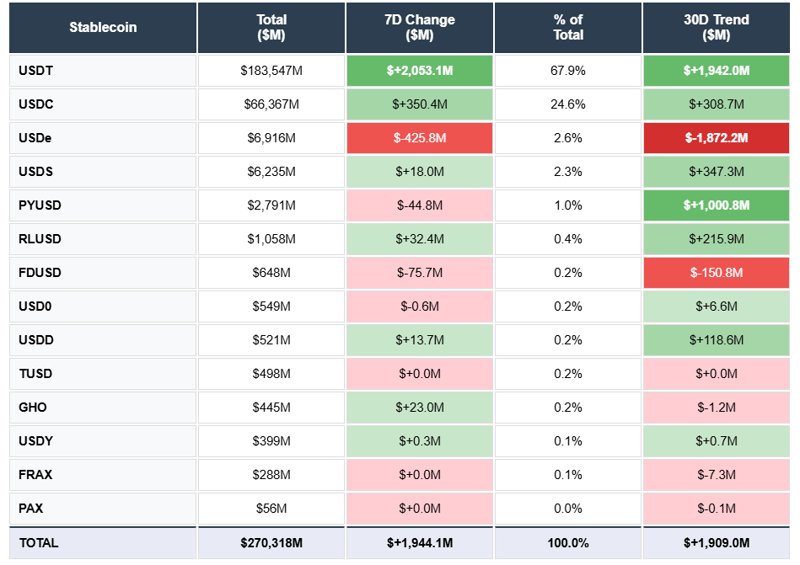
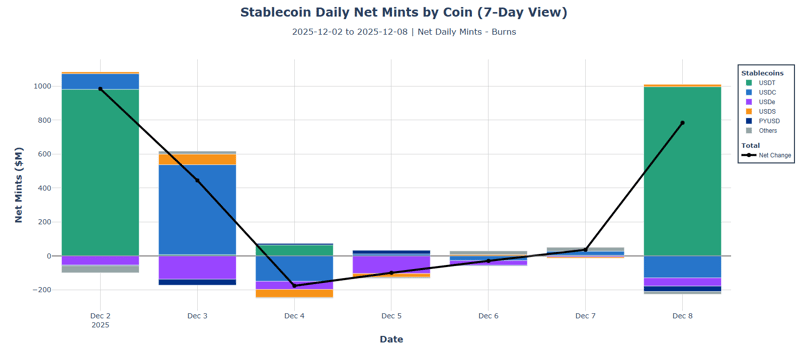
Significant Capital Returning: Stablecoin supply expanded +$1.94B to $270.3B, a dramatic acceleration from prior week's +$90.3M. 30-day trend at +$1.91B confirms sustained inflow momentum. Four minting days versus three burning days with +$277.7M daily average. Fresh dry powder entering markets at the fastest weekly pace since early November, strongly bullish for deployment potential.
USDT Dominates Inflows: USDT surged +$2.05B (+1.1% weekly growth) to $183.5B (67.9% share), the largest single-week mint in recent months. USDC added +$350.4M to $66.4B (24.6% share), continuing the institutional accumulation trend (+$308.7M 30D). RLUSD (Ripple) +$32.4M, GHO +$23.0M, USDS +$18.0M, USDD +$13.7M showing broad-based minting across smaller stables.
USDe Deleveraging Continues: USDe burned -$425.8M (-6.2% of supply) to $6.9B, extending the unwind with -$1.87B over 30 days. Ethena synthetic dollar redemptions persist as basis trades compress. FDUSD -$75.7M, PYUSD -$44.8M also saw weekly outflows, though PYUSD 30D trend remains strongly positive at +$1.0B. Market composition continuing rotation from yield-seeking synthetics toward vanilla fiat-backed stables.
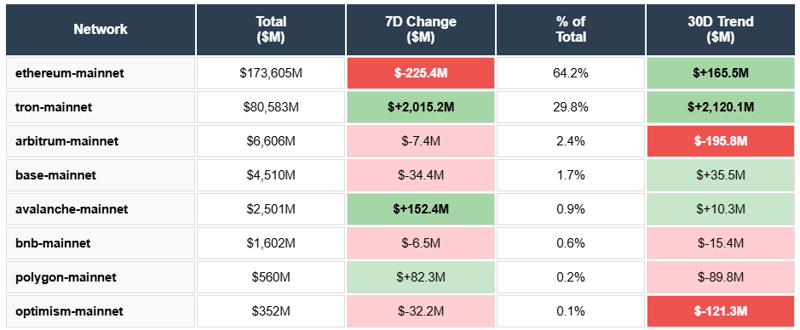
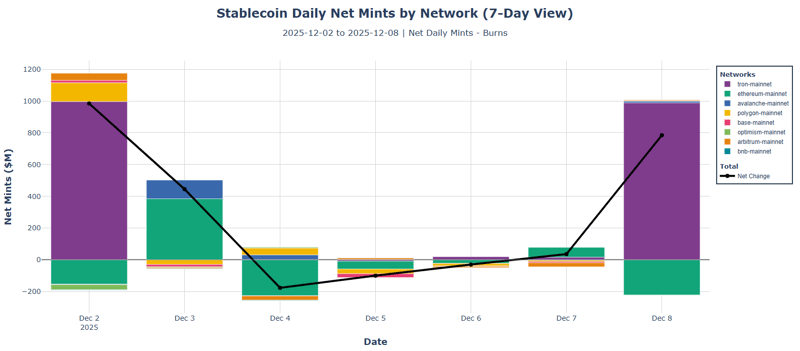
Network Flows Concentrated in Tron: Tron dominated at +$2.02B (nearly all USDT activity), reflecting offshore/CEX flow dynamics. Avalanche +$152.4M, Polygon +$82.3M showed smaller gains. Ethereum mainnet reversed to -$225.4M, Base -$34.4M, Optimism -$32.2M, Arbitrum -$7.4M. L2 and mainnet capital flowing to Tron, likely CEX deposit activity accompanying the price recovery.
Forward Signal: Near -$2B weekly minting is strongly constructive for market liquidity. USDT dominance in flows suggests retail/CEX activity returning alongside price appreciation. Watch for: (1) Ethereum mainnet minting resuming as an institutional DeFi signal, (2) USDe stabilization as a deleveraging completion indicator, (3) sustained +$500M weekly mints as bullish confirmation. Current state: significant dry powder entering, supportive of continued price recovery.
DEFI LENDING
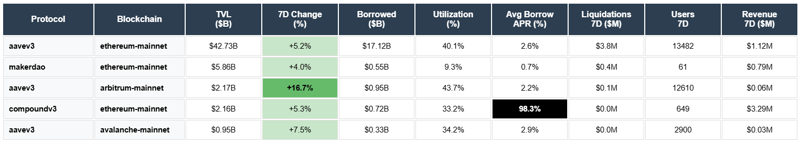
TVL Expanding, Credit Stress Resolved: Total TVL across top protocols rose to $53.87B with broad-based gains: Aave v3 Arbitrum +16.7%, Aave v3 Avalanche +7.5%, Compound v3 +5.3%, Aave v3 Ethereum +5.2%, MakerDAO +4.0%. First coordinated TVL expansion in weeks as DeFi capital returns alongside price recovery. 30-day TVL contraction moderating to -3.1% from prior double-digit declines.
Liquidations Collapsed: 7D liquidations at $4.3M, down 97% from prior week's $139.3M stress event. Aave v3 Ethereum accounted for $3.8M (88% of total), with other protocols seeing minimal forced selling. Credit stress fully resolved as collateral values stabilized and overleveraged positions cleared during prior week's volatility.
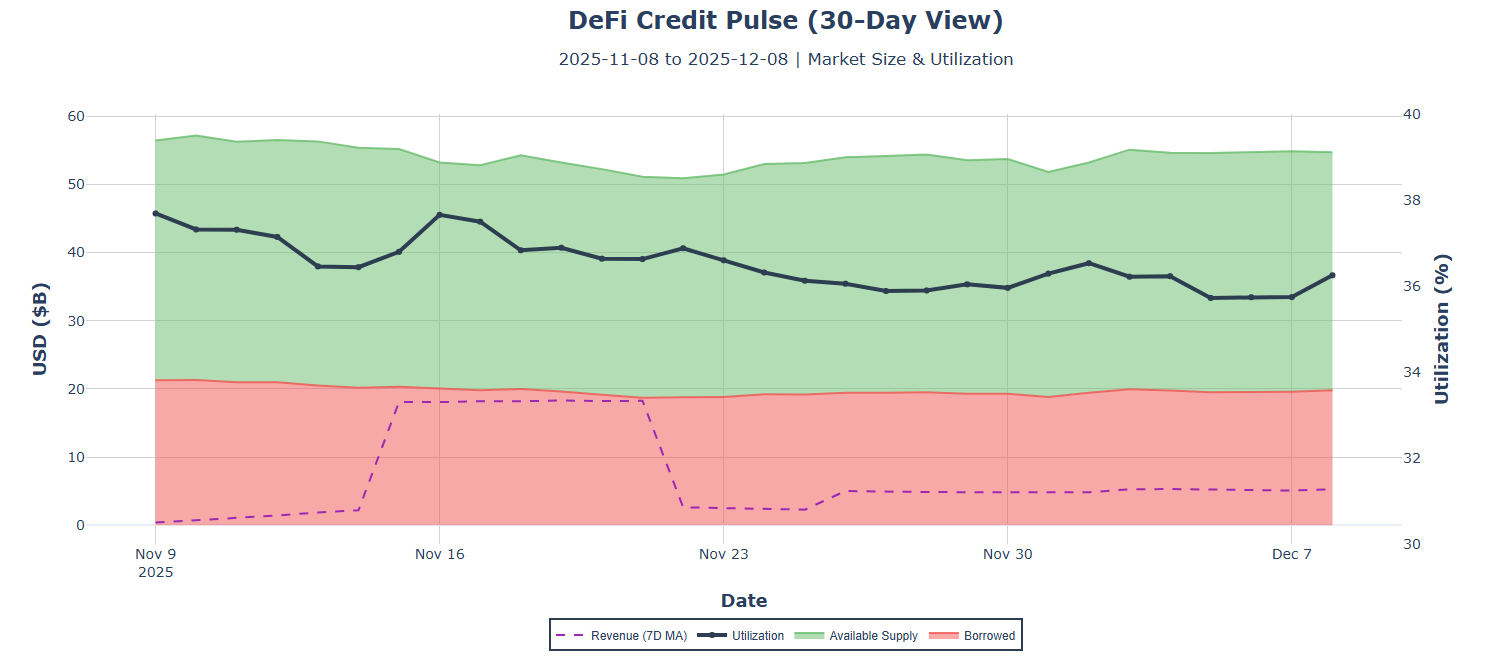
Utilization Low, Ample Capacity: Market-wide utilization at 36.2% (-1.4pp 30D) with $34.86B available lending capacity. Aave v3 Arbitrum highest at 43.7%, Aave v3 Ethereum at 40.1%, MakerDAO lowest at 9.3%. Low utilization indicates ample capacity for credit expansion without rate pressure. Borrow APRs remain competitive at 2.2-2.9% across Aave deployments.
Protocol Revenue Stable: 7D revenue at $5.28M led by Compound v3 ($3.29M) and Aave v3 Ethereum ($1.12M). Revenue holding steady despite reduced liquidation activity, indicating healthy organic borrowing demand.
Forward Signal: TVL expansion with low liquidations and stable utilization is a healthy credit environment. Watch for: (1) utilization rising above 40% as a credit tightening signal, (2) sustained TVL growth above +5% weekly, (3) liquidations remaining below $10M as stability confirmation. Current state: balanced credit market supporting continued DeFi activity.
Full-Market Research. Institutional Depth. Derivatives, ETFs, on-chain, DEXs, microstructure, risk signals—and more. Subscribe at the bottom of our page for research that covers every corner of crypto and visit the Amberdata Research Blog.
Access Amberdata Intelligence for institutional-grade digital asset intelligence powering actionable insights across blockchain and market data, or contact our team to discuss custom solutions for your risk management strategy.

Links & Resources
Amberdata Research Library
https://www.amberdata.io/research-library
Amberdata Intelligence Platform
Amberdata Docs
Contact Us
https://www.amberdata.io/contact-us
Recent from Amberdata (most recent at the top)
- The ETF Exodus Decoded: Basis Arbitrage, Not Capitulation
- Coincidence or Signal? Did WLFI Telegraph Crypto's $6.93B Meltdown
- How $3.21B Vanished in 60 Seconds: October 2025 Crypto Crash Explained Through 7 Charts
- Five Signals of FOMC Impact: How Interest Rate Decisions Reshape Crypto Market Microstructure
- Beyond the Spread - Understanding Market Impact and Execution
- The Rhythm of Liquidity - Temporal Patterns in Market Depth
- DeFi Activity, Stablecoins, and the Impact on Price Volatility: Part 1
- DeFi Activity, Stablecoins, and the Impact on Price Volatility: Part 2
- DeFi Activity, Stablecoins, and the Impact on Price Volatility: Part 3
- How Do On-Chain Metrics Explain Bitcoin Volatility? Part 1
- How Do On-Chain Metrics Explain Bitcoin Volatility? Part 2
- Amberdata 2024 Digital Asset Market Intelligence Report: Exchanges & Derivatives
- Crypto Pairs Trading: Part 1 — Foundations of Moving Beyond Correlation
- Crypto Pairs Trading: Part 2 — Verifying Mean Reversion with ADF and Hurst Tests
- Crypto Pairs Trading: Part 3 — Constructing Your Strategy with Logs, Hedge Ratios, and Z-Scores
- Crypto Pairs Trading: Part 4 — Empirical Results & Performance Analysis
Disclaimers
The information contained in this report is provided by Amberdata solely for educational and informational purposes. The contents of this report should not be construed as financial, investment, legal, tax, or any other form of professional advice. Amberdata does not provide personalized recommendations; any opinions or suggestions expressed in this report are for general informational purposes only.
Although Amberdata has made every effort to ensure the accuracy and completeness of the information provided, it cannot be held responsible for any errors, omissions, inaccuracies, or outdated information. Market conditions, regulations, and laws are subject to change, and readers should perform their own research and consult with a qualified professional before making any financial decisions or taking any actions based on the information provided in this report.
Past performance is not indicative of future results, and any investments discussed or mentioned in this report may not be suitable for all individuals or circumstances. Investing involves risks, and the value of investments can go up or down. Amberdata disclaims any liability for any loss or damage that may arise from the use of, or reliance on, the information contained in this report.
By accessing and using the information provided in this report, you agree to indemnify and hold harmless Amberdata, its affiliates, and their respective officers, directors, employees, and agents from and against any and all claims, losses, liabilities, damages, or expenses (including reasonable attorney’s fees) arising from your use of or reliance on the information contained herein.
Copyright © 2025 Amberdata. All rights reserved.