Share this blog:
Apply Stock To Flow Ratio to determine future Bitcoin prices
If you are involved with crypto assets in general or Bitcoin in particular, you have probably noticed this palpable frenzy on social media about the next Bitcoin halving, estimated to happen in 20 days from today on May, 12th of this year.
And for a good reason: all past halvings have been followed by substantial changes in the Bitcoin prices, hence all the anxiety and/or excitement, depending on which side of the coin you reside (pun intended!).
TL;DR
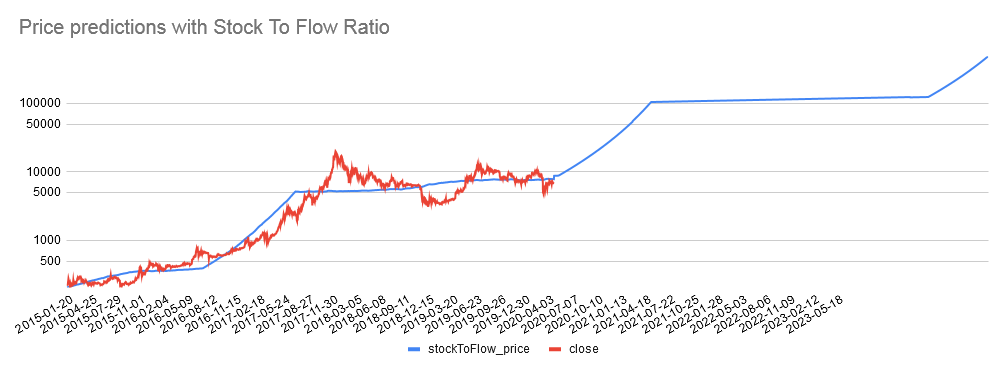
We have been inspired by PlanB and Nick Emblow’s work on Stock-to-Flow and just added these metrics to our API. You can now get real-time and predicted supply, stock-to-flow ratio & price directly:
Background on Bitcoin
Bitcoin is a digital asset created by Satoshi Nakamoto in late 2008 (white paper publication) / beginning of 2009 (creation of the genesis block). It is one of the first (the first?) scarce digital assert ever created.
By design, Bitcoin is scarce because the total supply of bitcoins is limited to 21 millions. Period. Once all bitcoins have been unearthed by the miners, the supply will be fixed forever. This scarcity is part of what drives the price of Bitcoin, similar to many commodities such as Gold or Soy-beans. And also, what one can argue, will ensure it remains valuable over long periods of time.
Miners are rewarded a certain amount of bitcoins when they find the next cryptographic hash as part of the PoW protocol, and this is how new coins are minted. This subsidy started with 50 coins, and it is cut in half every 210,000 blocks or roughly every 4 years, until it reaches 0 when all the 21 million coins have been extracted.
until 2012–11–28: issuance = 50 bitcoins (actual)
until 2016–07–09: issuance = 25 bitcoins (actual)
until 2020–05–12: issuance = 12.5 bitcoins (predicted)
until 2024–05–09: issuance = 6.25 bitcoins (predicted)
…
In that sense, Bitcoin is comparable to other scarce physical resources like Gold, Silver or other rare metals:
- there is a limited supply available on Earth
- it is difficult to extract and mine (resulting in small/controlled production)
- it is difficult/impossible to forge
Based on these properties, is there a relationship between production, supply and price, and can we use one to predict the other?
Stock to Flow
In traditional markets, economists have looked at stock to flow models to price and evaluate commodities:
- stock: existing stock of a commodity
- flow: new annual supply of the same commodity
The relationship between the two is called the stock-to-flow ratio and can be used to quantify the scarcity of a commodity. Gold and silver have the highest stock-to-flow ratio among all precious metals, way above the next top commodities (palladium and platinum):
SF(Gold) = 62
SF(Silver) = 22
SF(palladium) = 1.1
SF(platinum) = 04
In comparison, SF(Bitcoin) = 27 puts it at the very top of the most scarce commodities on the planet. To continue the analogy, Gold dominance as a store of value throughout history is not so much because of the limited amount of supply, but because of the consistent low annual production relative to the existing stock.
For example, given:
- amount of Gold ever mined: 190,000 tons
- annual production: 3,200 tons
- SF = 190,000 / 3,200 ~ 60 years
Which means it would take 60 years at the current production levels to reach the current stock (for Bitcoin, the total amount mined so far is roughly 18,000,000 with a yearly production of 657,000 which gives us the ratio of 27 mentioned above).
How to derive price
PlanB and Nick Emblow have studied extensively Bitcoin stock to flow ratio and its relationship to price — check out their blog posts on the subject (here and here) for an in depth analysis and explanation on why the model is valid and why it holds up over time.
Let’s use Amberdata’s API to reproduce some of their results and see how we can determine future Bitcoin prices.
First let’s get actual Bitcoin prices since 2015 (we’ll use Coinbase prices):
- documentation: https://docs.amberdata.io/reference#get-historical-ohlc
- endpoint: market/ohlcv/btc_usd/historical?exchange=gdax&format=csv

Bitcoin prices (source: amberdata.io)
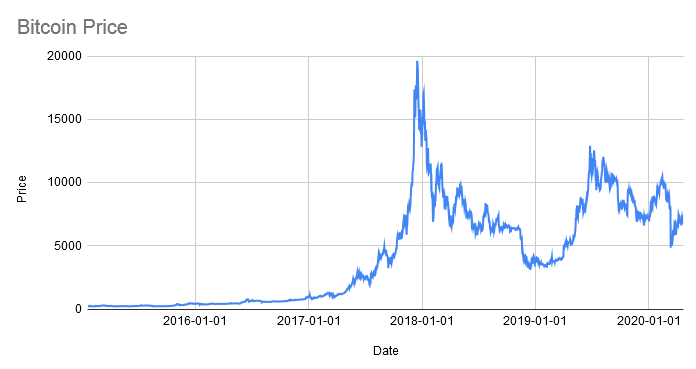
Bitcoin prices (source: amberdata.io)
Then we’ll need historical Bitcoin supplies so we can calculate the stock-to-flow ratio:
- documentation: https://docs.amberdata.io/reference#market-asset-metrics-historical
- endpoint: market/metrics/btc/valuations/historical?format=csv
Given the time series of Bitcoin supplies, we can easily derive the annual production by removing the total supply of 1 year ago from the current supply:
- annual_production(t) = supply(t) - supply(t - 1 year)
- stock_to_flow_ratio(t) = supply(t) / (supply(t) - supply(t - 1 year))

Bitcoin Supply (source: amberdata.io)
As proven by Nick Emblow:
[…] stock to flow does have a significant influence on the US Dollar price of Bitcoin.
We can estimate this relationship with by a power law — we use the logarithm of each value (price and ratio) to normalize the data and remove any trend or seasonality before applying linear regression:

Logarithmic values
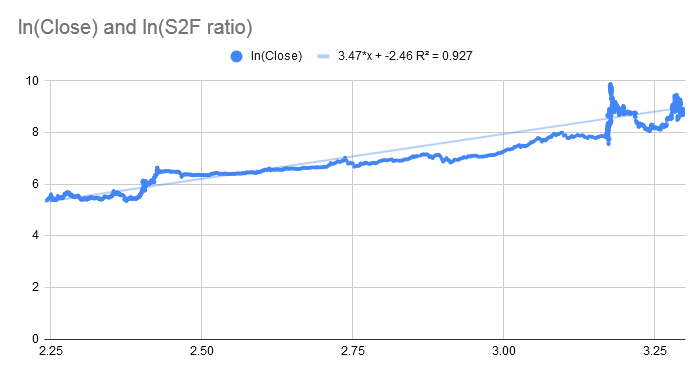
Linear regression to estimate power law relationship (source: amberdata.io)

Actual factors
A R-Squared value of almost 93% supports the thesis that stock-to-flow has direct influence on the price of Bitcoin. Based on these results, we can now derive price as:
- price = e^(-2.464996674) * S2F ^ 3.470942032
And use this formula to estimate where the price of Bitcoin is headed, especially after the next halving in 20 days from now and in the years to come.
How good is the model
Now that we have the prices as predicted by stock-to-flow ratio and the actual prices, we can look at the difference between the two to get an idea of how much deviation exists between them.
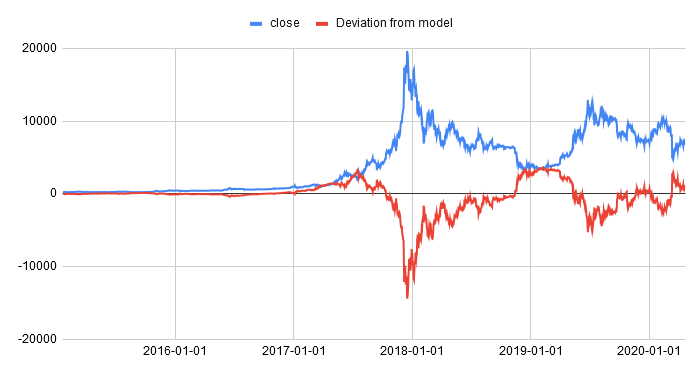
Bitcoin price & difference with Prediction model (source: amberdata.io)
Interesting to note here how:
- deviation increases when the price of Bitcoin spikes
- both are pretty much a mirror image of each other
- as with any valuation model, deviation from the modeled price may be an indicator of a trading opportunity
It is important to remember here that the model is only as good as the original assumptions made to derive it, and we need to constantly (re-)evaluate if these assumptions still hold. In this case, we need to check for cointegration, which will give us an indication of how good the model holds, i.e. how much the price is drifting from the model (in the example above, it is most likely that stock-to-flow was not cointegrated with price around January of 2018).
In the future, we plan on adding cointegration metrics (like Residual Likelihood Indicator & Mean Reversion Indicator) to the API to indicate how trustworthy the model is at a specific point in time, based on the excellent work from Nick Emblow.
Conclusion
We have shown how using a traditional financial indicator (stock-to-flow ratio) can be applied to crypto assets like Bitcoin, and used to predict future prices, or at least the price expected order of magnitude in the next few years.
So, when will Bitcoin reach $100K ? On May 6th, 2021, according to this valuation model. Of course this should be taken with a grain of salt and does not constitute any financial advice of any sort. We can only wait and see how the market is going to unfold around the next halving.
The stock to flow ratio and derived prices are now fully integrated with our API, and users can retrieve these metrics at any point in time in the past or in the future.
Huge thanks and hats off to PlanB and Nick Emblow on the amazing work they’ve done on Stock to Flow and their contributions to the Bitcoin community!