Share this blog:
Last week, the Amberdata team held its first hackathon, and tons of great ideas and projects were born during these three days of intense coding and sleepless nights.
For this project, I wanted to showcase both:
- how our API seamlessly integrates both blockchain and market data
- how to marry historical (HTTP) and real-time (Websockets) together in order to achieve meaningful and reactive dashboards
The goals I set for myself were simple: a standalone application (Vue.js was the obvious choice), rely solely on the Amberdata API, and no other external dependencies - so anybody would be able to run it by themselves, explore the different avenues possible, and expand upon it.
And thus, the Crypto Market Explorer was born!
Summary
From a trading perspective, the first thing of order is to understand which assets (aka pairs) are available, and which exchanges support them.
Two different endpoints can be used here:
They provide the same information, organized and sorted differently. These are actually very descriptive endpoints, which allows us to generate different charts and gain a lot of insights into the market data.
Supported exchanges
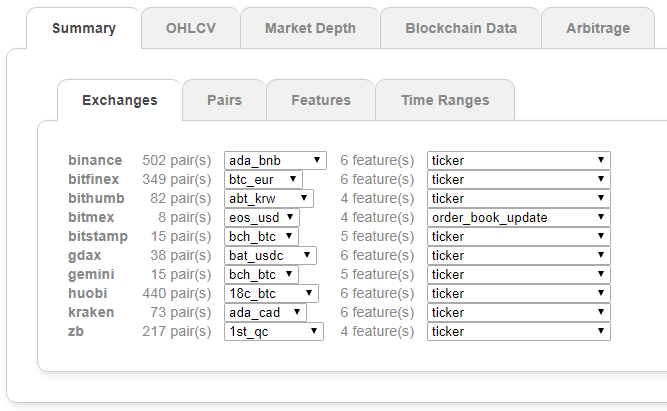
List of supported exchanges and associated features
At a quick glance, we can see the list of 10 supported exchanges (at the time of writing), and how many pairs they support - Binance, Bitfinex and Huobi being the 3 top from that perspective.
Also, note that not all exchanges support all the different features: OHLCV, Order Book snapshots, Order Book events, Order Book BBOs (Best Bid Offers), Tickers and Trades, which is important to know when trading or looking to back-test a strategy.
Supported pairs
More often than not, traders are interested in a specific pair first, exchange(s) second - especially when looking for arbitrage opportunities for example.
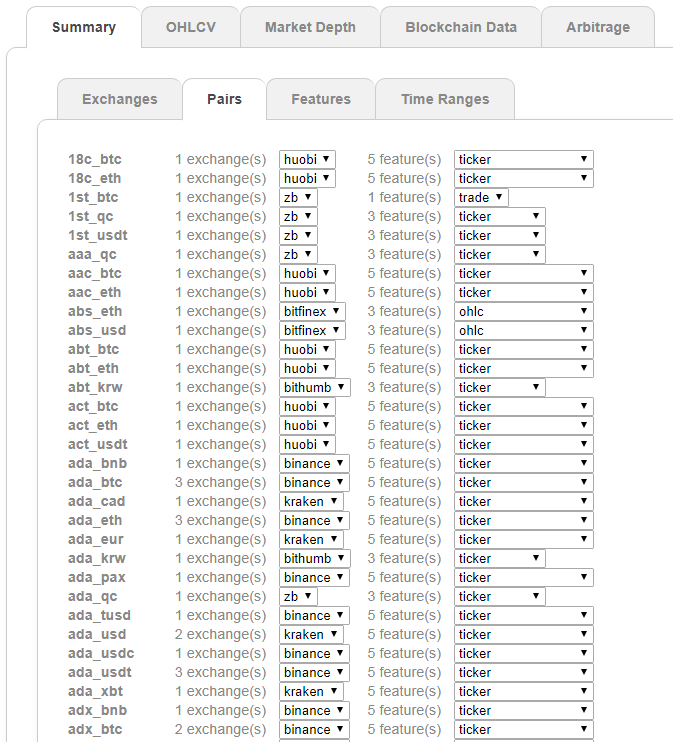
List of supported pairs and associated features
Notice that:
- not all exchanges support all pairs (in fact, quite often a pair is only supported by one exchange)
- not all exchanges support all the features (some do not support Tickers, or OHLCV for example)
Lifetime of assets
This is the dashboard you want to look at when getting ready to back-test a strategy, as you will want to understand (among other things):
- when an asset first started trading and how much data is available (i.e. will my testing be statistically relevant)
- which assets have been discontinued (so they can be discarded from the testing)
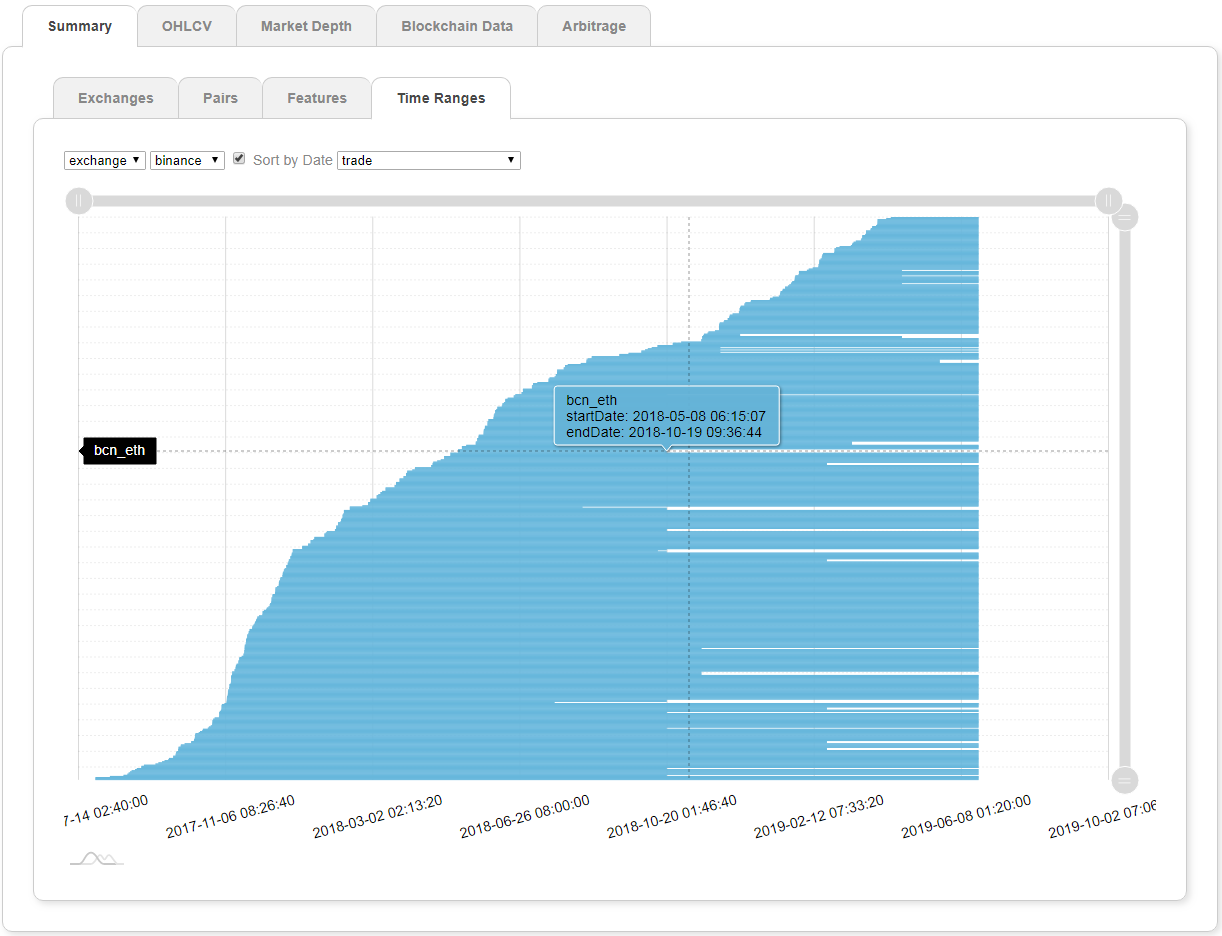
Time Ranges
In the chart above, we can see the distribution over time for all trades on Binance, and how bcn_eth was discontinued on October 19th for example. It is a very powerful visualization as all the information about each exchange, and each feature is available at a glance - no scrolling through pages and pages to get at the relevant information.
And again, all of these were created from the results of just one endpoint!
Price data
What is the most important piece of information when it comes down to trading? Accurate, real-time price data for an asset. In this case, we use the OHLCV (Open, High, Low, Close and Volume) endpoint, which is the base for trading indicators for example. Three endpoints of interest here:
- https://web3api.io/api/v1/market/ohlcv/information - information about exchanges which support OHLCV (and associated pairs)
- https://web3api.io/api/v1/market/ohlcv/:pair/historical - historical prices for a specific pair
- https://web3api.io/api/v1/market/ohlcv/:pair/latest - most current price information for a specific pair

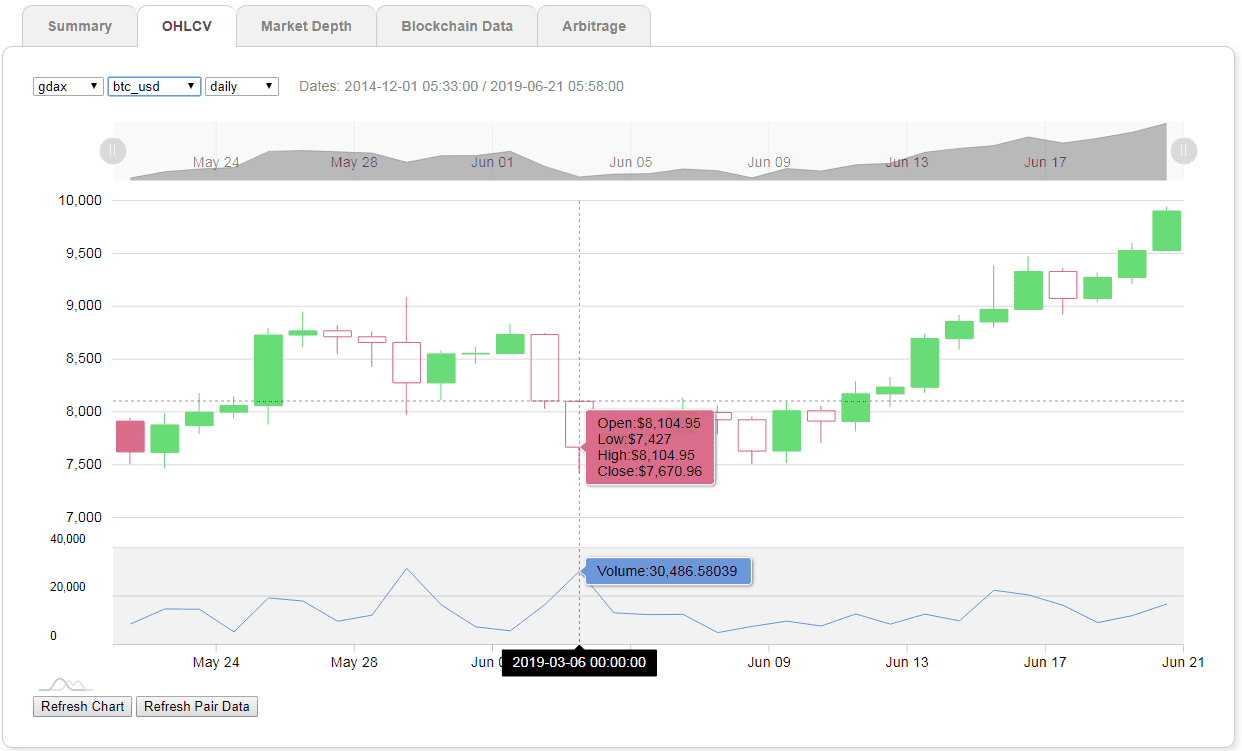
Example of OHLCV
This is a classic price chart, with standard features like:
- open, high, low, close prices and corresponding volume
- daily, hourly and minutely time granularity
- bars represented as candle sticks
Market Depth
No trading platform would be complete without a market depth. For this we need:
- the latest order book: https://web3api.io/api/v1/market/orders/pair?exchange=:exchange
- new order book events, via websockets: subscribe:[market:orders]
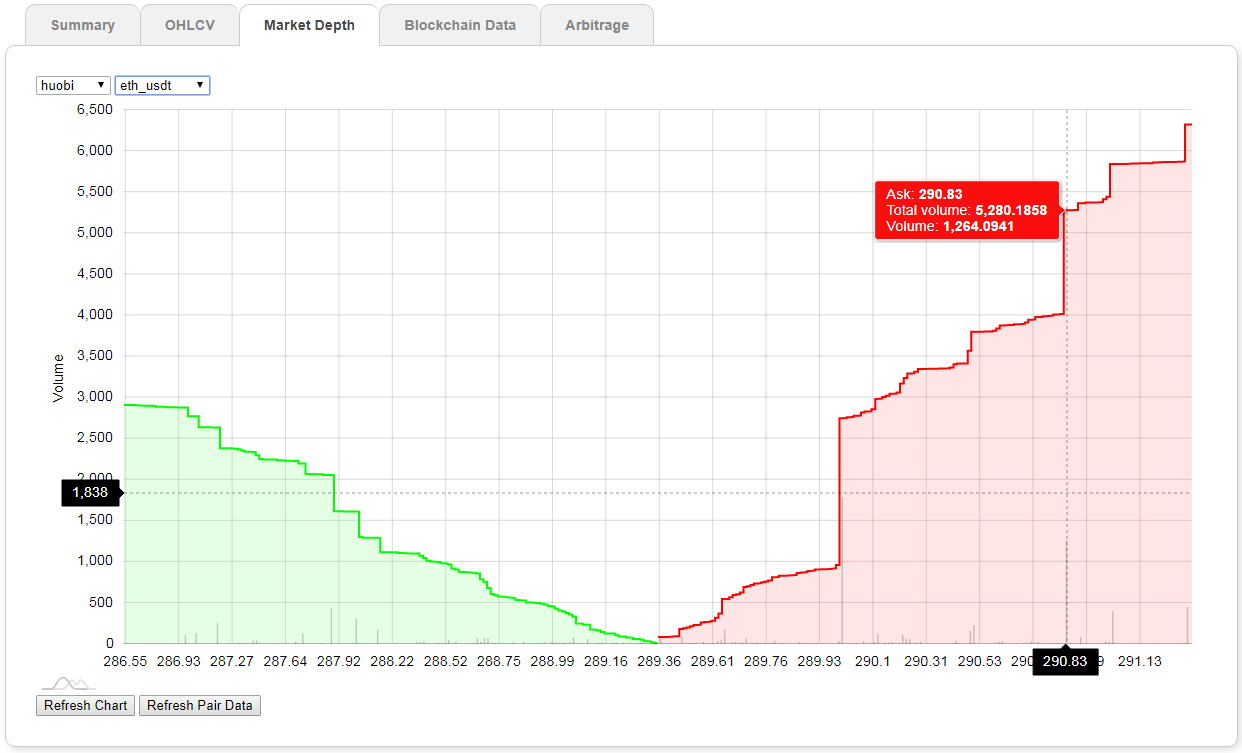
Market Depth for eth_usdt on Huobi
The current implementation is updated every 30 seconds, and retrieves the latest order book snapshot from the API directly. However, market depth representations are much more interesting with real-time updates, as live changes to the market are used to make trading decisions.
This is something I did not have time to implement during the hackathon, but thankfully Taylor Dawson is currently working on integrating websockets into this chart, and we should release a new tutorial - coming soon!
Blockchain data
This is where we tie blockchain and market data together. The most interesting feature here is the token transfers analysis. This chart looks at pending token transfers, i.e. token transfers which have not been finalized and are waiting to be confirmed.
We use two different endpoints and filter out transactions which are not token transfers (the address is the address of the token corresponding to the asset/pair of interest):
- https://web3api.io/api/v1/addresses/:address/pending-transactions
- https://web3api.io/api/v1/addresses/:address/transactions
And with the addition of the filter includePrice=true, the historical pricing information is returned in the same call.
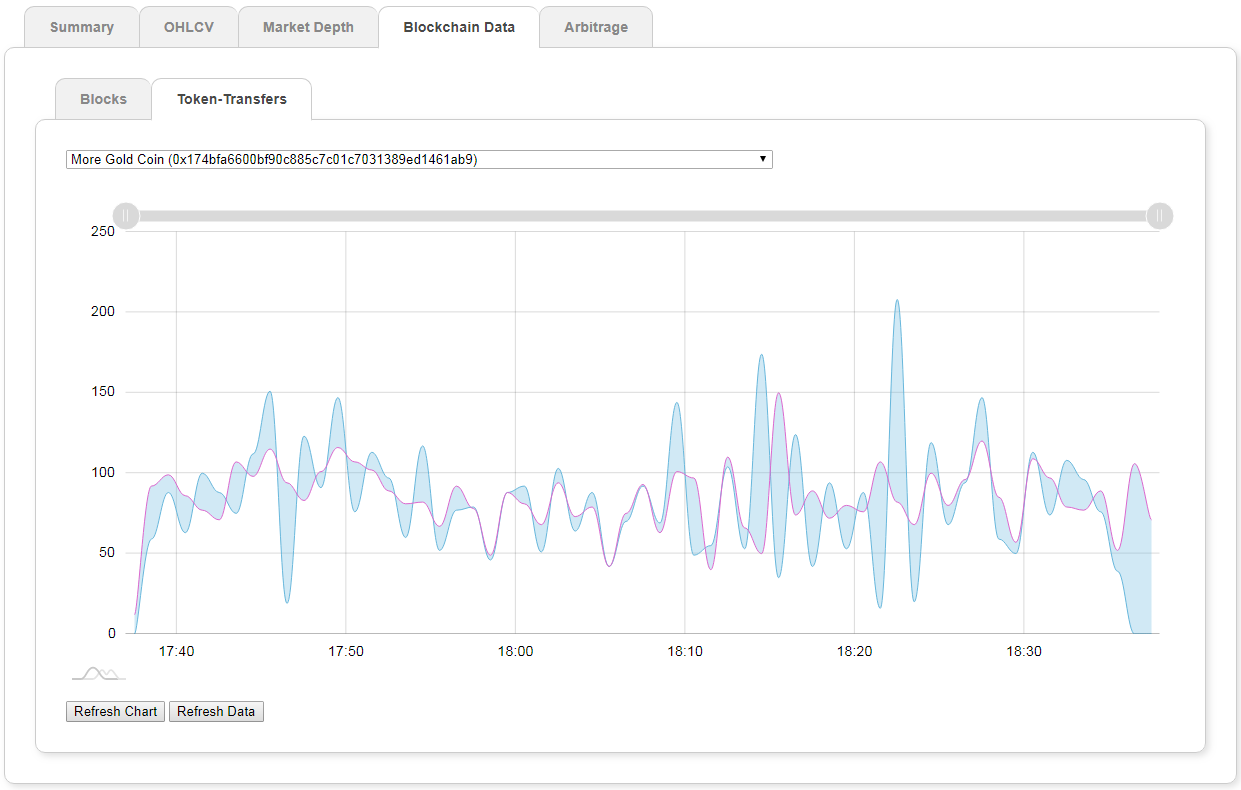
Pending Token Transfers
Why is this interesting? Comparing the ratio of pending against confirmed token transfers can be used as a predictive tool, and hint as to which direction an asset/token price might take:
- an increase of the ratio of pending versus confirmed transfers could indicate a liquidation event
- while a sudden drop in token transfers could indicate a lost of interest and have the opposite effect on price
The idea here is that by looking at blockchain data, we might be able to anticipate the market behavior before it actually happens on the exchanges themselves.
Arbitrage
This was a fun addition to the market explorer, where we try to identify arbitrage opportunities. The approach here is very simple, and used only to showcase the capabilities of the API, but is nowhere intended to be used in a professional setting.
We need bid/ask pricing information, which can be obtained with two different endpoints:
- list of all tickers: https://web3api.io/api/v1/market/tickers/information
- latest information: https://web3api.io/api/v1/market/tickers/pair/latest
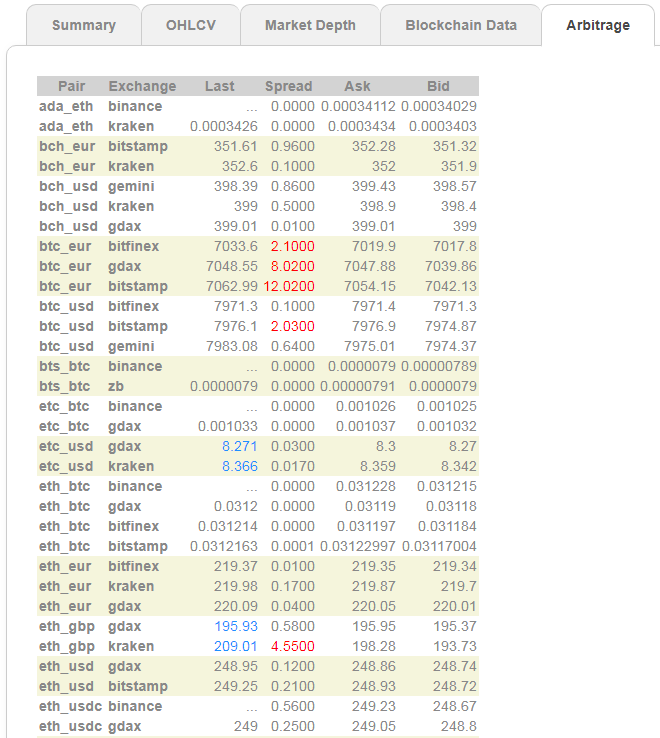
Arbitrage example
Unusual bid-ask spread are highlighted in red.
Arbitrage opportunities are highlighted in blue — the heuristic used is 1% (or more) of the range difference - max(price)-min(price) - of all prices of a pair across all the exchanges which supports it.
Final thoughts
The hackathon was a lot of fun, and seeing how participants use the API and what they built on top of it was very insightful. A few patterns emerged during these three days:
- HTTP call for historical data + websocket for real-time events (instead of cumbersome periodic refresh, with close to no latency)
- event subscription + HTTP call for more detailed information (light weight approach, more reactive applications)
The combination of the two can be used in many different ways. We are working on a wrapper library which will make it easier and more transparent to interact with these endpoints and to manage the websockets - stay tuned!
Other things on our list:
- Analyzing burn and mint events as a predictive tool for token prices (similar idea to the pending token transfers)
- Plotting BBOs (with https://web3api.io/api/v1/market/orders/pair/bbo and subscribe:[market:bbos])
- Triangular arbitrage
The Crypto Market Explorer and all the code behind it is available on Github: https://github.com/amberdata/market-explorer.
As always, we are very interested in your comments, feedback & thoughts, and we are looking forward to what you will build on top of our APIs. Don’t hesitate to reach out!
- Email: [hello@amberdata.io](mailto: hello@amberdata.io)
- Twitter: @amberdataio
- Website: Amberdata.io