


Share this blog:

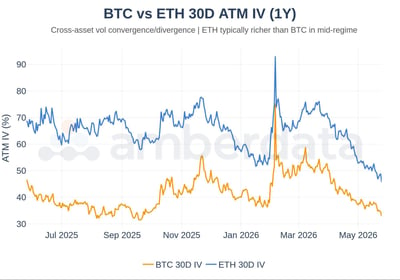
The FOMC May minutes released Wednesday confirmed a two-sided framework with a majority warning hikes may be needed if inflation persists; the 10-year eased back to 4.56% from a 52-week high of 4.687% intra-week, with markets pricing roughly 34% odds of a 2026 hike. NVDA beat strongly ($81.6B revenue, +85% YoY) but the stock fell on buy-the-rumor, sell-the-news; April PCE lands May 28. Inside crypto, BTC and ETH IV compressed further to 90-day lows (0th percentile), VRP unwound from its extreme (BTC 75th, ETH 33rd), and ETH positioning is at a 90-day high crowded long while institutional block flow turned heavy puts.
|
KEY TAKEAWAYS |
|
Executive Summary
1. Cover Page
|
KEY TAKEAWAYS |
|
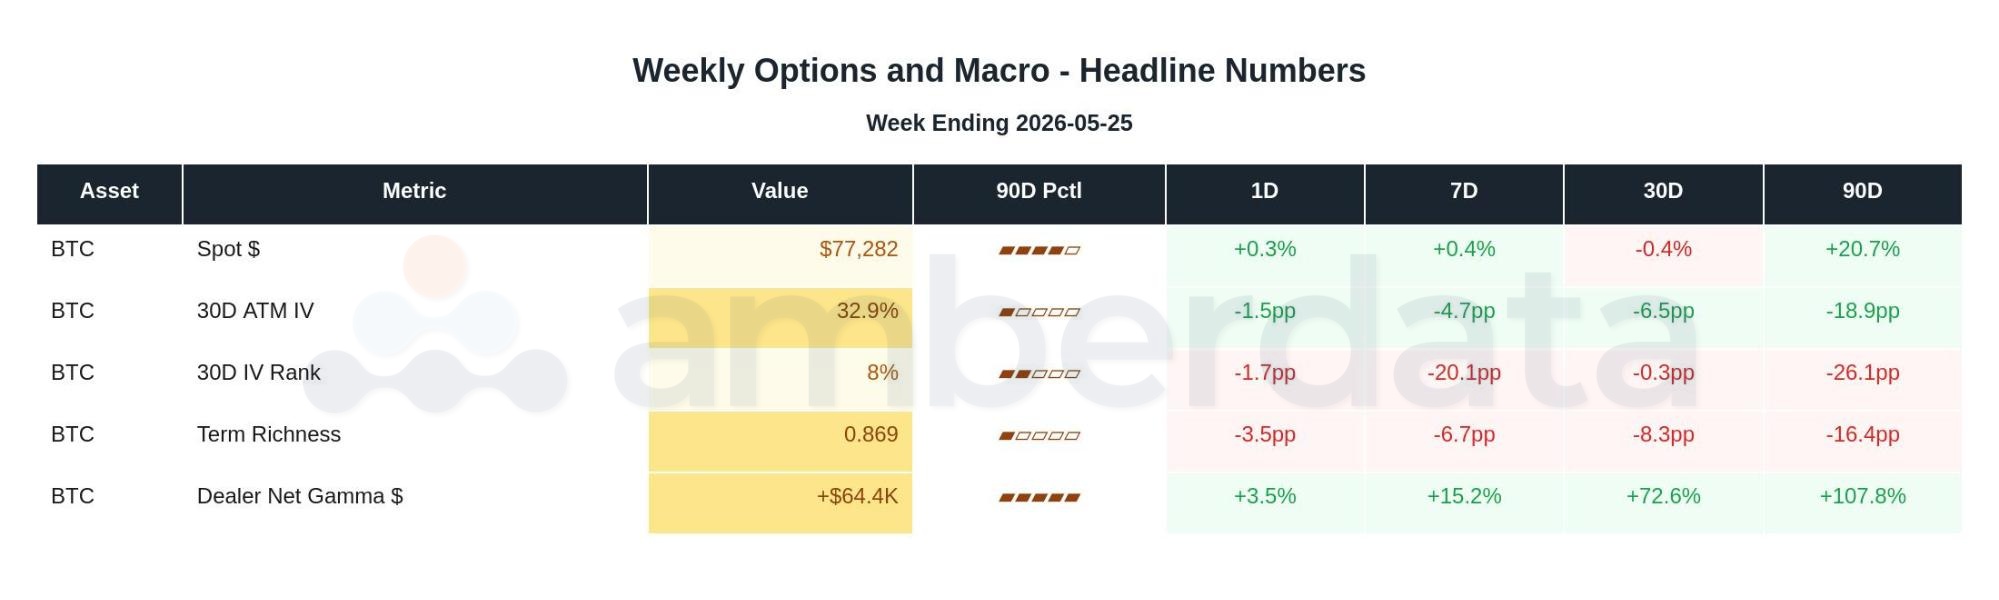
BTC at $77.3K (72nd percentile) trades against IV at a 90-day low (0th for both majors), VRP compression from last week's extremes, and ETH positioning at a 90-day high crowded long. The catalysts landed without delivering vol; the compression has not produced a regime change.
2. USA Week Ahead
|
KEY TAKEAWAYS |
|
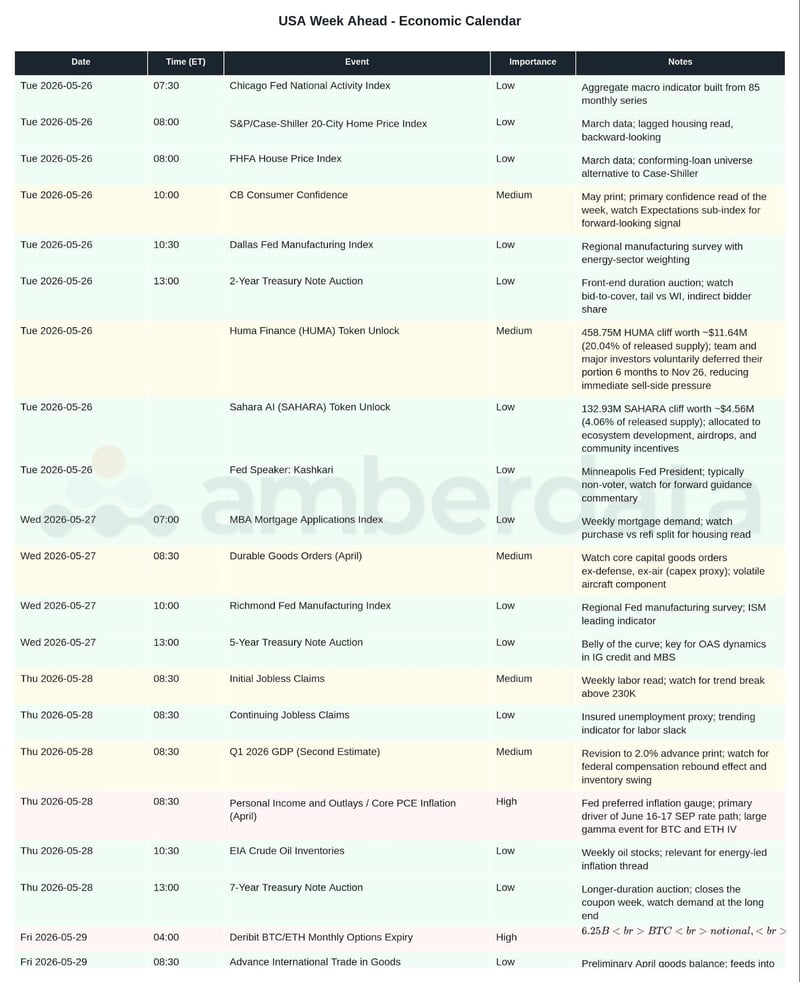
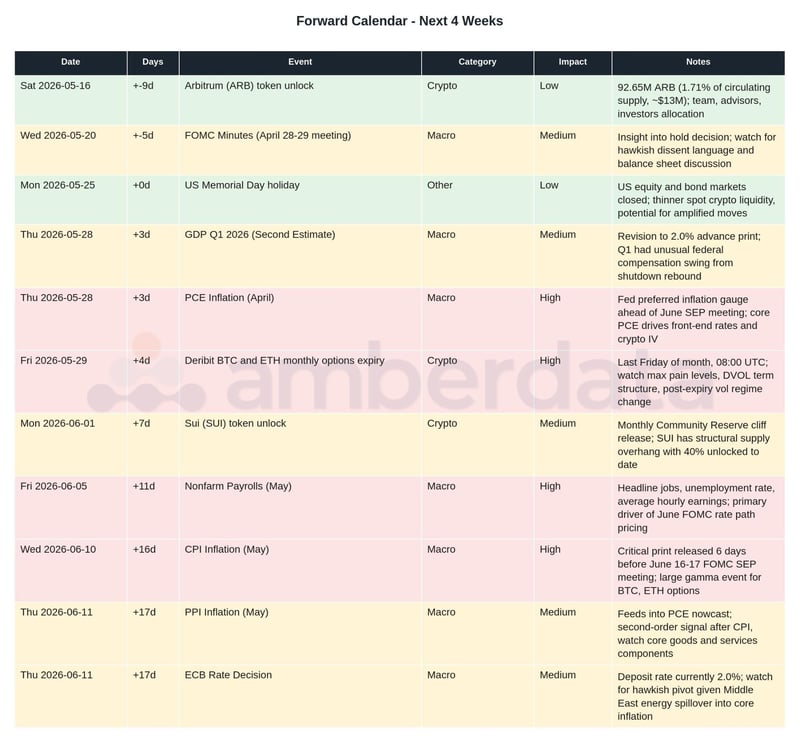
April PCE lands Thursday May 28, the Fed's preferred inflation gauge and the first datapoint of the post-Warsh era; consensus around 2.7-2.8% core annual. Monthly Deribit options expiry on Friday May 29 is the largest single-day vega event on the crypto calendar. May NFP follows June 5.
3. Forward Calendar
|
KEY TAKEAWAYS |
|
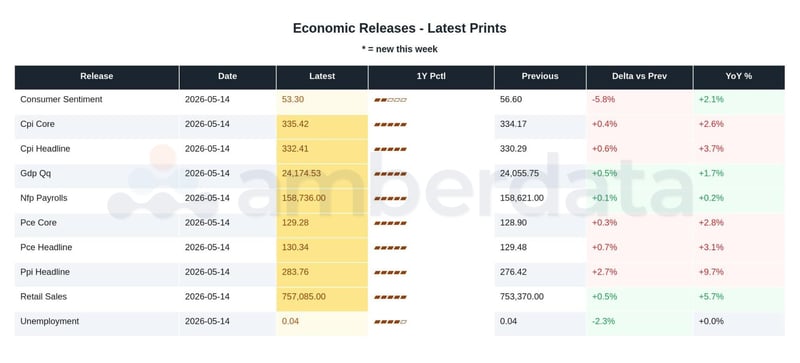
The June FOMC on June 16-17 is the dominant 30-day event, Warsh's first formal policy decision under the two-sided framework. April PCE (May 28), May NFP (June 5), and May CPI (June 10) sequence into the meeting and set the dissent map. Polymarket prices a 2026 hike at roughly 34%; CME FedWatch has December hike odds above 50%.
4. Macro Recap
|
KEY TAKEAWAYS |
|
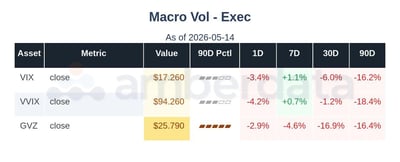
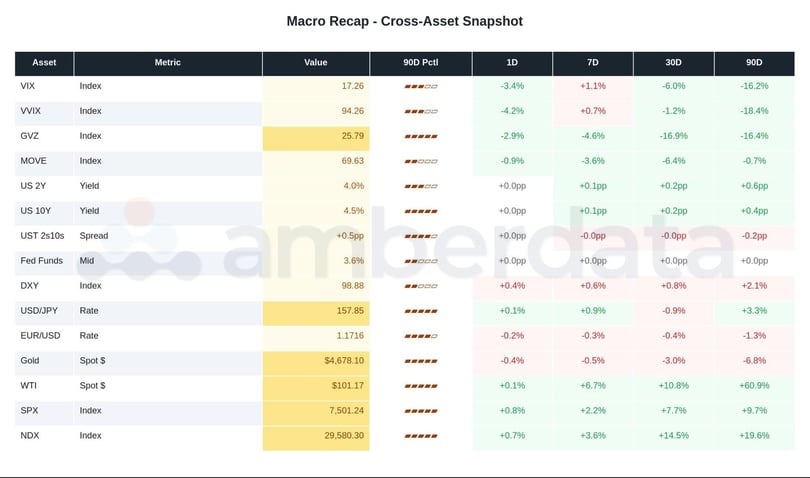
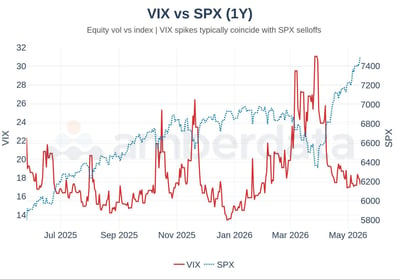
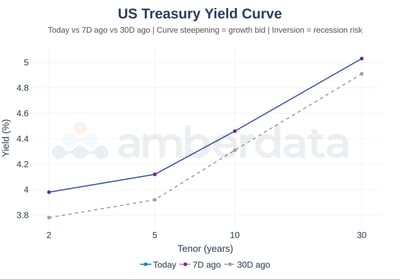
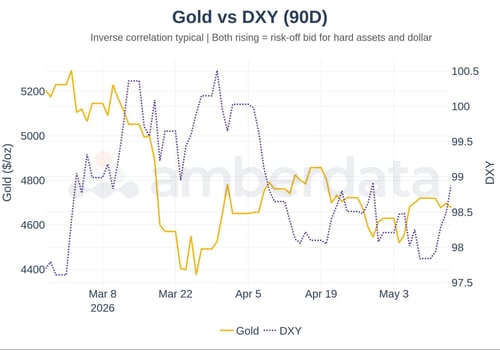
The 10-year closed at 4.56% after touching a 52-week high of 4.687% intra-week; the 30-year also hit a 52-week high at 5.197%. FOMC May minutes confirmed a two-sided rate framework with a majority warning hikes if inflation persists. NVDA beat ($81.6B revenue, +85% YoY) but the stock fell on buy-the-rumor positioning. GVZ at 25.79 (92nd percentile) remains the cross-asset standout.
CHARTS
DETAIL TABLES
5. Asset Snapshot
|
KEY TAKEAWAYS |
|
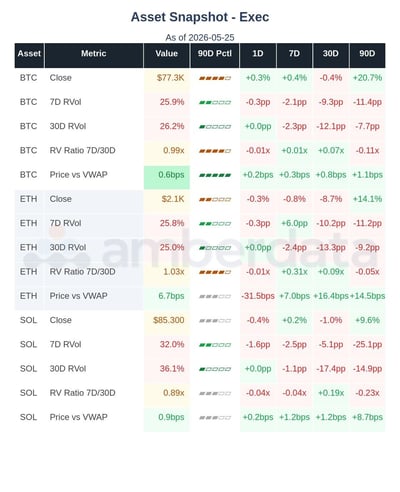
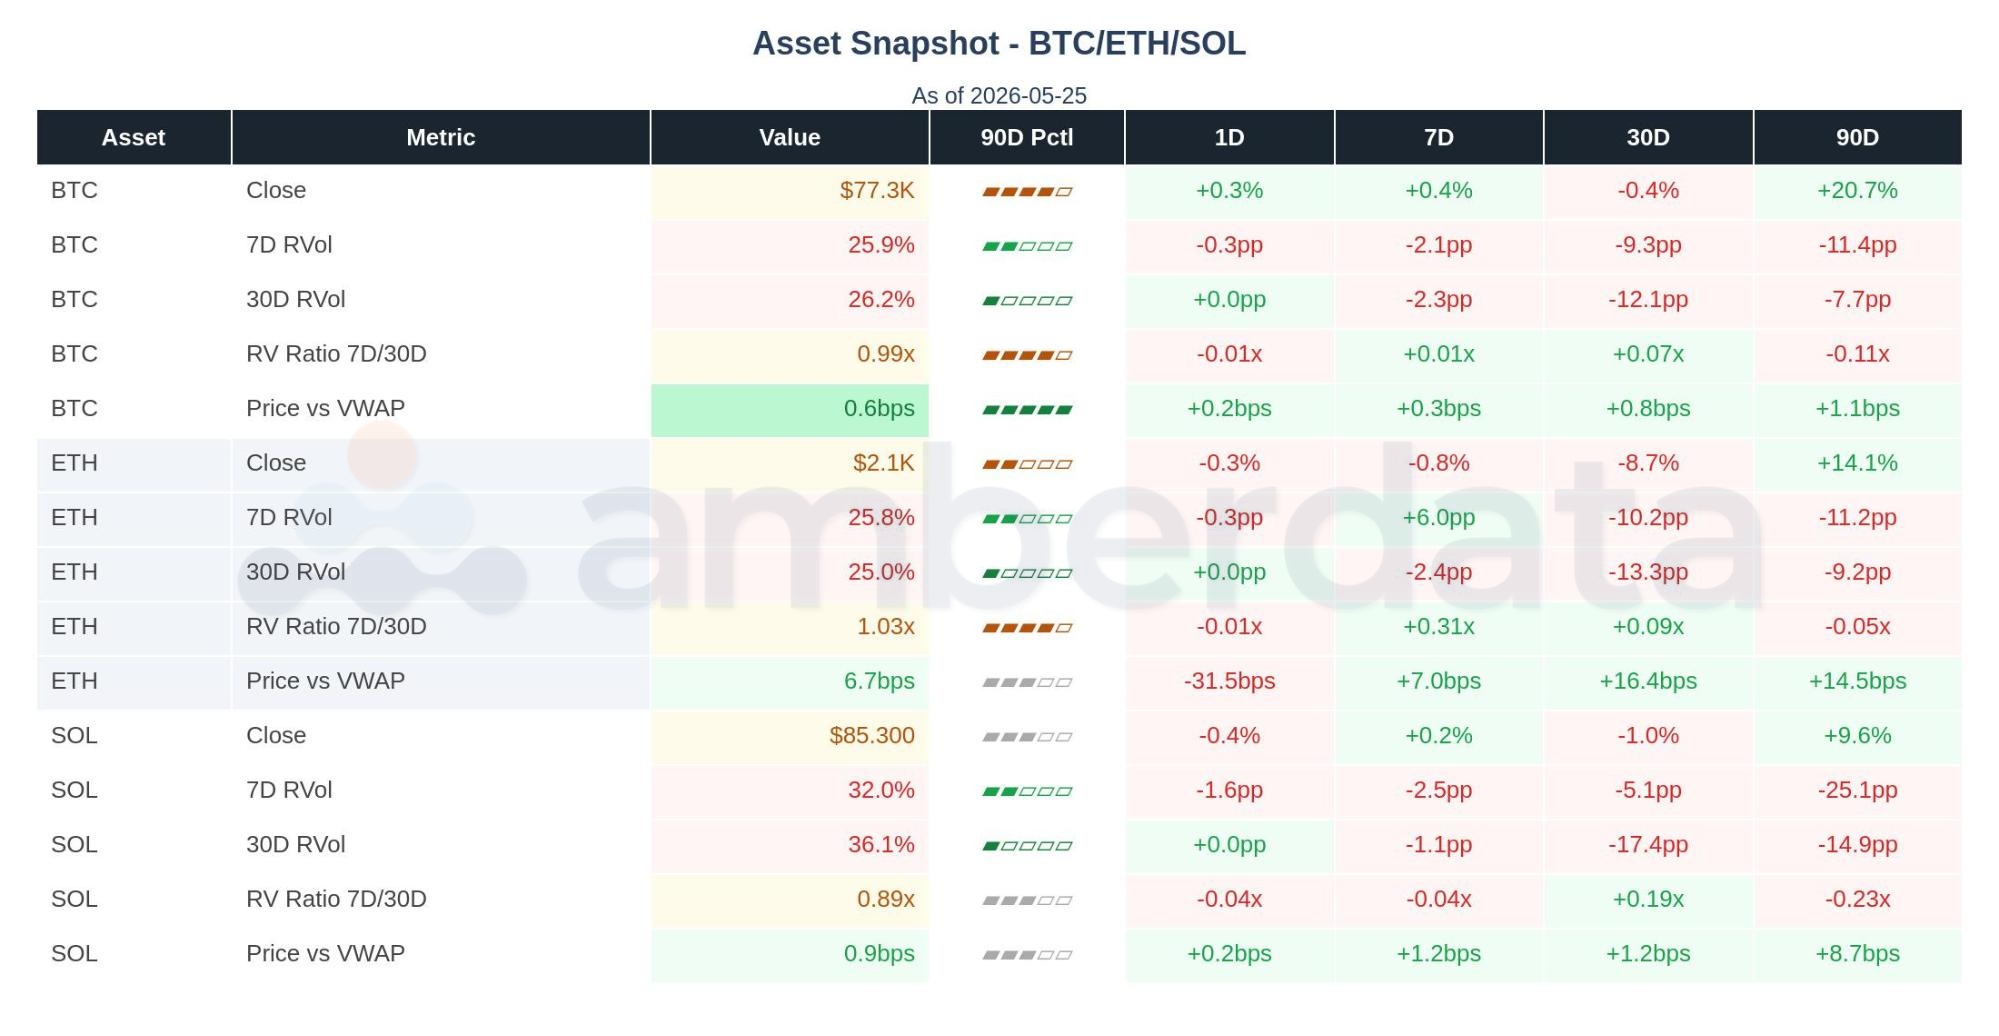
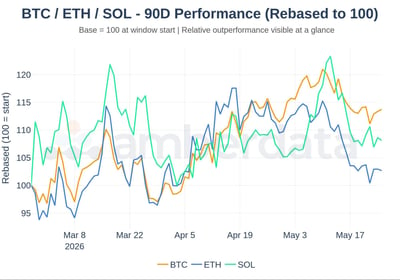
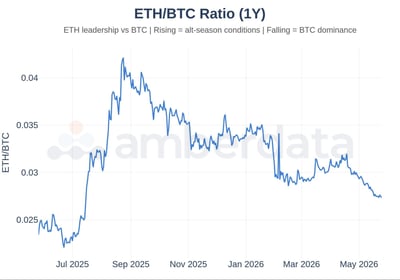
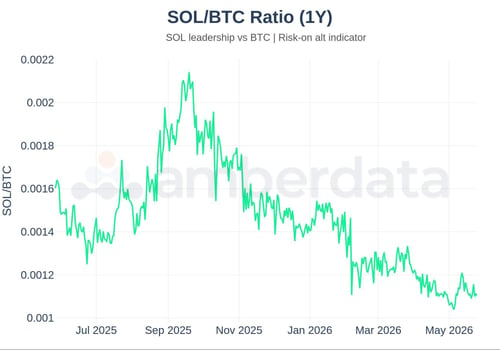
BTC at $77.3K (72nd percentile) was +0.4% on the week with 7D RV at 25.9% and 30D RV at a 90-day low (4th percentile). ETH closed $2,112 (-0.8%, 36th percentile) with 30D RV at the 6th percentile and RV ratio at 1.03x (78th). SOL flat on the week with 30D RV at the 7th percentile. The RV picture is compression that has persisted through the catalyst week.
CHARTS
6. Volatility Regime
|
KEY TAKEAWAYS |
|
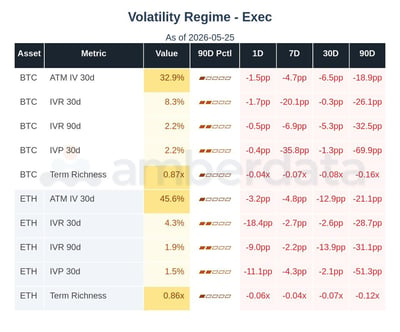
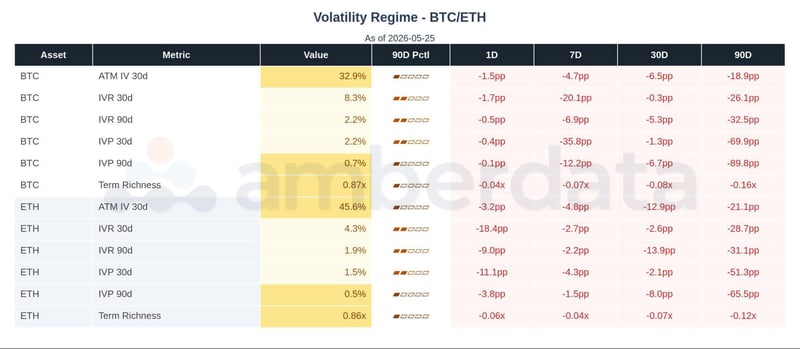
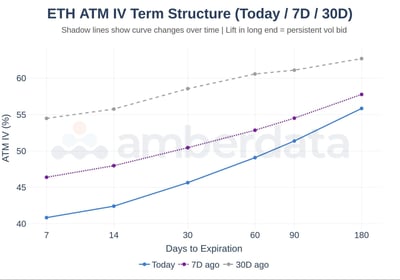
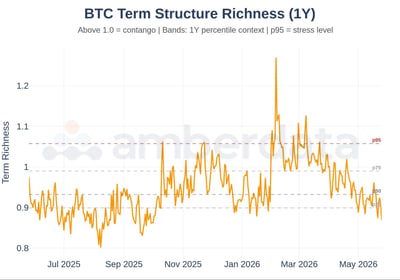
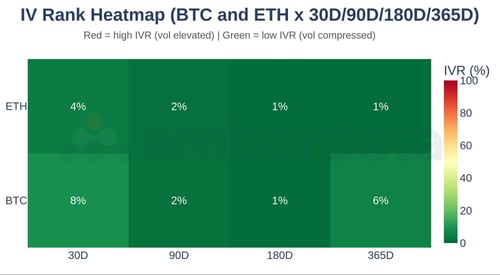
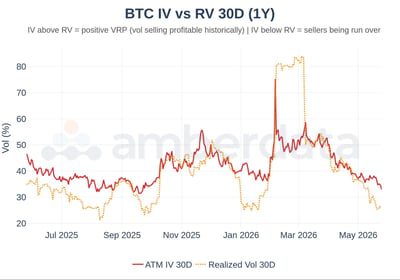
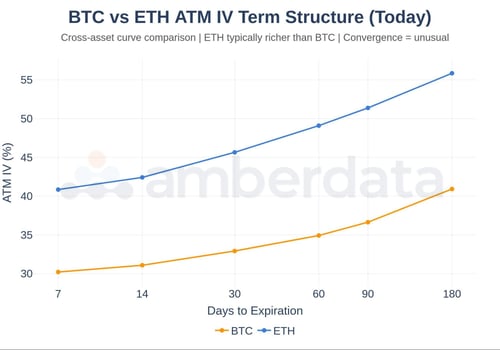
BTC 30D ATM IV at 32.9% (90-day low, 0th percentile) and ETH at 45.7% (also 90-day low, 0th). Both compressed further from last week's already-cheap readings. IV rank on the 90-day window at the 10th and 11th percentiles. Term richness at the 0th and 2nd percentile, both 90-day lows: curve has flattened to the point where the back-end is the relatively rich tenor.
CHARTS
7. Skew and Kurtosis
|
KEY TAKEAWAYS |
|
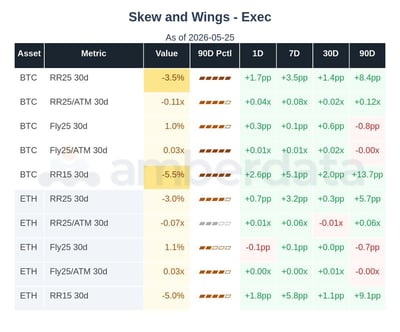
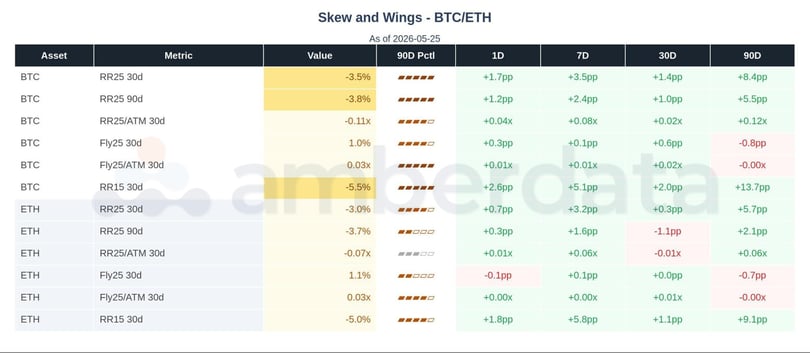
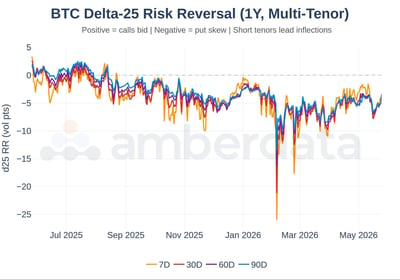
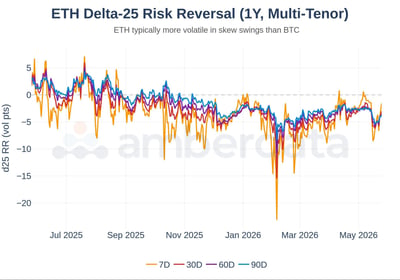
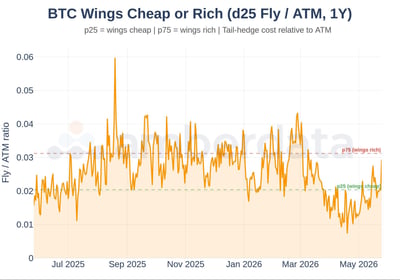
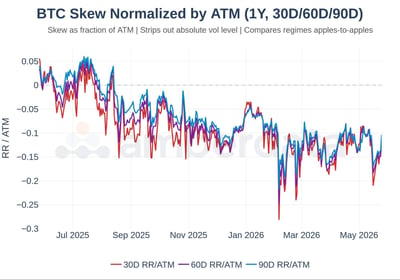
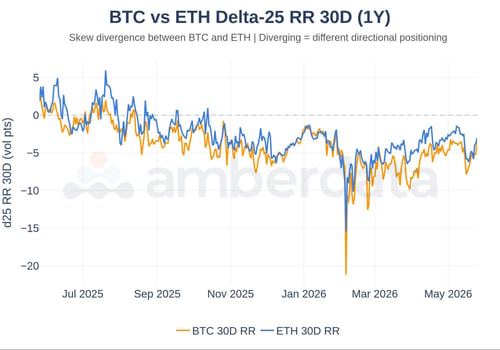
BTC 30D delta-25 RR at -3.5 vol points (98th percentile, up from 34th last week); ETH at -3.0 (74th, up from 11th). RR/ATM at the 82nd and 44th percentiles, a sharp unwind from last week's 7th and 1st. Delta-15 RR also moved to the 97th and 79th percentiles. The put bid that defined last week has lifted dramatically.
CHARTS
8. Realized Vol and VRP
|
KEY TAKEAWAYS |
|
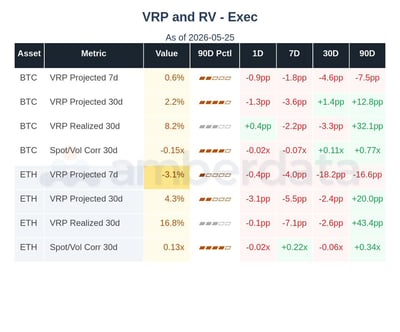
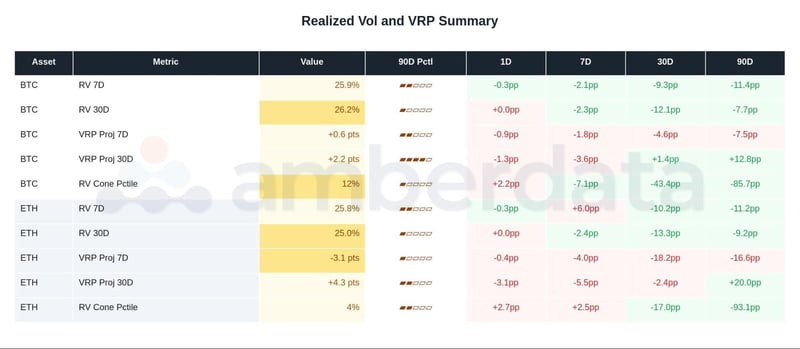
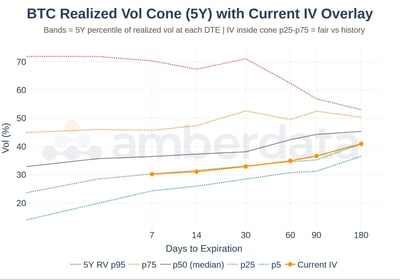
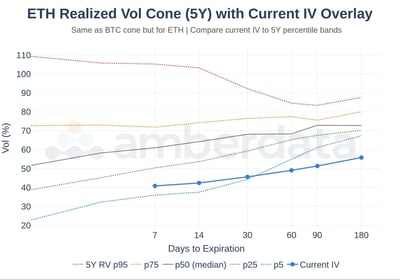
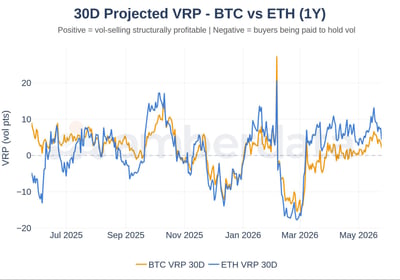
BTC projected 30D VRP compressed to the 75th percentile from 99th last week; ETH from the 94th to the 33rd. ETH 7D VRP at -3.1 vol points (9th percentile, negative): short-vol sellers run over in the front end. RV cone percentiles remain at the floor (BTC 3rd, ETH 12th of 5Y). ETH spot/vol correlation flipped positive at +0.13 (78th): call-driven flow regime.
CHARTS
9. Term Structure and Forward Vol
|
KEY TAKEAWAYS |
|
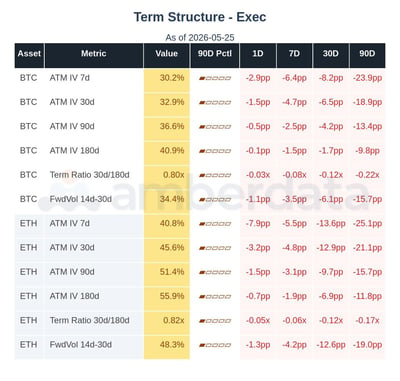
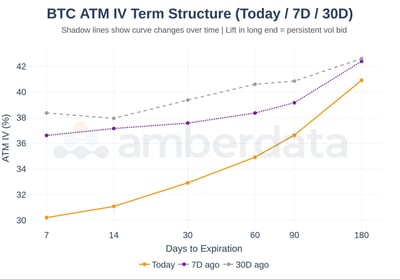
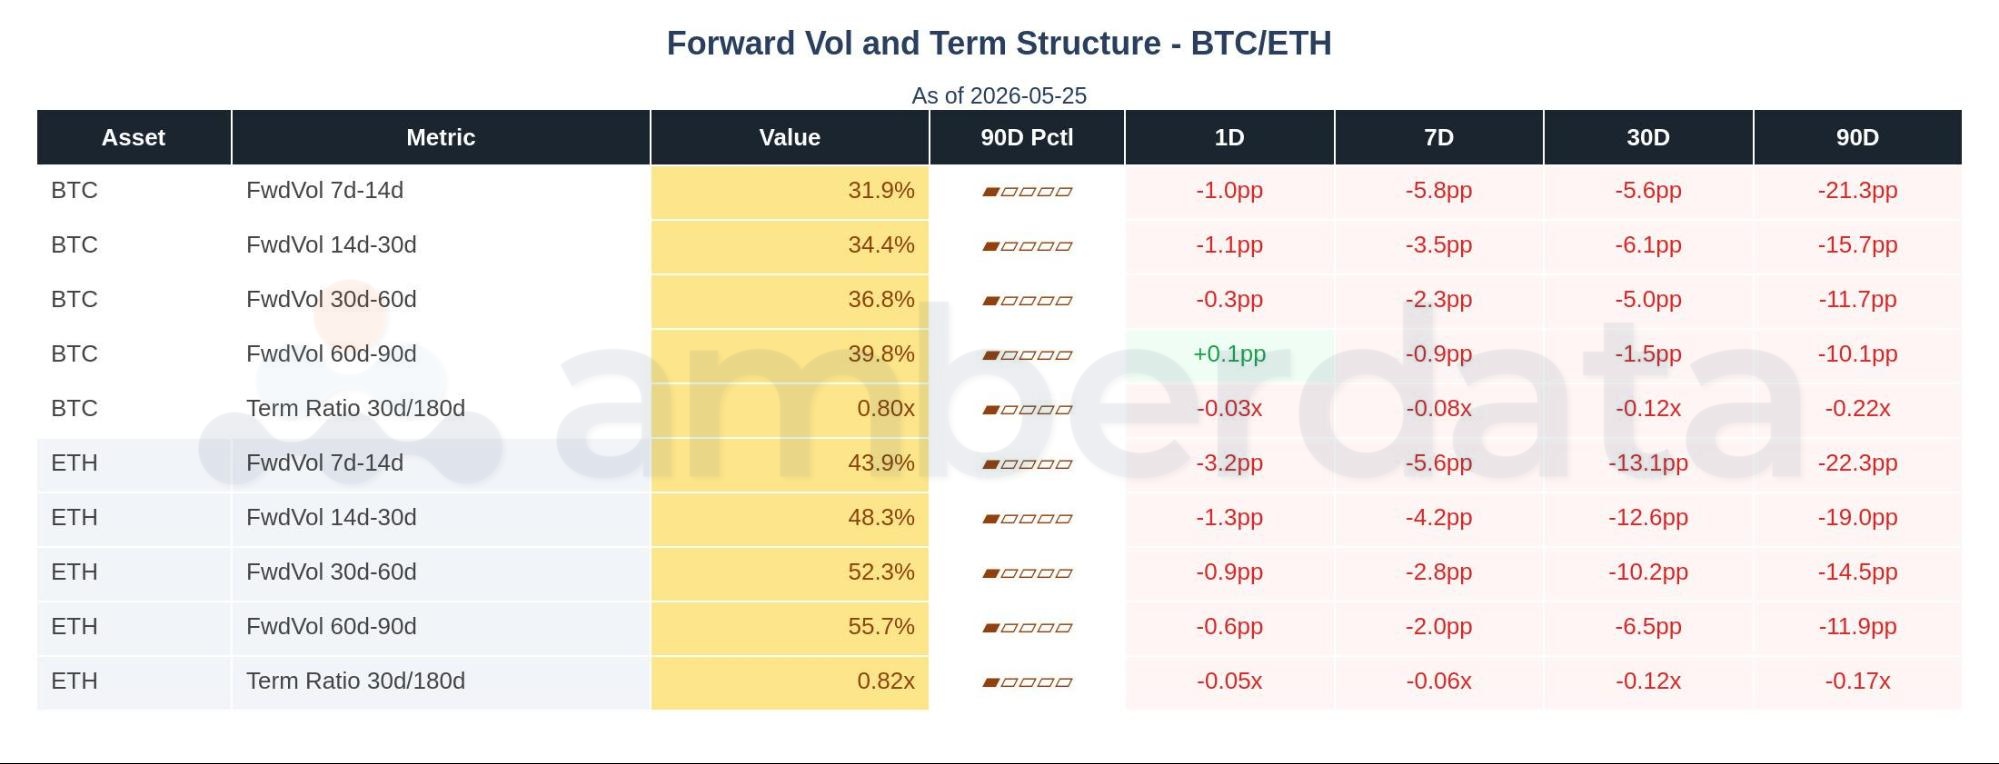
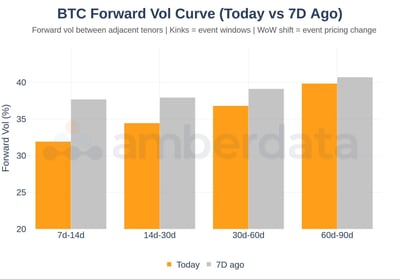
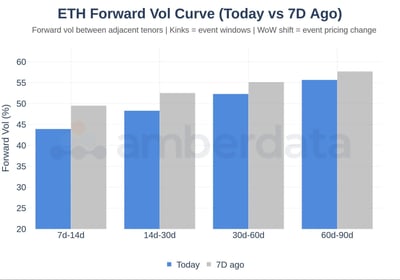
BTC term ratio 30D/180D at 0.80 (0th percentile, 90-day low) and ETH at 0.82 (also 0th). Both reset to the deepest contango of the 90-day window. Forward vol curves are at 90-day lows across every tenor for both assets: BTC 14d-30d at 34.4%, ETH at 48.3%. The curve is pricing no event premium in the front, including for the May 29 monthly expiry and the FOMC-PCE-NFP sequence.
CHARTS
10. Positioning and Basis
|
KEY TAKEAWAYS |
|
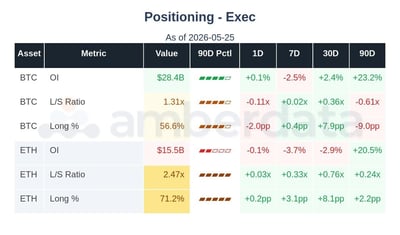
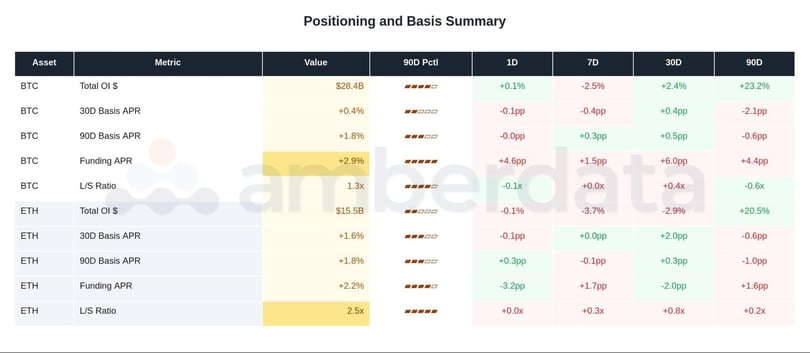
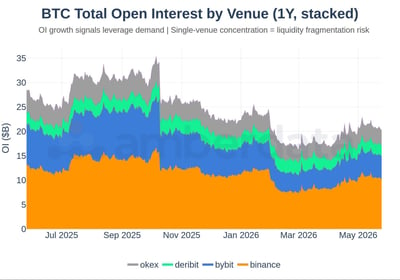
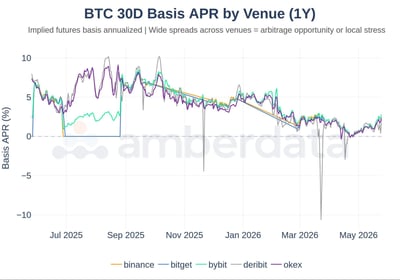
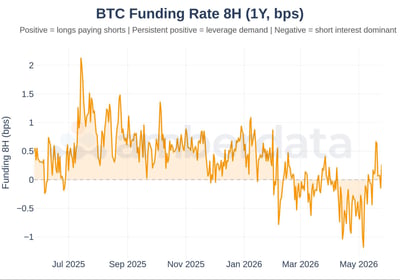
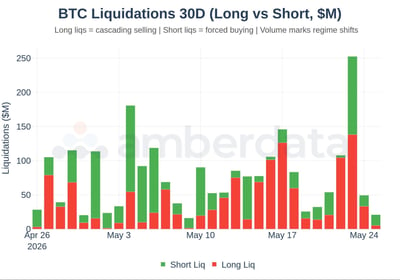
BTC OI at $28.4B (71st percentile) with L/S at 1.31x (62nd) and funding marginally negative: derivative positioning slightly more balanced. ETH OI dropped to $15.5B (38th percentile, from 72nd last week) while L/S extended to 2.47x (98th percentile, 90-day high) and longPct to 71.2% (also 98th). Shorts covered while longs added: net positioning is now extreme. Long liquidations remained dominant on BTC (82nd percentile).
CHARTS
11. Dealer State
|
KEY TAKEAWAYS |
|
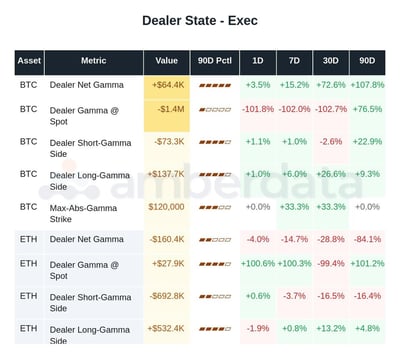
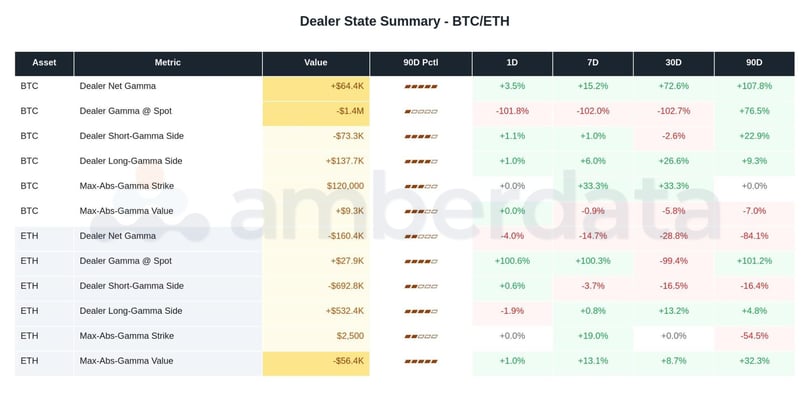
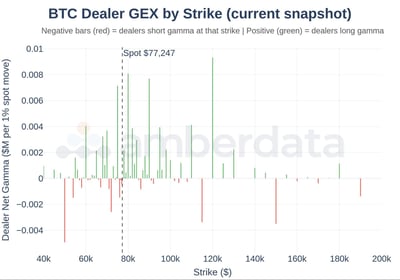
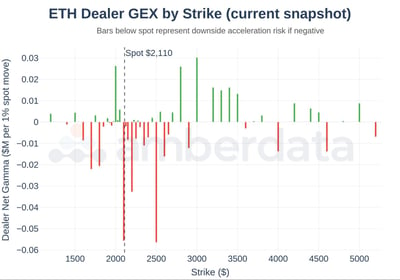
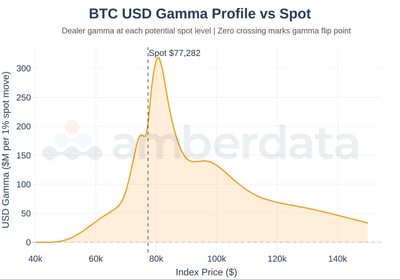
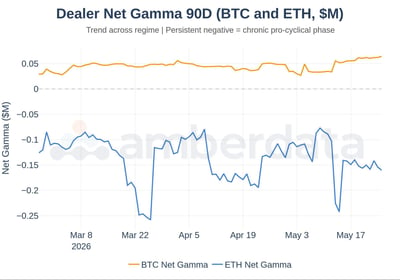
BTC dealer net gamma extended to +$64.4K/% (100th percentile, new 90-day high) but gamma-at-spot flipped negative to -$1.44M (2nd percentile): the book is positive overall but the at-spot zone is short. Small moves around spot amplify; large moves hit the long-gamma walls. Max abs strike moved from $90K to $120K: dealer positioning anticipates the upside. ETH net gamma at -$160K remains pro-cyclical.
CHARTS
12. Flow Analysis
|
KEY TAKEAWAYS |
|
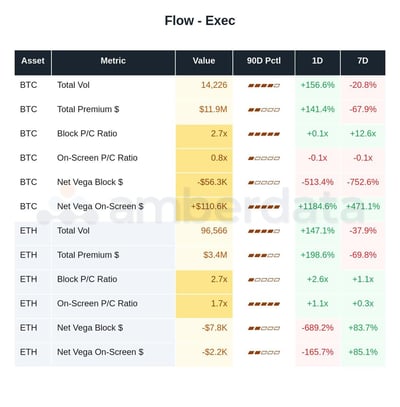
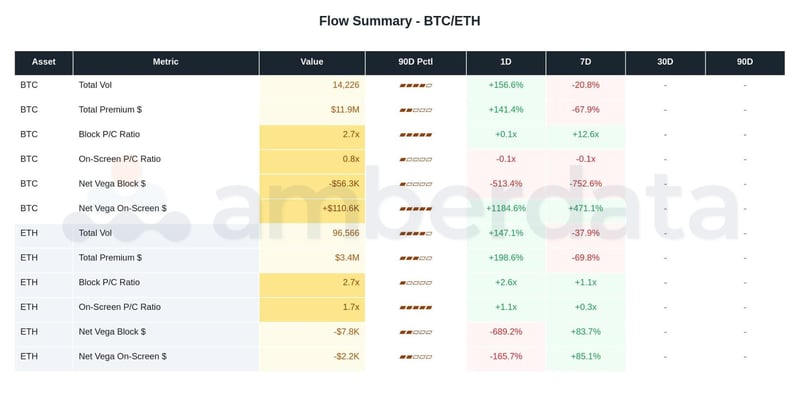
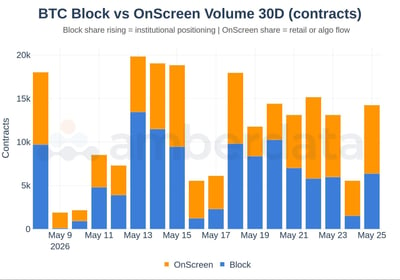
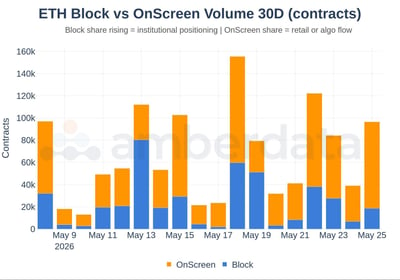
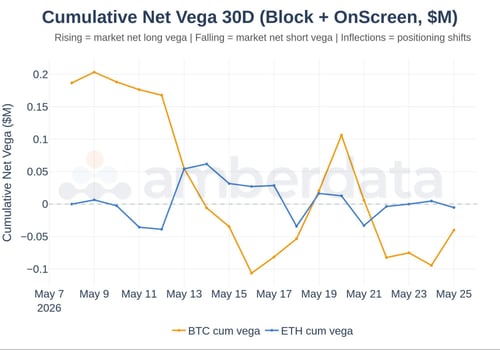
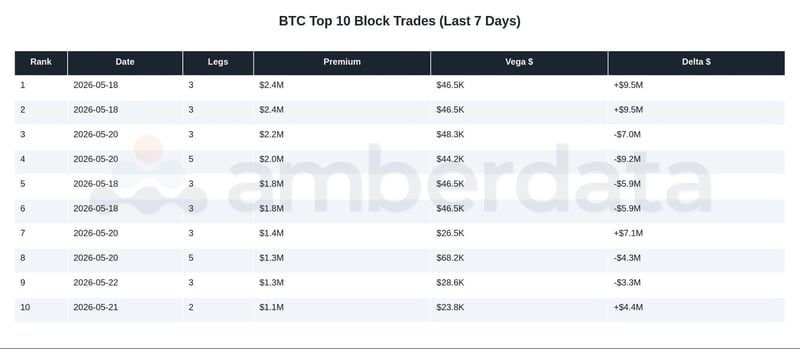
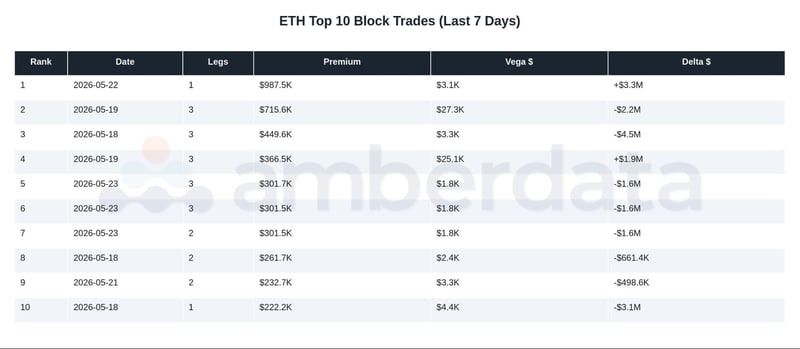
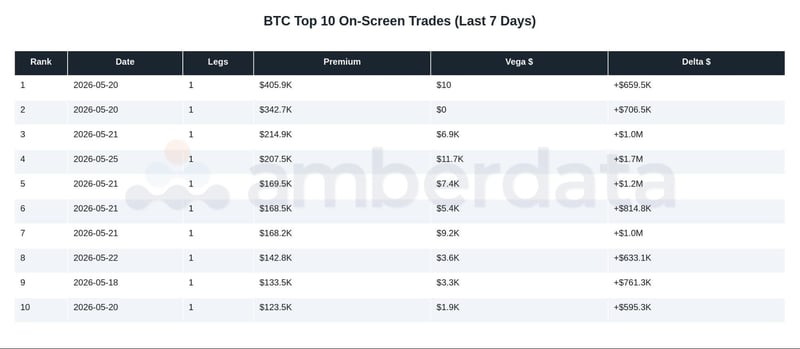
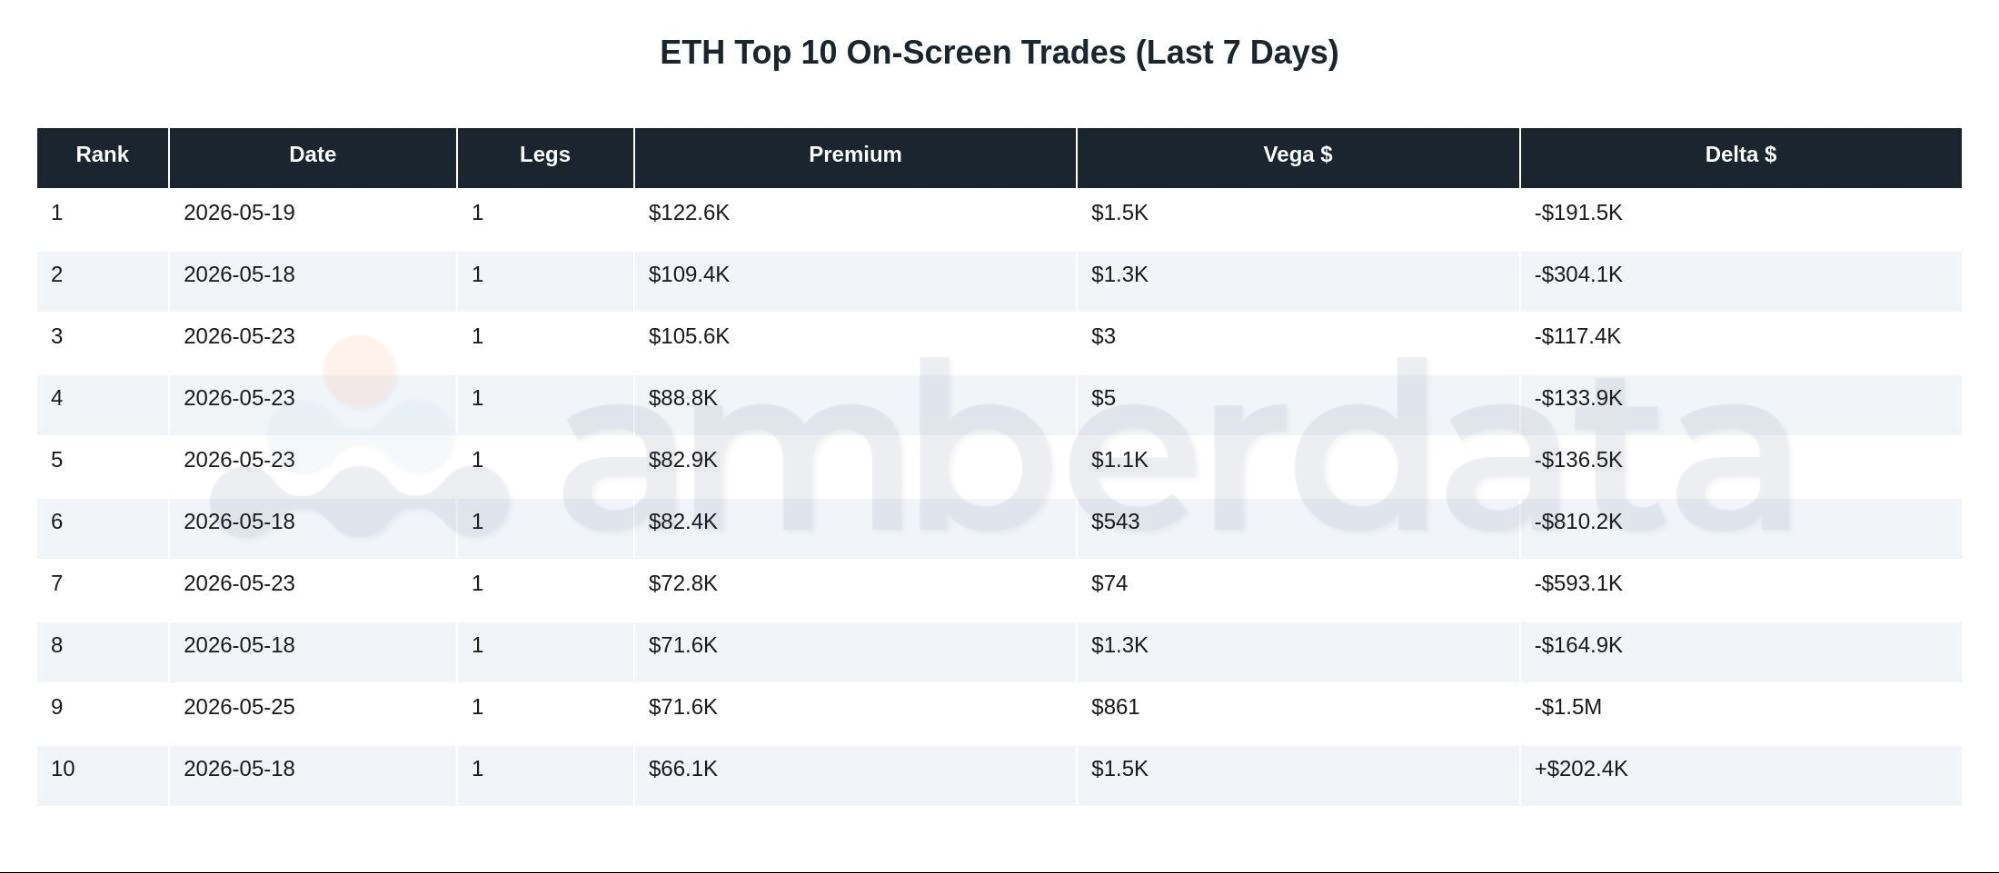
BTC block P/C at 2.68 (90-day high) versus on-screen P/C at 0.78 (90-day low) is the cleanest institutional-retail divergence in the dataset. Block net vega at -$56K against on-screen net vega at +$111K (100th percentile): institutions selling vol, retail buying. ETH block P/C at 2.685 confirms cross-major institutional put-buying. The BTC block-vs-on-screen split is the standout this week.
CHARTS
DETAIL TABLES
13. Cross-Asset Volatility
|
KEY TAKEAWAYS |
|
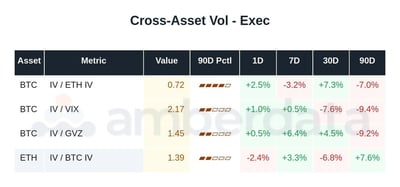
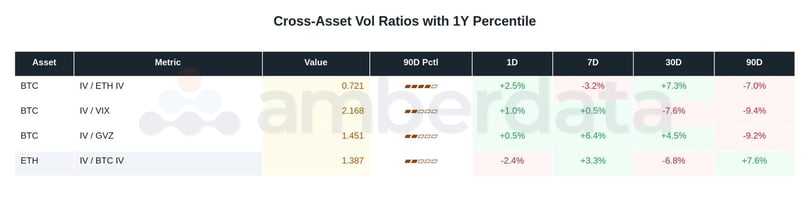
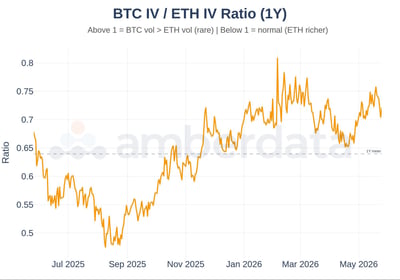
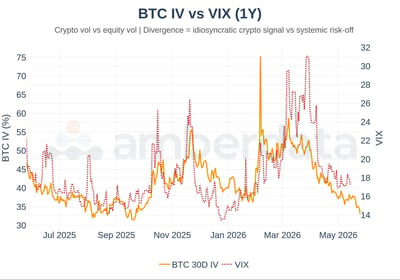
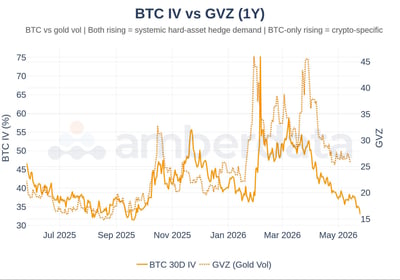
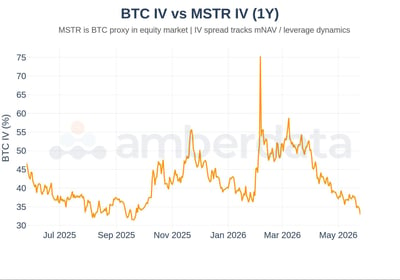
BTC IV at 32.9% against VIX at 17.26 and ETH IV at 45.7%: crypto IV compressing while equity vol is benign. GVZ at 25.79 (92nd percentile) remains the cross-asset standout. The BTC IV / GVZ ratio is at the bottom of its 1Y range. Hard-asset hedging continues in gold; crypto compression and gold expansion run on different drivers.
CHARTS
14. Stablecoin Pulse
|
KEY TAKEAWAYS |
|
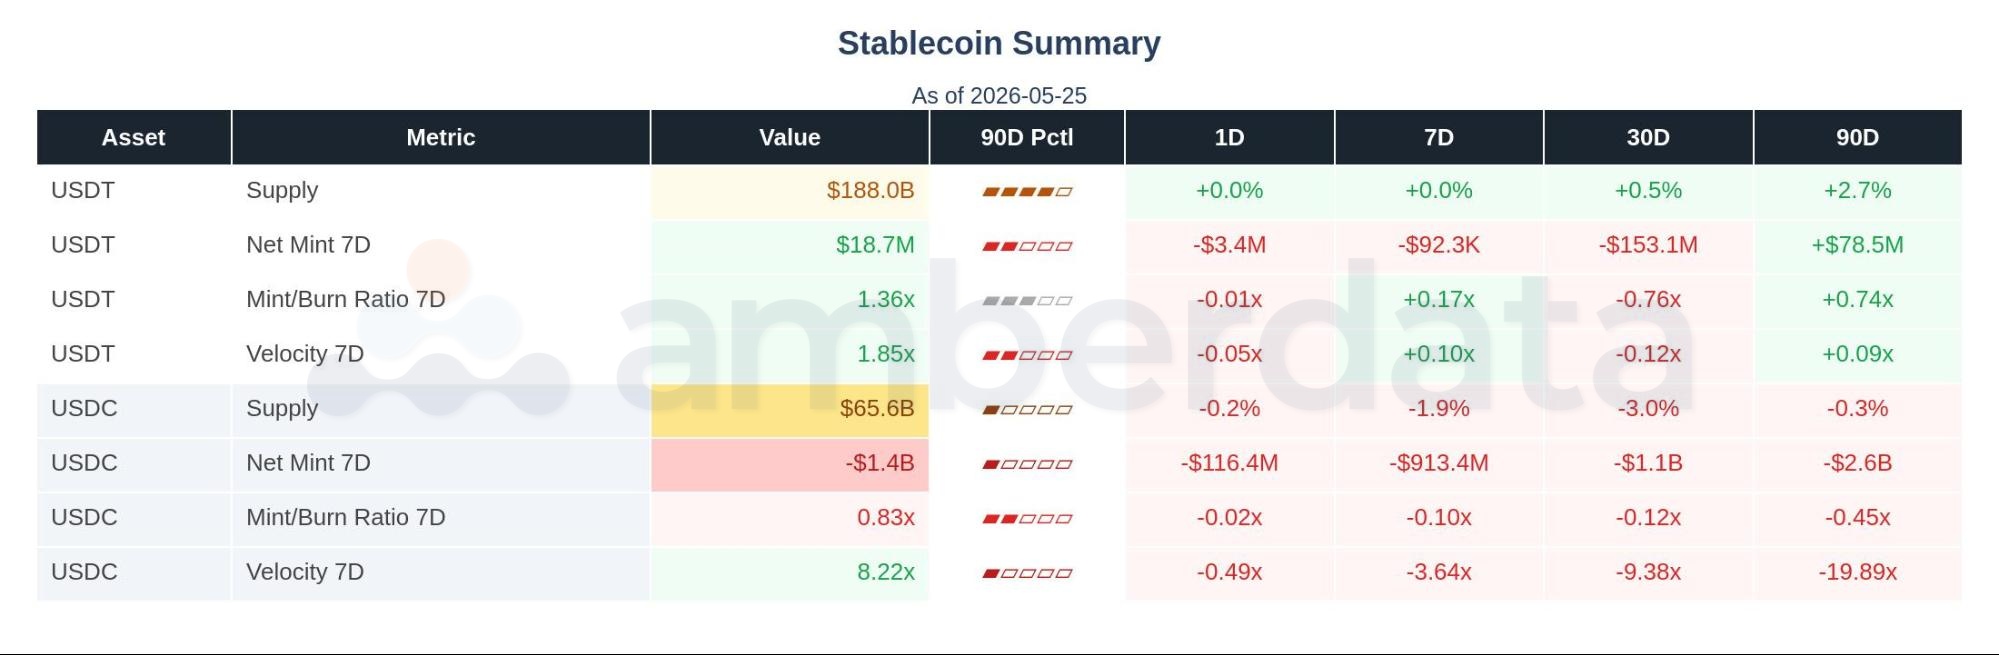
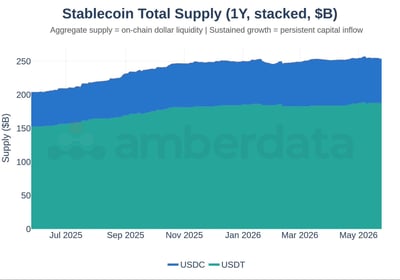
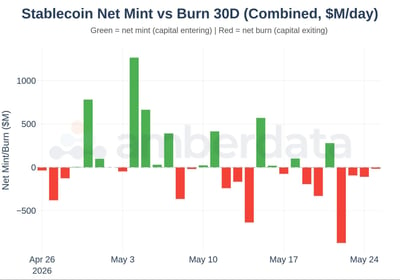
USDC supply now at a 90-day low ($65.6B, 0th percentile) with a fresh -$1.36B 7-day net mint, the deepest contraction in the dataset. USDT supply at $188B (89th percentile, 90-day high) but velocity at 1.85x is still suppressed. The split is broader than last week: US-regulated capital is leaving, while offshore is parked but not deployed.
CHARTS
Methodology
Universe. Options coverage focuses on BTC and ETH on Deribit, the dominant venue for institutional crypto options. Spot and derivatives reference data for the asset snapshot covers BTC, ETH, SOL, XRP, BNB, DOGE, AVAX, LINK, UNI, AAVE and WLFI across Binance, Bybit and OKX. Macro reference series include equity vol indices (VIX, VVIX, GVZ, MOVE), FX (DXY plus USD/JPY, EUR/USD, GBP/USD, USD/CNY), and US Treasury yields at the 2Y, 5Y, 10Y and 30Y tenors sourced from FRED. Stablecoin coverage focuses on USDT and USDC across Ethereum and the major chains.
Implied volatility. ATM IV pulled from Deribit's interpolated surface at 7, 14, 30, 60, 90 and 180-day tenors. IV Rank (IVR) measures the current value within the trailing 1-year [min, max] range, expressed as a percentage; an IVR of 100 means today's IV is at the 1-year high. IV Percentile (IVP) computes the rank of the current value within its trailing 365-day distribution. Both windows are 365 days unless stated otherwise.
Skew and risk reversals. 25-delta and 15-delta risk reversals (RR) are computed as call IV minus put IV at matched deltas across the relevant tenors. RR-to-ATM ratios contextualise wing premium against the at-the-money level. Butterflies (Fly) measure wing convexity as (call IV + put IV) / 2 minus ATM IV. Positive RR indicates calls are bid relative to puts (bullish skew); negative RR indicates put demand (downside hedging or bearish positioning).
Realized vol and VRP. Realized volatility is the annualised standard deviation of daily log returns scaled by sqrt(365). The 7-day and 30-day windows are reported, along with the 7D/30D ratio as a regime indicator. The variance risk premium (VRP) is computed two ways: projected (current IV minus subsequent realized, looking forward at 7-day and 30-day horizons) and realized 30D (trailing IV minus contemporaneous realized). Positive VRP indicates options are richly priced relative to realized; negative VRP indicates options are cheap. The RV cone places current realized vol in its 5-year percentile distribution at each days-to-expiration.
Term structure and forward vol. Term slope between two tenors is the percentage-point difference in their ATM IVs; positive slope indicates contango (front cheap, back rich). Forward vol between tenors T1 and T2 is derived from the variance-additivity identity: sqrt((T2 × IV_T2^2 - T1 × IV_T1^2) / (T2 - T1)). The report computes forward vol across four adjacent pairs (7d/14d, 14d/30d, 30d/60d, 60d/90d) so the expected vol path can be read across the curve. Sharp kinks often correspond to scheduled event windows (FOMC, CPI, expiries).
Positioning and basis. Open interest is sourced from each venue's derivatives feeds, aggregated across perpetuals and dated futures. Funding rate is sampled at the venue's native interval (typically 8 hours) and annualised to a funding APR; positive funding means longs are paying shorts (overlong positioning), negative funding means the reverse. Term basis (7D, 30D, 90D, 180D) is derived from the quarterly futures premium to spot, annualised. Term spread captures the slope across the front-month and back-month basis curves; flattening or inversion typically signals deleveraging or stress.
Dealer gamma. Dealer net gamma estimates the market maker's aggregate gamma exposure inferred from open interest and the assumed direction of client flow (block trades treated as primarily client-buy, on-screen flow probabilistically attributed). Positive dealer gamma implies dealers hedge counter-cyclically (selling rallies, buying dips), which dampens realized volatility. Negative gamma is pro-cyclical and amplifies moves. Gamma is reported in USD per 1% spot move. The report surfaces five metrics per asset: dealer net gamma total, gamma at spot, gamma at the max-absolute-value strike (the strike with the largest hedging requirement), and the long-side vs short-side split of dealer net gamma.
Options flow attribution. Trades are classified as block (negotiated, off-screen) or onScreen (executed on the order book). Buy/sell direction comes from the exchange's amberdataDirection field. Per-trade greeks (delta, vega, gamma) are aggregated to net positioning, with vega expressed as USD per 1% IV move and gamma as USD per 1% spot move. Put/Call ratios are computed by contract count, separately for block and on-screen, since the two channels reflect different participant types (institutional vs retail-leaning). Cumulative net vega and net gamma over 7-day and 30-day windows track the running positioning impulse.
Top trades. Top block and on-screen trades are ranked by USD premium paid per (date, asset, tradeType), showing the largest 10 of each channel over the trailing 7 days. Number of legs identifies single-leg vs structured trades; structures with 3 or more legs typically express vol or term-structure views rather than directional. Premium, Vega and Delta are shown for each trade in USD-equivalent units.
Cross-asset volatility. Crypto IVs are compared against equity vol (VIX), gold vol (GVZ), rates vol (MOVE), and vol-of-vol (VVIX). Ratios such as BTC IV / VIX or BTC IV / GVZ are tracked to identify relative pricing dislocations; when crypto vol is rich versus equity vol on a historical basis, it may indicate a regime change driven by crypto-specific factors rather than cross-asset spillover. BTC IV is scaled by 100 in these ratios so units are comparable to VIX/GVZ index levels.
Stablecoin pulse. Stablecoin supply, daily net mint/burn, and velocity are sourced from on-chain transfer data for USDT and USDC. The mint/burn ratio (7-day) measures expansion vs contraction; values above 1 indicate net minting (supply expanding), below 1 indicate net burning (supply contracting). Stablecoin supply trends serve as a leading indicator for risk-asset inflows since dollar-pegged supply must expand for new spot demand to be funded.
Macro reference and calendar. Equity volatility (VIX, VVIX), commodity vol (GVZ), rates vol (MOVE), US Treasury yields at 2Y/5Y/10Y/30Y, DXY and major FX pairs (USD/JPY, EUR/USD, GBP/USD, USD/CNY) sourced from end-of-day market-data feeds. The forward calendar (FOMC, CPI, payrolls, ECB meetings, token unlocks) is curated manually each week, with event-day windows highlighted in the report to provide context on positioning ahead of releases.
Polarity and percentile colouring. Every metric in the report carries a polarity flag describing whether higher values are positive, negative or neutral for the asset or market. Cells are coloured by combining polarity with the metric's 90-day percentile rank: bullish-polarity metrics tint green near the recent high and red near the recent low, bearish-polarity metrics invert the mapping, and neutral metrics tint amber throughout (deeper at the high and low extremes of the distribution). Shade intensity (light versus dark) scales with proximity to the distribution edge.
Refresh cadence. Reports build T+1 from end-of-day data. Options surfaces refresh daily; macro feeds refresh on their native cadence (intraday or daily). Source freshness is verified at build time and sections drawing on delayed upstream data carry an explicit "As of [date]" label in the panel title.
Full-Market Research. Institutional Depth. Derivatives, ETFs, on-chain, DEXs, microstructure, risk signals - and more. Subscribe at the bottom of our page for research that covers every corner of crypto and visit Amberdata Research.
Access Amberdata Intelligence for institutional-grade digital asset intelligence, or contact our team to discuss custom solutions.
Links & Resources
Platform
Recommended next reads
ETF Cost Basis Series
- Part 1/3: The $80,000 Floor (ETF Cost Basis)
- Part 2/3: Who Breaks First (ETF Cost Basis)
- Part 3/3: The Stress Test (ETF Cost Basis)
More key reads
- Amberdata Crypto Market Review 2025 and 2026 Outlook: Six Regimes, One Story
- Bitcoin's Great Rotation: Who Bought the Dip and Why It Matters
- Beyond the Spread: Market Impact and Execution
Disclaimers
The information contained in this report is provided by Amberdata solely for educational and informational purposes. The contents of this report should not be construed as financial, investment, legal, tax, or any other form of professional advice. Amberdata does not provide personalized recommendations; any opinions or suggestions expressed in this report are for general informational purposes only.
Although Amberdata has made every effort to ensure the accuracy and completeness of the information provided, it cannot be held responsible for any errors, omissions, inaccuracies, or outdated information. Market conditions, regulations, and laws are subject to change, and readers should perform their own research and consult with a qualified professional before making any financial decisions or taking any actions based on the information provided in this report.
Past performance is not indicative of future results, and any investments discussed or mentioned in this report may not be suitable for all individuals or circumstances. Investing involves risks, and the value of investments can go up or down. Amberdata disclaims any liability for any loss or damage that may arise from the use of, or reliance on, the information contained in this report.
By accessing and using the information provided in this report, you agree to indemnify and hold harmless Amberdata, its affiliates, and their respective officers, directors, employees, and agents from and against any and all claims, losses, liabilities, damages, or expenses (including reasonable attorney's fees) arising from your use of or reliance on the information contained herein.
Copyright © 2026 Amberdata. All rights reserved.