Share this blog:
.png)
Why VVIX, MOVE, and the Rates Curve Matter More for Next Week's BTC IV Than BTC Itself
|
KEY TAKEAWAYS |
|
• Vol moves together. Equity and crypto vol regimes correlate at roughly 70% on direction over rolling 30-day windows. The mechanism is positioning rotation and dollar funding liquidity. Treating crypto vol as an isolated process leaves real information on the table. • VVIX leads, not VIX. The vol-of-vol index VVIX has a stronger leading relationship with next-week BTC IV than VIX itself. Fewer than 5% of crypto desks track it. The information is in the public market; the read is rare. • Institutional adoption tightened cross-asset coupling. Spot ETFs and corporate balance sheet allocation have structurally lowered crypto's absolute vol-of-vol versus its 2018-2022 baseline. The same forces tightened its correlation with traditional risk-asset vol regimes. Macro context matters more now, not less. • Scheduled vol events systematically disappoint. The PoS Merge, Shanghai upgrade, BTC Spot ETF approval, and the most recent Halving all underperformed the realized move that the options surface priced in. Buying vol into known events is structurally a losing trade. Selling vol into them is structurally a winning trade. This is the single most reliable pattern in crypto vol. |
This is the first piece in The Vol Stack, a 10-part series unpacking how to read crypto options markets layer by layer. Each piece anchors to live data from the Amberdata Options & Macro Weekly Report and Amberdata Intelligence
BTC's 30-day implied volatility rank jumped 18 percentage points in a single session this week, while spot moved less than 1%. Over the same five-day window, VIX printed up 3.5% and MOVE was up 16% on 90D. Three different markets that most observers would call uncorrelated moved together. The job of an options analyst is to see why that is not an accident.
The opening paradox.
The three observations above sit in different asset classes, follow different mechanics, and trade on different venues. VIX prices S&P 500 index options. MOVE prices US Treasury options. BTC IV prices Deribit options, traded by a participant mix that is roughly 60% retail and 40% institutional. The instruments are unrelated. The participants overlap only at the edges.
And yet they moved together this week. They moved together in March. They moved together on October 14, when crypto IV expanded 22 percentage points in 48 hours while VIX gained 9 vol points on the same window. The pattern is not a curiosity. It is the structural fact that organizes the rest of this post.
Vol is a global variable, not an asset-specific one. When the macro vol regime shifts, every leveraged risk asset gets re-priced together. The mechanism is not narrative coordination. It is forced behavior driven by two structural channels: how global allocators rotate capital between risk-on and risk-off baskets, and how dollar funding liquidity propagates through every leveraged market that depends on it. Spot prices in different markets can decouple. Vol regimes rarely do.
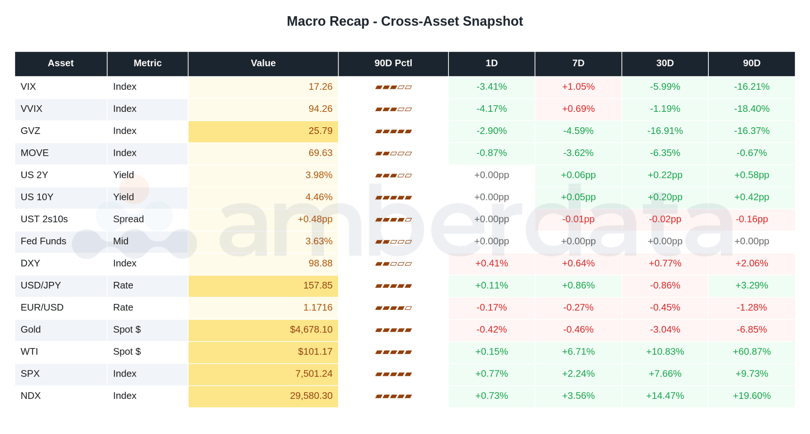
Figure 1.1: Cross-Asset Vol Snapshot. Note how VIX, MOVE, VVIX, and crypto IV cluster in the same percentile band of their respective 90-day ranges. When the four major vol indices align in regime, the read is more reliable than any single number.
Why vol is global.
Two mechanisms drive vol-regime coincidence across asset classes. Both are structural, both are mechanical, and both have held across decades of market data.
Mechanism one: positioning rotation. Global allocators manage risk in baskets. Multi-asset desks at Bridgewater, AQR, Brevan Howard, Millennium, and Citadel allocate to dozens of markets simultaneously. When the macro signal shifts, those desks rotate exposure across the same trades on the same day. Crypto sits inside the risk-asset bucket whether crypto-native readers want it to or not.
Mechanism two: dollar funding liquidity. Every leveraged market depends on dollar funding. When funding tightens, positions face higher carry costs and lower limits. Forced unwinds propagate across markets that share prime brokerage and collateral infrastructure. Crypto perpetuals, equity vol, rates vol, FX carry all sit downstream of the same dollar plumbing.
There is a third dynamic worth naming. Spot ETFs, corporate balance sheet allocation, and listed-equity proxies like MSTR have structurally lowered crypto's absolute vol-of-vol versus its 2018-2022 baseline. The same forces have tightened its correlation with traditional risk-asset vol regimes. The volatility paradox of institutional adoption: crypto became less crazy on its own terms while becoming more synchronized with everything else. Macro context matters more for crypto vol now than three years ago, not less.
The result is a hit rate around 70% on direction over rolling 30-day windows between major equity and crypto vol indices. Not a number to trade off mechanically, but high enough to reshape how you read crypto vol in isolation. If you watch only BTC IV, you are watching a process whose direction is being set 70% of the time by something you are not looking at.
Crypto is the highest-beta participant in the global vol cycle. That is why it leads on some inflections and lags on others.
The five macro vol variables.
The cross-asset map most relevant for crypto options readers reduces to five variables. None is exotic. Each can be pulled from a Bloomberg terminal, TradingView dashboard, or Refinitiv feed in under five minutes. The discipline is watching all five together, not just one.
5
The number of macro vol variables that explain most of the variance in crypto vol regime. Watching one or two misses the regime. Watching all five takes ten minutes a day and changes what you see in BTC IV.
VIX. The headline equity vol index. 30-day implied vol on S&P 500 options. The master gauge of risk-asset vol. The value is less in its level than in its rate of change relative to the other four variables.
VVIX. Vol of vol. The implied vol of VIX itself. VVIX leads VIX on regime inflections because options on VIX re-price faster than the underlying. For crypto, the practical observation is that VVIX has a stronger leading relationship with next-week BTC IV than VIX does directly. The single best predictor of where BTC IV is heading is not BTC. It is the second derivative of equity vol.
MOVE. The implied vol of US Treasury options. Rates vol leads risk-asset vol on cycle inflections because rates re-price before risk assets do. When MOVE rises while VIX is still flat, the rates market is telling you the regime is shifting before the equity market has admitted it.
DXY. The dollar index. Inverse correlation with risk-asset vol most of the time. When the dollar strengthens, dollar-funded leverage gets squeezed and risk-asset vol expands. For crypto specifically, DXY strength has historically correlated with funding rate compression in BTC perpetuals.
GVZ. Gold's volatility index. The cross-vol partner that competes with BTC for alternative-store allocation. When GVZ rises and BTC IV stays flat, gold is doing the regime-change work for the alternative-store bucket. When GVZ rises while BTC IV falls, BTC vol is being suppressed by some crypto-specific dynamic, typically structural call selling.
The single best predictor of next week's BTC implied volatility is not BTC. It is VVIX. The volatility of equity volatility.
SO WHAT?
Most crypto-native desks watch BTC vol, BTC funding, and BTC OI. They are missing the upstream variables that explain regime change before it shows up in BTC. Adding VIX, VVIX, MOVE, DXY, and GVZ to the dashboard takes ten minutes. The information value is asymmetric: when these five align in regime, the read on crypto vol is durable. When they disagree, BTC IV is probably a noisy signal that will revert toward the cross-asset consensus within two weeks.
The rates layer and the JGB canary.
The yield curve is the most underrated vol regime indicator in the toolkit. Term premium re-rating drives vol expansion across asset classes, and term premium re-rating shows up in curve shape before it shows up in vol indices.
When the curve steepens (10-year rising faster than 2-year), the market is pricing higher future inflation, higher real rates, or both. That re-rating propagates to equity vol, credit vol, and crypto vol through the leveraged-positioning channel. Flattening coincides with compression. Curve dis-inversions have marked the regime change that precedes vol expansion in risk assets by four to twelve weeks in every cycle since the 1990s.
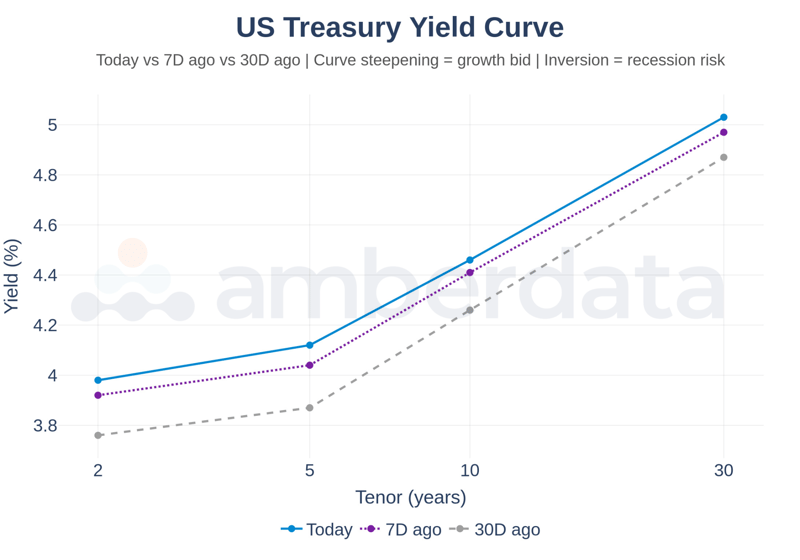
Figure 1.2: US Treasury Yield Curve. Read the 2s10s spread first. Watch for the slope, not the level. Steepening from inversion has historically marked the regime change that precedes vol expansion in risk assets by four to twelve weeks.
There is a global version of this signal worth tracking. JGBs (Japanese Government Bonds) are typically the first market to break in the fiat debasement chain. When the Bank of Japan delivered a surprise hike on August 5, 2024, JGB yields jumped, VIX spiked to 30, VVIX hit 160, and BTC fell with the risk-asset complex despite the move having nothing to do with crypto fundamentals. The lesson is that the JGB market is often the first leverage signal in the global vol chain. When it moves on a surprise BoJ decision or unexpected curve steepening, the rest follows within hours, not days. Gold and silver vol expansion is the corollary: when GVZ rises alongside long-end yields, the market is pricing fiat debasement, and BTC vol typically follows within two to four weeks.
For crypto, the rates layer matters because the cost of leverage in futures and perps is tied to dollar funding rates. When the short end of the curve moves, basis APR and funding move with it within days. The crypto leverage cycle is downstream of the rates cycle, which is why Post 7 (Positioning, Basis, and the Leverage Engine) leans heavily on this context.
The release calendar.
If macro vol is a global regime, the release calendar is the schedule on which the regime is updated. CPI, PCE, NFP, FOMC account for most of the binary-event vol pricing in the options surface. Each is a discrete information drop at a known timestamp. The forward vol curve prices the event premium directly, with event-spanning tenors trading richer than non-spanning tenors.
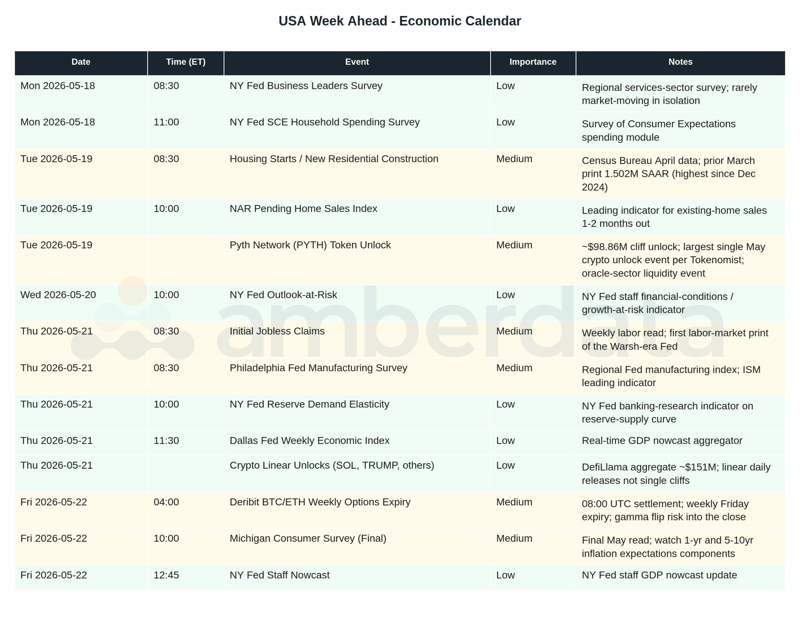
Figure 1.3: Economic Releases This Week. Each line is a potential vol-pricing event. Surprise direction matters more than print magnitude for the vol surface.
CPI. Headline inflation. BLS, monthly, 8:30 ET. Moves the rates curve immediately and the equity surface within the hour. Surprises versus consensus matter more than absolute levels.
PCE. Fed's preferred inflation measure. BEA, monthly, 8:30 ET. Lower headline impact than CPI, higher signal value for Fed policy expectations.
NFP. Non-farm payrolls. BLS, first Friday of each month. The August 2025 print is instructive: jobs came in at +22k versus +75k consensus, with the June print revised negative. The number was modest. The surprise relative to consensus was the larger story for the vol surface.
FOMC. Eight scheduled meetings per year. Decision at 14:00 ET, press conference at 14:30. The highest-impact event in the macro vol calendar. CME FedWatch gives the consensus probability of each move; the deviation between meeting outcome and FedWatch probability at print time is the vol-pricing surprise.
There is an underappreciated pattern in how the market processes crypto-native scheduled events. The PoS Merge, the Shanghai upgrade, the BTC Spot ETF approval, and the most recent Halving all underperformed the realized move that the options surface priced in. Buying vol into known events is structurally a losing trade. Selling vol into them is structurally a winning trade. The same dynamic exists in macro events to a lesser degree, but in crypto-native events the pattern is overwhelming. The takeaway is not to ignore the calendar; it is to recognize that the event premium itself is a fade more often than not.
70%
Hit rate at which equity and crypto vol regimes move in the same direction over rolling 30-day windows. High enough to demand cross-asset reading. Low enough that crypto-specific drivers still matter.
Reading the matrix today.
Where does the macro vol matrix sit this week?
Equity vol. VIX elevated in absolute terms but compressed relative to recent rallies in VVIX. The vol-of-vol move is the meaningful one. Equity vol traders are paying up for protection on the protection, which historically precedes broader vol expansion by one to three weeks.
Rates vol. MOVE up 16% on 90D, concentrated in the front of the curve. The 2-year vol component has expanded more than the 10-year, pointing to short-end Fed policy uncertainty as the driver. CME FedWatch is pricing roughly even odds on a cut versus a hold at the next FOMC, the kind of binary outcome that bids front-end rates vol.
Gold vol. GVZ creeping higher alongside gold. The alternative-store bucket is being re-priced, and BTC vol is lagging. The lag suggests crypto-specific factors are suppressing BTC IV relative to where the cross-asset map says it should sit.
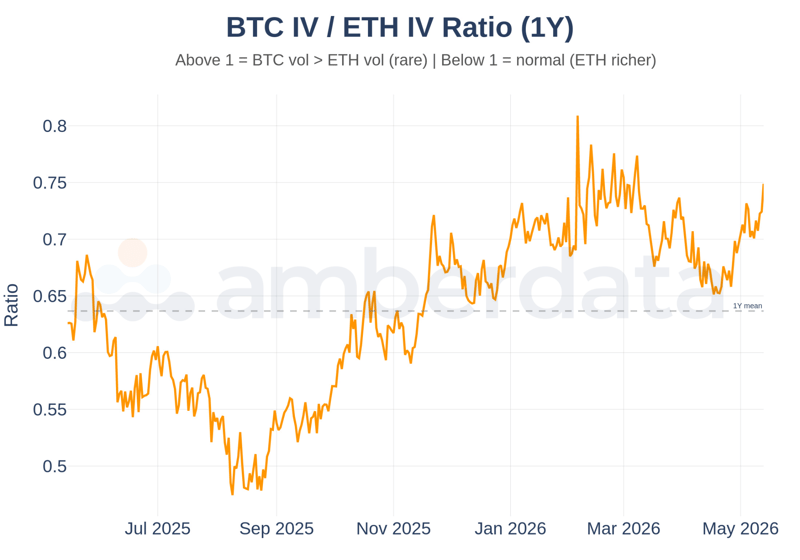
Figure 1.4: BTC IV / ETH IV Ratio. ETH carries a structural vol premium so the ratio sits below 1 most of the time. Spikes toward 1 mark BTC-specific stress or ETH complacency, and a sustained move higher leads the next shift in cross-crypto vol leadership by one to two weeks.
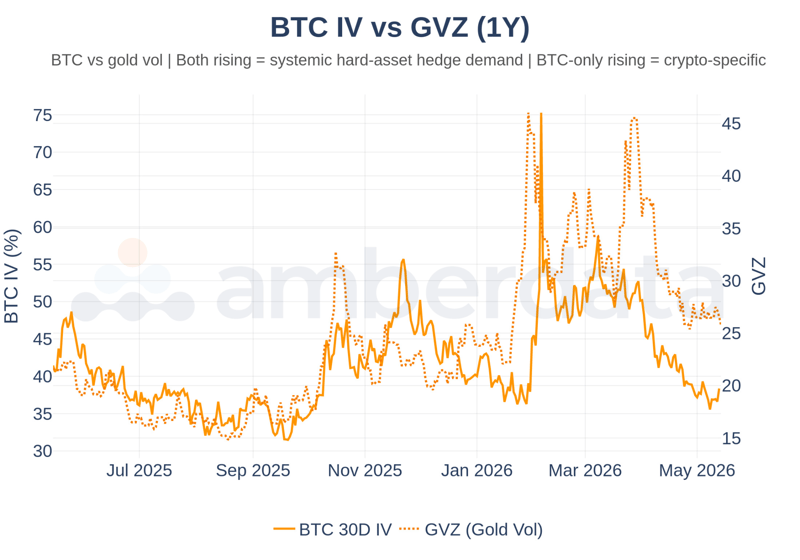
Figure 1.5: BTC IV vs GVZ. Both indices rising together signals systemic hard-asset hedge demand and BTC vol belongs in the rotation. When GVZ rises while BTC IV lags, crypto-specific factors are suppressing BTC vol relative to where the cross-asset map says it should sit.
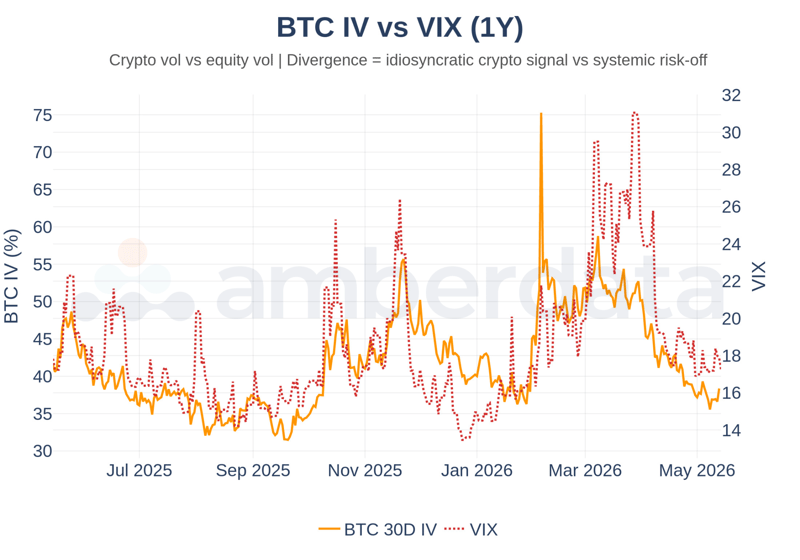
Figure 1.6: BTC IV vs Cross-Asset Vol. When VIX, and BTC IV move in the same direction over a five-session window, the regime is coordinated. When they diverge, the next two weeks tend to resolve in favor of the broader macro signal.
Synthesis. The cross-asset matrix is in a coordinated expansion phase: equity vol-of-vol rising, rates vol elevated, gold vol creeping up. The release calendar is active. Crypto IV has moved this week but remains a lagged response to a macro vol expansion that has been building for four to six weeks. If the 70% direction hit-rate holds, the next two weeks favor continued crypto vol expansion until macro indicators roll over or a release resolves the uncertainty being priced.
What comes next in The Vol Stack.
This was the macro vol regime: the context crypto vol lives inside. The next nine posts work through what crypto vol itself is actually pricing. Post 2 covers spot kinetics and realized volatility. After that, the stack moves through implied vol level (Post 3), the smile and structural skew (Post 4), the variance risk premium (Post 5), term structure (Post 6), the leverage backdrop (Post 7), dealer gamma mechanics (Post 8), institutional flow (Post 9), and the closer on cross-asset vol dislocations and the stablecoin tide (Post 10). By the end of the series, the reader will have a complete framework for reading any options market, anchored in crypto but generalizable to any vol surface.
|
THE BOTTOM LINE |
|
Crypto vol does not move because of crypto. It moves because the global vol regime moves, and crypto is the highest-beta participant in that cycle. Reading the regime requires watching five variables most crypto-focused traders never check: VIX, VVIX, MOVE, DXY, and GVZ. The volatility paradox of institutional adoption is that the same forces that lowered crypto's absolute vol-of-vol have tightened its correlation with traditional risk-asset vol regimes. Macro context matters more now, not less. The 70% hit rate on direction over 30-day windows is not high enough to trade off mechanically, but it is high enough to reshape how every other layer of the vol stack gets interpreted. |

Full-Market Research. Institutional Depth.
Derivatives, ETFs, on-chain, DEXs, microstructure, risk signals, and more. Subscribe at the bottom of our page for research that covers every corner of crypto and visit the Amberdata Research Blog.
Access Amberdata Intelligence for institutional-grade digital asset intelligence, or contact our team to discuss custom solutions.
Links & Resources
Amberdata Research Library
https://www.amberdata.io/research-library
Amberdata Intelligence Platform
https://intelligence.amberdata.com
Amberdata Docs
Contact Us
https://www.amberdata.io/contact-us
Recent from Amberdata
• The Stress Test: ETF Cost Basis Part 3/3
• Who Breaks First: ETF Cost Basis Part 2/3
• The $80,000 Floor: ETF Cost Basis Part 1/3
• Bitcoin's Great Rotation: Who Bought the Dip and Why It Matters
• The Leverage Purge: Why the Market Is Healthier After $8.55B in Pain
• The ETF Exodus Decoded: Basis Arbitrage, Not Capitulation
• Coincidence or Signal? Did WLFI Telegraph Crypto's $6.93B Meltdown
• How $3.21B Vanished in 60 Seconds: October 2025 Crypto Crash Explained Through 7 Charts
• Five Signals of FOMC Impact: How Interest Rate Decisions Reshape Crypto Market Microstructure
• Beyond the Spread: Understanding Market Impact and Execution
Disclaimers
The information contained in this report is provided by Amberdata solely for educational and informational purposes. The contents of this report should not be construed as financial, investment, legal, tax, or any other form of professional advice. Amberdata does not provide personalized recommendations; any opinions or suggestions expressed in this report are for general informational purposes only.
Although Amberdata has made every effort to ensure the accuracy and completeness of the information provided, it cannot be held responsible for any errors, omissions, inaccuracies, or outdated information. Market conditions, regulations, and laws are subject to change, and readers should perform their own research and consult with a qualified professional before making any financial decisions or taking any actions based on the information provided in this report.
Past performance is not indicative of future results, and any investments discussed or mentioned in this report may not be suitable for all individuals or circumstances. Investing involves risks, and the value of investments can go up or down. Amberdata disclaims any liability for any loss or damage that may arise from the use of, or reliance on, the information contained in this report.
By accessing and using the information provided in this report, you agree to indemnify and hold harmless Amberdata, its affiliates, and their respective officers, directors, employees, and agents from and against any and all claims, losses, liabilities, damages, or expenses (including reasonable attorney's fees) arising from your use of or reliance on the information contained herein.
Copyright © 2026 Amberdata. All rights reserved.