Share this blog:
This is Section 2, excerpted from our Amberdata Crypto Market Review 2025 and 2026 Outlook: Six Regimes, One Story. Our full report spans 14 sections - ETF flows, derivatives, on-chain, liquidity, and our complete 2026 outlook.
A regime-based approach to detecting market stress before it becomes obvious
|
KEY TAKEAWAYS |
|
On October 10, Bitcoin fell 6.84%. Unremarkable by crypto standards. But in the same 48 hours, $15.3 billion in BTC positions were liquidated - the largest forced deleveraging event in crypto history. The price move didn't warn you. The volatility framework did.
This section establishes the analytical framework that explains every major move in 2025: the interaction between volatility regimes, leverage accumulation, and liquidity conditions. Understanding this framework transforms hindsight analysis into forward-looking risk assessment.
The Framework Components. The framework consists of four components: volatility regime identification (what type of market are we in), the Flow-Leverage-Liquidity triangulation (what forces are driving the market), stress indicators (daily range and volume patterns), and leading indicators (funding persistence). Together, these components provide a comprehensive view of market structure that goes beyond price alone.
Volatility Regimes: The Foundation
Regime Indicator, Not Just Risk Measure. Volatility is a regime indicator. Different volatility levels correspond to different market behaviors, positioning patterns, and response characteristics.
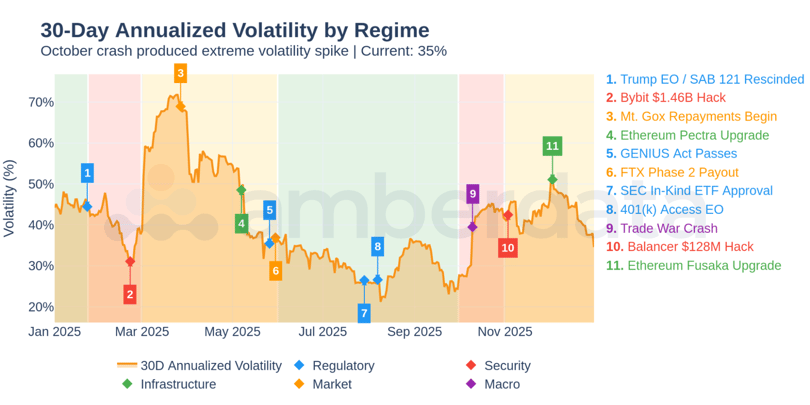
Figure 2.1: Volatility Regime Map - 30-day annualized volatility by regime. Note R4's 30% (lowest) immediately before October's cascade. Low volatility often precedes high volatility events.
Volatility by Regime. 30-day annualized volatility across 2025's six regimes:
R1 Policy Euphoria: 45%
R2 Security Shock: 39%
R3 Infrastructure Build: 54%
R4 Institutional Expansion: 30%
R5 Macro Shock: 39%
R6 Fragile Recovery: 43%
The Counterintuitive Pattern. R3's 54% volatility (highest) occurred during the year's best-performing regime (+21.5% return). R4's 30% volatility (lowest) immediately preceded October's cascade. R5's 39% volatility during the crash was lower than R3's calm accumulation phase.
The Explanation. Volatility measures historical price movement, not future risk. R3's high volatility reflected price discovery during recovery. R4's low volatility masked leverage accumulation. The disparity between realized volatility and structural fragility created the setup for October.
Risk Management Implications. For risk managers, this means volatility-based position sizing is insufficient. Low historical volatility can mask high structural risk. The solution: supplement volatility with leverage metrics (OI relative to depth), flow indicators (ETF/stablecoin trends), and sentiment signals (funding persistence). R4 showed benign volatility but dangerous leverage.
The regime classification provides actionable context. High-volatility regimes (R3: 54%) often accompany healthy price discovery and don't necessarily indicate stress. Low-volatility regimes (R4: 30%) can mask building fragility. The volatility number matters less than the regime context: where are we in the cycle, what's the leverage profile, how is liquidity behaving?
|
SO WHAT? Low volatility is not safety. It often indicates compressed positioning awaiting a catalyst. Monitor leverage accumulation during low-volatility periods - that's when the next crisis builds. |
The October Crash: Anatomy of a Two-Stage Event
Two Phases, One Cascade. October's crash wasn't a single event - it was two distinct phases that fed each other.
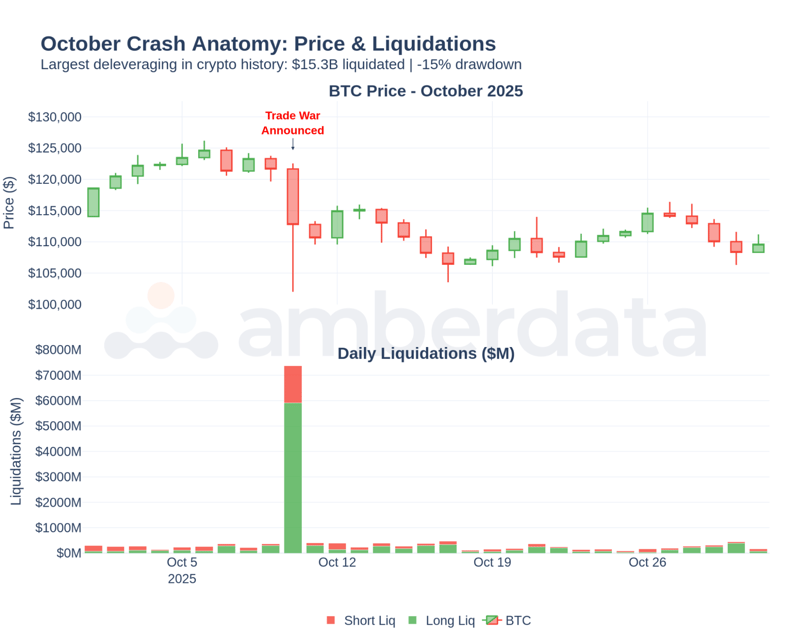
Figure 2.2: October Crash Anatomy - Price action with liquidation overlay. Stage 1 (macro trigger) was orderly. Stage 2 (leverage cascade) was violent. 70% of liquidations were longs.
$15.3B
Total BTC liquidations in October. Long liquidations: $10.7B (70%). Short liquidations: $4.5B (30%). The market was overwhelmingly positioned long.
Stage 1: Macro Trigger (Hours 0-6). October 10, tariff announcement. Risk-off sentiment spread across global markets. Spot selling was orderly - large but not catastrophic. Price declined from $119,000 toward $112,000. This phase looked like a normal market correction.
Stage 2: Leverage Cascade (Hours 6-48). Liquidations triggered liquidations. As prices fell through key levels, margin calls forced position closure. Forced selling pushed prices lower, triggering more liquidations. The feedback loop accelerated. Price fell from $112,000 to a $106,000 trough - the final 5% took 40 minutes.
Risk Management Distinction. The distinction matters for risk management. Stage 1 was survivable with normal hedges. Stage 2 required pre-positioned protection or cash reserves. By the time Stage 2 began, it was too late to react.
The cascade mechanics explain the asymmetric liquidation split: 70% longs versus 30% shorts. The market entered October overwhelmingly positioned long. Carry traders held long spot, short futures. Speculators held leveraged longs. When the cascade began, longs were forced sellers. The concentration of long exposure created the conditions for concentrated long liquidations.
Future Risk Assessment. For future risk assessment: monitor positioning concentration before major events. When one side of the market exceeds 60-65% of open interest, the setup for a violent reversal exists. The trigger is unpredictable; the vulnerability is measurable.
The October Timeline Template. The October timeline provides a template for future cascade analysis:
Hour 0: Macro trigger (tariff announcement)
Hours 0-6: Orderly selling, normal market function
Hours 6-12: Liquidation acceleration begins, basis compresses
Hours 12-48: Full cascade mode, feedback loop active, liquidity evaporates
Hour 48+: Cascade exhaustion, stabilization begins
Understanding this timeline helps distinguish normal corrections from cascade conditions.
Flow-Leverage-Liquidity Triangulation
The Three Dimensions. Every major market move in 2025 can be explained through the interaction of three dimensions: Flows (capital entering or leaving), Leverage (positioning and margin), and Liquidity (market depth and execution quality).
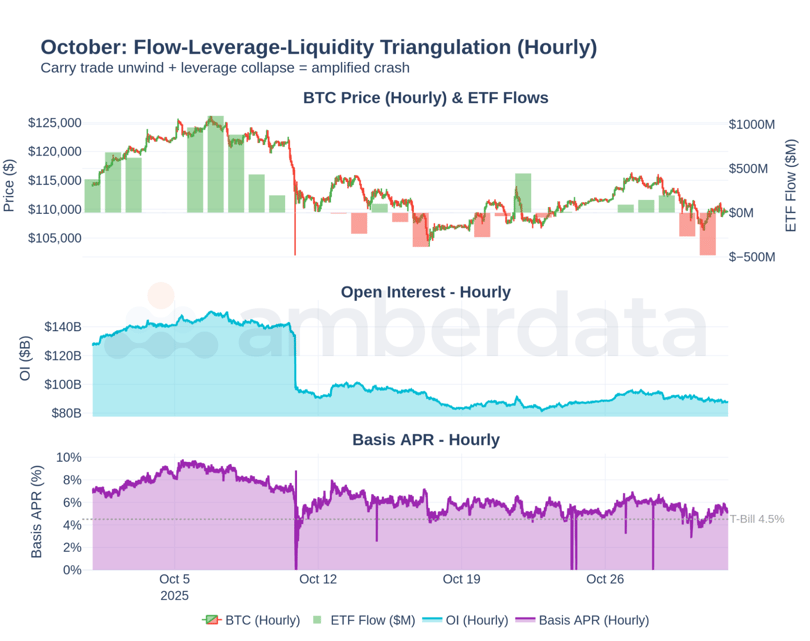
Figure 2.3: Flow-Leverage-Liquidity Triangulation - Three-panel view of October: ETF flows, OI collapse, and basis compression. All three dimensions deteriorated simultaneously.
October Through the FLL Lens. How each dimension behaved during the cascade:
Flows. ETF outflows accelerated as arbitrageurs unwound basis trades. Institutional selling added to retail panic. Capital fled the ecosystem.
Leverage. Open interest collapsed 35% as $15.3B in BTC positions were liquidated. The leverage that took months to build unwound in hours.
Liquidity. Basis compressed from 6.9% to 4.5%. Market makers withdrew depth (40% collapse in 48 hours). Execution quality deteriorated as spreads widened.
October's cascade involved all three dimensions deteriorating simultaneously. Flows triggered leverage unwinds, leverage exhausted liquidity, thin liquidity amplified further selling.
Why October Was Severe. The triangulation reveals why October was so severe: all three dimensions deteriorated simultaneously, each amplifying the others. Outflows triggered liquidations, liquidations exhausted liquidity, thin liquidity caused slippage that triggered more liquidations. The feedback loop was self-reinforcing.
Contrast with R2. In contrast, R2's Bybit shock showed deterioration in only one dimension (leverage via forced Bybit liquidations). Flows and liquidity held relatively stable. The market absorbed the shock within weeks because the feedback loop didn't fully engage. Single-dimension stress is survivable; three-dimension stress is catastrophic.
Practical Application. For practical application: track all three FLL dimensions simultaneously. When any single dimension shows stress, increase attention. When two dimensions deteriorate together, raise hedges. When all three begin simultaneous deterioration, assume the worst case and act immediately.
The FLL framework also works in reverse for identifying accumulation opportunities. When all three dimensions improve simultaneously (inflows building, leverage reasonable, liquidity deepening), conditions favor accumulation. R3 showed this pattern: steady ETF inflows, moderate funding, and improving depth supported +21.5% returns.
Daily Range and Volume: Stress Detection
Real-Time Stress Indicator. Daily range (high minus low divided by close) combined with volume provides a real-time stress indicator. High range plus high volume indicates capitulation or major repositioning.
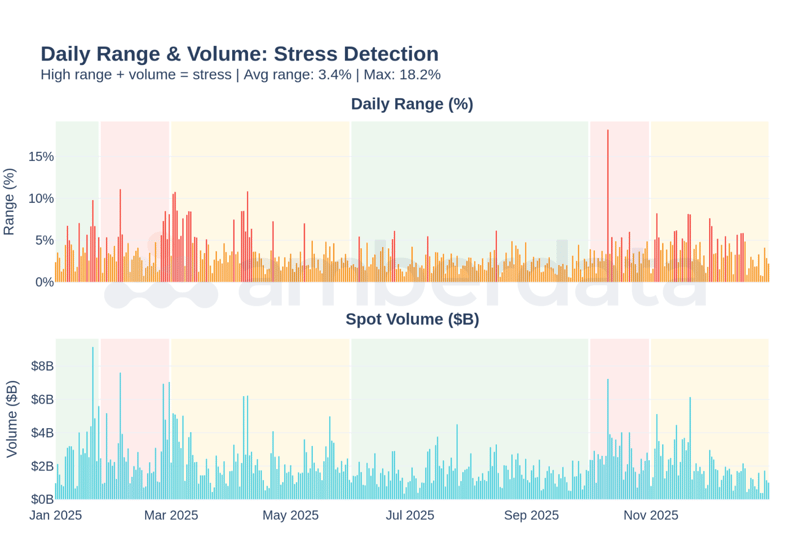
Figure 2.4: Daily Range & Volume - Daily range percentage and spot volume by regime. October's extreme ranges coincided with record volumes - the signature of capitulation.
Range by Regime. Average daily range across 2025's regimes:
R1: 4.2%
R2: 3.9%
R3: 3.8%
R4: 2.4%
R5: 3.8%
R6: 3.8%
R4's 2.4% average range (lowest) reflected the calm before October. When range spikes above 5% with elevated volume, stress is present.
The Combination Matters. The combination matters more than either metric alone. High range with low volume suggests thin markets. High volume with low range suggests orderly repositioning. High range with high volume indicates forced selling - the capitulation signature that marked October's bottom.
October's Stress Signature. October's stress signature was unmistakable: range spiked above 8% on multiple days while volume exceeded $50B daily. This combination indicates capitulation - forced selling regardless of price. When you see this pattern, the immediate price direction is typically down, but the medium-term setup often marks a local bottom as forced sellers exhaust.
Practical Filter. Practical application: when daily range exceeds 2x the recent average AND volume exceeds 2x the recent average, stress conditions exist. This simple filter would have flagged October 10-12 as capitulation and suggested caution during the peak stress. It would not have predicted the exact bottom, but it would have identified the capitulation phase.
Funding Rate Persistence: The Leading Indicator
Cost of Leverage. Funding rates reflect the cost of holding leveraged positions. Persistently positive funding (longs pay shorts) indicates crowded long positioning. Extended periods of one-sided funding often precede reversals.
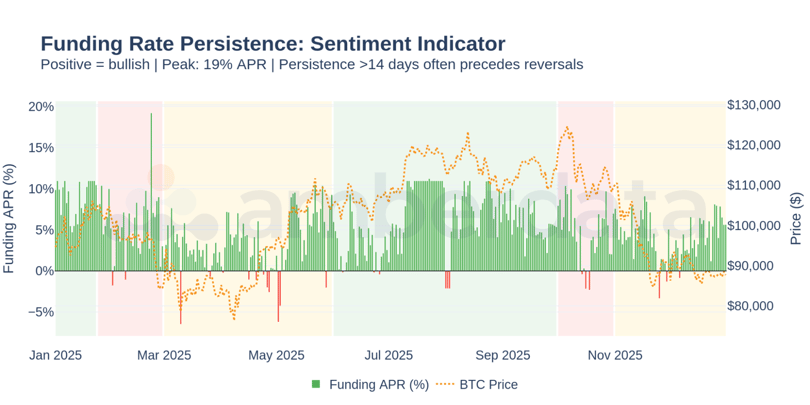
Figure 2.5: Funding Rate Persistence - Annualized funding rate by regime. R1's 8.8% and R4's 6.1% represented crowded long positioning that set up subsequent selloffs.
Funding by Regime. Average annualized funding rate across 2025:
R1: 8.8%
R2: 5.7%
R3: 3.3%
R4: 6.1%
R5: 4.6%
R6: 4.1%
The pattern is informative: elevated funding (R1, R4) preceded the two major selloffs (R2, R5).
The Warning Signal. R4's 6.1% average funding with 14+ consecutive days of positive readings was the clearest warning signal before October. When funding persists positively for extended periods, longs are paying for the privilege of being crowded into the same trade. The eventual unwinding is violent because everyone exits simultaneously.
Bidirectional Indicator. The funding persistence mechanism works both ways. Extended negative funding (shorts paying longs) indicates crowded short positioning, which sets up short squeezes. In 2025, persistent positive funding dominated, reflecting the overall bullish bias that built leverage for October's long liquidation cascade.
Current Conditions. Current R6 funding averaging 4.1% represents normalized conditions - neither extreme bullishness nor bearishness. This balanced funding is actually positive for market stability: it indicates that speculators are not crowded on either side. The absence of funding persistence in R6 reduces cascade risk, even as other fragilities persist.
|
SO WHAT? Monitor funding persistence as a leading indicator. 14+ consecutive days of elevated positive (or negative) funding suggests crowded positioning that will eventually reverse. The longer the persistence, the more violent the eventual unwind. |
The 2025 Events Timeline
Event Categories. Major events clustered into distinct categories, each triggering different market responses.
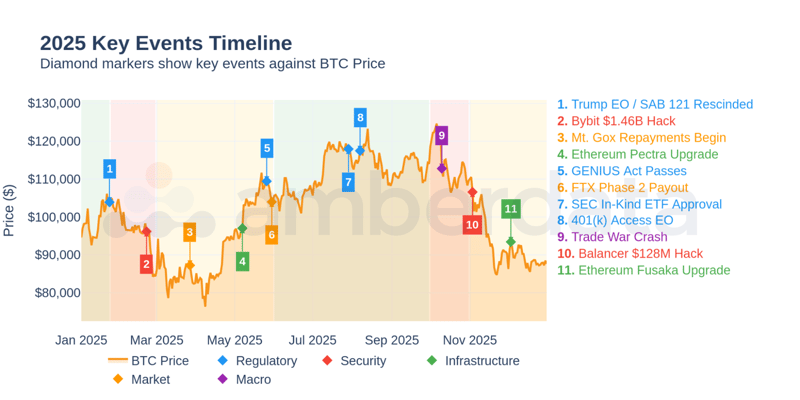
Figure 2.6: 2025 Key Events Timeline - Events mapped to price with category coding. Note the concentration of regulatory events (blue) and the macro event (purple) in October.
Event Distribution. Events by category:
Regulatory: 5 events (Trump EO, SAB 121 rescission, GENIUS Act, in-kind ETF approval, 401(k) access)
Security: 2 events (Bybit $1.46B hack, Balancer $128M hack)
Infrastructure: 2 events (Ethereum Pectra and Fusaka upgrades)
Market: 2 events (Mt. Gox and FTX distributions)
Macro: 1 event (Trade war announcement)
The Year's Pattern. The year was defined by regulatory tailwinds (H1) absorbing security shocks (February) until a single macro trigger (October) overwhelmed the positive momentum. The concentration of regulatory progress in H1 built the leverage that October's macro shock unwound.
Lesson for 2026. The lesson for 2026: regulatory tailwinds create optimism that accumulates leverage. Security shocks test resilience but are typically absorbed. Macro shocks, when they hit accumulated leverage, create cascades. Watch for the combination of positive sentiment, elevated leverage, and potential macro triggers - that's when the framework becomes the most valuable.
Current 2026 Risk Assessment. Current 2026 risk assessment: regulatory tailwind continues (401(k) implementation, potential additional ETF products). Leverage is subdued (R6 conditions). Macro risks remain (trade policy uncertainty, Fed policy, geopolitical). The setup is different from pre-October 2025 - lower leverage means lower cascade risk - but macro triggers could still drive significant moves.
|
THE BOTTOM LINE |
|
The volatility framework transforms hindsight analysis into forward-looking risk assessment. Track volatility regimes (low volatility often precedes high volatility events), apply FLL triangulation (watch for simultaneous deterioration across flows, leverage, and liquidity), and monitor funding persistence (14+ days of one-sided funding precedes reversals). October's crash was detectable through this framework. The same tools apply to 2026. |
Application to 2026. Current conditions (R6 Fragile Recovery): volatility at 43% (elevated but not extreme), funding at 4.1% (balanced, no persistence), leverage subdued (OI 40% below peak), liquidity impaired (depth below pre-crash). The framework suggests cautious positioning until FLL dimensions improve simultaneously. Watch for: basis recovery above 6%, depth recovery to pre-crash levels, funding stabilization, and consistent ETF inflows.
This framework builds on (S1)'s regime definitions and provides the analytical foundation for understanding how stress conditions evolve. The volatility-leverage-liquidity interaction established here explains why October's cascade was so severe and provides early warning signals for similar events.
From here, (S3) applies this framework to examine each of 2025's six regimes in forensic detail. (S5) uses the FLL triangulation to analyze carry trade mechanics, and (S6) examines how liquidity conditions evolved through each stress event. The cascade dynamics introduced here recur throughout the report.
This article provides the executive summary. The full Amberdata Crypto Market Review 2025 goes deeper:
- The $80,000 floor: What happens when ETF cost basis breaks?
- Which ETF issuer is already underwater? The entity-level breakdown reveals all
- October's "capitulation"? The data says arbitrage - here's the carry trade proof
- 123,173 BTC: The mega whale accumulation hiding in plain sight
- Six regimes, 14 sections: One framework that explains everything
- Early or late cycle? On-chain valuation signals decoded
- $60K or $180K? 2026 scenarios with specific price targets
- DeFi's $2B security crisis: What broke and why it matters
- SAB 121 to 401(k): The regulatory timeline reshaping crypto
- And more...

[DOWNLOAD THE FULL AMBERDATA CRYPTO MARKET REVIEW 2025]
Full-Market Research. Institutional Depth. Derivatives, ETFs, on-chain, DEXs, microstructure, risk signals - and more. Subscribe at the bottom of our page for research that covers every corner of crypto and visit the Amberdata Research Blog.
Access Amberdata Intelligence for institutional-grade digital asset intelligence, or contact our team to discuss custom solutions.
Links & Resources
Platform
Recommended next reads
ETF Cost Basis Series
- Part 1/3: The $80,000 Floor (ETF Cost Basis)
- Part 2/3: Who Breaks First (ETF Cost Basis)
- Part 3/3: The Stress Test (ETF Cost Basis)
More key reads
- The ETF Exodus Decoded: Basis Arbitrage, Not Capitulation
- Bitcoin's Great Rotation: Who Bought the Dip and Why It Matters
- October 2025 Crash (7 charts): How $3.21B Vanished in 60 Seconds
- Beyond the Spread: Market Impact and Execution
Disclaimers
The information contained in this report is provided by Amberdata solely for educational and informational purposes. The contents of this report should not be construed as financial, investment, legal, tax, or any other form of professional advice. Amberdata does not provide personalized recommendations; any opinions or suggestions expressed in this report are for general informational purposes only.
Although Amberdata has made every effort to ensure the accuracy and completeness of the information provided, it cannot be held responsible for any errors, omissions, inaccuracies, or outdated information. Market conditions, regulations, and laws are subject to change, and readers should perform their own research and consult with a qualified professional before making any financial decisions or taking any actions based on the information provided in this report.
Past performance is not indicative of future results, and any investments discussed or mentioned in this report may not be suitable for all individuals or circumstances. Investing involves risks, and the value of investments can go up or down. Amberdata disclaims any liability for any loss or damage that may arise from the use of, or reliance on, the information contained in this report.
By accessing and using the information provided in this report, you agree to indemnify and hold harmless Amberdata, its affiliates, and their respective officers, directors, employees, and agents from and against any and all claims, losses, liabilities, damages, or expenses (including reasonable attorney's fees) arising from your use of or reliance on the information contained herein.
Copyright © 2026 Amberdata. All rights reserved.