Share this blog:

Over 100,000 BTC woke up. Coins dormant for five years or more - last moved when Bitcoin traded below $20,000 - changed hands at $90,000+. Long-term holders who survived multiple cycles, held through 70% drawdowns, and watched their positions grow 10x finally took profits near the top. Find out more in this analysis!
The HODL wave data tells the story. The 5+ year band barely moved - 32.97% to 32.90%, a 7 basis point decline. The action was in younger cohorts: supply held less than 6 months expanded from 27.01% to 29.89%, a 288 basis point increase. Old coins became young coins as long-term holders distributed to new entrants willing to pay six-figure prices.
Balance bucket data reveals who absorbed that supply over the 57-day analysis window:
- Mega Whales (10K+ BTC): +123,173 BTC
- Sharks (100-1K BTC): +26,193 BTC
- Whale (1K-10K BTC): -79,062 BTC
- Fish (10-100 BTC): -30,352 BTC
- Retail (<10 BTC): -15,330 BTC
The largest holders - addresses with 10,000+ BTC - accumulated 123,173 BTC while mid-tier cohorts and retail distributed. Net whale accumulation (1K+ BTC holders combined) reached 44,111 BTC. Peak activity came on November 7 when 91,711 BTC changed hands across whale cohorts.
Textbook cycle rotation. The correction shook out weaker hands, and that supply moved up the wealth ladder into wallets with longer time horizons and deeper pockets. The following sections trace exactly how this transfer unfolded.
The HODL Wave Story
How HODL Waves Work
Bitcoin's transparency enables something impossible in traditional markets: tracking exactly how long every coin has sat dormant.
The mechanism is Bitcoin's UTXO model - Unspent Transaction Outputs. Every Bitcoin exists as a discrete unit with a timestamp recording when it last moved. When coins transfer to a new address, their age resets to zero. When they sit untouched, they age. Aggregate this across all 19.7 million circulating Bitcoin, and you get HODL waves - a real-time distribution showing what percentage of supply has been dormant for various time periods.
The bands stack from youngest to oldest: coins moved within 24 hours, within a week, within a month, and so on up through coins untouched for 5+ years. When the younger bands expand, it means old coins are moving - long-term holders making active decisions after extended dormancy. When older bands grow, it means recent buyers are aging into longer-duration holders, their coins sitting untouched as conviction builds.
The signal is behavioral, not mechanical. Coins dormant for five years represent holders who survived the 2018 crash, the 2020 COVID panic, the 2022 collapse, and every drawdown in between. When these coins move after years of silence, it reveals something about conviction thresholds and profit-taking psychology that no price chart can show.
Importantly, movement doesn't always mean selling. Coins can move between wallets controlled by the same entity - consolidation, security rotation, inheritance planning. But in aggregate, large movements in old cohorts during price peaks correlate reliably with distribution. Holders who waited years for six-figure prices don't move coins for wallet hygiene. They move them to sell.
This is why HODL waves matter for cycle analysis. They reveal who is acting, after how long, and at what prices - the behavioral fingerprint underneath the price action.
-1.png?width=750&height=514&name=Untitled%20design%20(11)-1.png)
HODL waves track the age distribution of Bitcoin supply - how long coins have sat dormant in wallets. When old coins move, they become "young" coins in the hands of new buyers. This age transformation is the on-chain signature of distribution, and the pattern over the past 57 days tells a clear story.
Young Supply Expansion. Supply held less than 6 months expanded from 24.17% to 29.89% - a 571 basis point increase representing roughly 1.1 million BTC changing hands and resetting their age clock. These coins moved from longer-duration holders into the wallets of new entrants willing to pay six-figure prices. Meanwhile, the 5+ year band held steady at 32.9%, actually increasing 26 basis points over the period. The oldest holders largely stayed put.
Mid-Vintage Distribution. The action concentrated in the middle bands:
- 6 months to 2 years: highest turnover, primary source of distribution
- 2-5 years: moderate distribution as mid-cycle buyers took profits
- 5+ years: net accumulation (+0.26%), diamond hands holding firm
This is typical of cycle distribution. Mid-vintage holders who bought during prior accumulation phases at $20,000-$40,000 realized 3-5x gains and rotated out. The deepest conviction holders - those who survived 2018, 2022, and every drawdown in between - remained anchored.
Healthy Context. Distribution happened into strength, at $90,000-$125,000, with willing buyers absorbing supply at elevated prices. Year-to-date, the 5+ year band grew 82 basis points despite the correction. The HODL wave signal reads "STABLE" - old coins holding, young supply expanding through normal market turnover rather than forced liquidation.
The rotation occurred among participants with shorter time horizons, exactly as cycle theory predicts. The question is: who absorbed that supply?
The Wealth Transfer
Reading the Wealth Ladder
Balance buckets segment Bitcoin holders by size, creating a wealth ladder from smallest to largest. Each rung represents different participant types with different behaviors, time horizons, and reactions to volatility.
The bottom rungs - Plankton, Shrimp, and Crab (under 10 BTC) - are predominantly retail. These holders typically buy during excitement and sell during fear. They react to headlines, check prices daily, and have the shortest average holding periods. Their aggregate behavior is a reliable contrary indicator: when retail distributes heavily, bottoms often follow.
Mid-tier holders - Fish (10-100 BTC) and Sharks (100-1K BTC) - represent high-net-worth individuals, small funds, and sophisticated traders. They're more strategic than retail but still sensitive to drawdowns. This cohort often accumulated during prior cycle lows and took profits during corrections, exactly as the data shows.
The top rungs tell a different story. Whales (1K-10K BTC) and Mega Whales (10K+ BTC) include institutions, funds, early adopters, corporate treasuries, and custodial addresses. These entities operate on longer time horizons with lower sensitivity to 30% drawdowns. They have investment committees, multi-year mandates, and the capital to average down. When they accumulate during corrections, it signals conviction from participants who move markets.
The direction of flow matters. Supply moving up the ladder - from retail to whales - indicates rotation into stronger hands. Supply moving down - whales distributing to retail - often precedes major tops. The ladder doesn't predict price, but it reveals the quality of the holder base. Concentrated ownership in patient hands creates stability; dispersed ownership in reactive hands creates fragility.
.png?width=800&height=372&name=Untitled%20design%20(17).png)
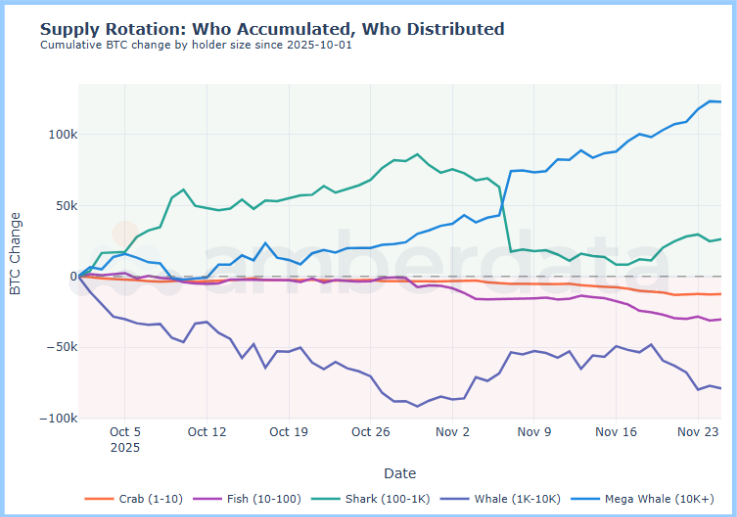
Balance bucket data answers who absorbed the distributed supply. Over the 57-day period, Bitcoin moved systematically from smaller holders to larger ones - a classic wealth transfer pattern.
The Accumulators.
- Mega Whales (10K+ BTC): +123,173 BTC (+4.41%)
- Sharks (100-1K BTC): +26,193 BTC (+0.52%)
The Distributors.
- Whales (1K-10K BTC): -79,062 BTC (-1.84%)
- Fish (10-100 BTC): -30,352 BTC (-0.70%)
- Crab (1-10 BTC): -12,468 BTC (-0.61%)
- Shrimp (0.1-1 BTC): -5,124 BTC (-0.48%)
Net result: addresses holding 1K+ BTC accumulated 44,111 BTC while retail cohorts below 10 BTC distributed 15,330 BTC. Mid-tier holders (10-1K BTC) shed 4,159 BTC. Supply moved up the wealth ladder into wallets with deeper pockets and longer time horizons.
Net Result. Addresses holding 1K+ BTC accumulated 44,111 BTC while retail cohorts below 10 BTC distributed 15,330 BTC. Mid-tier holders (10-1K BTC) shed 4,159 BTC. Supply moved up the wealth ladder into wallets with deeper pockets and longer time horizons.
.png?width=800&height=383&name=Untitled%20design%20(14).png)
Activity Pattern. Whale cohort activity (100-10K BTC holders) totaled 893,621 BTC in gross movement over the period, averaging 15,958 BTC daily. Peak activity hit 91,711 BTC on November 7 - coinciding with price weakness and elevated liquidations. The pattern is telling: whale activity spiked on down days, indicating accumulation into weakness rather than distribution into strength. Smaller holders capitulated into red candles; larger holders absorbed the supply. This divergence between retail behavior and whale behavior is the clearest on-chain signal that the correction represented rotation rather than broad-based selling.
The Mega Whale cohort stands out. A 4.41% increase in holdings during a 30% price correction signals deep-pocketed accumulation at scale. These addresses - likely institutions, funds, or early holders consolidating positions - added over 123,000 BTC while retail and mid-tier participants reduced exposure. The 1K-10K BTC cohort distribution (-79,062 BTC) likely reflects profit-taking from holders who accumulated during earlier cycle phases and saw the correction as an exit opportunity rather than a reason to add.
Textbook cycle behavior. Corrections shake out weaker hands, and that supply transfers to participants with longer time horizons, lower cost basis sensitivity, and higher conviction. The pattern repeats every cycle: retail buys the top and sells the dip; whales accumulate the dip and distribute into the next rally.
This rotation matters for what comes next. Supply concentrated in stronger hands creates a more stable holder base - one less likely to panic at the next 10% drawdown. Whale-dominated markets tend to see shallower corrections and faster recoveries because large holders don't liquidate on sentiment. They accumulate on weakness and wait. The coins found stronger homes, and the on-chain footprint confirms the rotation is largely complete.
Real-Time Trading Behavior
-1.png?width=800&height=434&name=Untitled%20design%20(13)-1.png)
On-chain distribution tells us who holds the coins. Exchange flow data tells us who was actively trading - and in which direction. The picture across both centralized and decentralized venues confirms sustained but orderly selling pressure throughout the correction.
CEX Selling Pressure. Over the 57-day period, centralized exchanges recorded net selling of 137,070 BTC ($14.25B). Total volume reached 5.05 million BTC ($528B), averaging 88,529 BTC ($9.27B) daily. The buy/sell ratio sat at 0.947 - meaning 48.6% of taker volume was buys, 51.4% sells. A modest imbalance, but one that compounded over nearly two months.
The timing pattern reveals the pressure points:
- Days with net buying: 14
- Days with net selling: 43
- Longest buying streak: 2 consecutive days
- Longest selling streak: 11 consecutive days
- Best day: November 5 (+5,466 BTC)
- Worst day: October 11 (-12,580 BTC)
Thursday was consistently the weakest day, averaging -4,398 BTC net flow. Sunday was the only day averaging positive (+723 BTC). Retail tends to capitulate mid-week during business hours; weekends see lighter, more balanced flow. Average trade size of $1,321 suggests predominantly retail activity on CEX - institutional players were accumulating through OTC desks and ETF flows, not exchange order books.
.png?width=800&height=371&name=Untitled%20design%20(18).png)
DEX De-Risking. Decentralized exchange activity confirmed the risk-off tone. Net BTC-to-stablecoin flow hit -$117M over the period, averaging -$2.05M daily with only 26 of 57 days showing net buying.
Key Dates:
- Worst day: October 10 (-$30M) - cascading liquidations triggered panic swaps into stables
- Best day: October 1 (+$27M) - before the correction intensified
ETH faced heavier selling pressure at -$272M net rotation into stables, averaging -$4.78M daily. The ratio matters: ETH sellers outpaced BTC sellers by 2.3x despite ETH's smaller market cap. Risk-off sentiment hit altcoins harder - a pattern consistent with prior corrections where capital flees to perceived safety. The sequence is predictable: first from alts to majors, then from majors to stables, then from stables to fiat off-ramps.
Bitcoin held up better on a relative basis, absorbing less selling pressure per dollar of market cap than Ethereum. This relative resilience reinforces Bitcoin's role as the risk-off asset within crypto - the place capital rotates to before exiting the ecosystem entirely. When fear spikes, BTC is the last stop before the exit door.
.png?width=800&height=430&name=Untitled%20design%20(16).png)
Relative Rotation. The BTC/ETH pair tells the flight-to-quality story. Net flow favored BTC by $20.3M over the period, with 31 of 57 days showing rotation into Bitcoin over Ethereum. When de-risking, participants sold ETH harder than BTC. When staying in crypto, they chose Bitcoin. This preference showed up consistently - not a one-off spike, but a sustained lean toward BTC as the safer major throughout the drawdown.
Average trade sizes reveal participant composition:
- BTC swaps: $4,454 average
- USDC swaps: $2,905 average
- ETH swaps: $2,269 average
Larger players dominated BTC flow; smaller retail concentrated in ETH and stablecoin pairs. The implication: sophisticated capital with larger position sizes favored Bitcoin during the correction, while smaller participants either rotated to stables or traded ETH.
When smart money speaks, it speaks through flow data. The message here was clear - sustained preference for BTC over ETH, larger average trade sizes in Bitcoin pairs, and consistent rotation toward perceived safety. The flight-to-quality pattern held throughout the 57-day window, reinforcing Bitcoin's position at the top of the crypto risk hierarchy.
Rotation, Not Exodus
The Cycle Rotation Framework
Bitcoin cycles follow a predictable rotation pattern. Understanding where capital flows at each phase separates signal from noise during corrections.
The cycle has four phases. Accumulation occurs at cycle lows when prices are depressed and sentiment is capitulatory. Smart money - whales, long-term holders, institutions - accumulates from exhausted sellers. Retail is absent or liquidating. Supply concentrates in strong hands.
Markup follows as price appreciation attracts attention. Early buyers hold; new capital enters. The holder base expands as rising prices validate the thesis. Mid-cycle corrections shake out weak hands, but the dominant flow remains accumulation.
Distribution occurs near cycle peaks. Long-term holders who accumulated at lower prices begin taking profits. Retail arrives in force, buying the excitement at elevated valuations. Supply transfers from experienced hands to new entrants. HODL waves show old coins becoming young coins.
Markdown completes the cycle. Prices fall, retail capitulates, and the process resets. Supply returns to patient accumulators at lower prices.
The key distinction is corrections within bull markets versus bear market capitulation. Both involve falling prices and liquidations. But the on-chain signatures differ. Bear market capitulation shows broad-based distribution across all cohorts, long-term holders selling at losses, and supply moving down the wealth ladder. Bull market corrections show targeted distribution from mid-vintage holders, long-term holders staying firm, and supply moving up the wealth ladder into larger addresses.
This correction fits the bull market pattern. The 5+ year cohort held steady. Mega Whales accumulated 123,173 BTC. Distribution came from mid-tier holders taking profits, not diamond hands capitulating. The rotation follows the script - supply moving from shorter time horizons to longer ones, from smaller holders to larger ones, from weaker hands to stronger.
The on-chain evidence points in one direction: this correction triggered a wealth transfer, not a crisis of confidence.
Connecting the Threads. HODL waves show the oldest holders - 5+ year veterans - actually increased their share of supply by 26 basis points during a 30% drawdown. They held through $125,000 and they held through $88,000. The distribution came from mid-vintage holders (6 months to 2 years) who accumulated during earlier cycle phases and took profits into strength. Young supply expanded by 571 basis points as new entrants absorbed that distribution at elevated prices.
Balance buckets reveal where that supply landed. Mega Whales added 123,173 BTC (+4.41%) while retail cohorts shed 15,330 BTC. The largest addresses accumulated aggressively; the smallest addresses distributed steadily. Supply moved up the wealth ladder - the defining characteristic of healthy cycle rotation rather than capitulation.
Exchange flow confirms the mechanism. CEX saw 43 selling days versus 14 buying days, but the imbalance was modest (48.6% buys vs 51.4% sells). DEX activity showed de-risking into stables, but also rotation from ETH into BTC - a flight to relative quality. Larger players dominated BTC flow while retail concentrated in smaller ETH and stablecoin swaps.
What This Means. The coins that moved during this correction found stronger homes. Long-term holders stayed. Mega Whales accumulated. Mid-tier participants and retail distributed - exactly the pattern cycle theory predicts during corrections within ongoing bull markets.
The market that emerges from this rotation is structurally stronger. Supply now sits in wallets with longer time horizons, lower cost basis sensitivity, and higher conviction. The weak hands have been flushed. What remains is a cleaner holder base positioned for the next leg.

Links & Resources
For more weekly crypto market microstructure analysis, visit the Amberdata Research Blog. Access Amberdata Intelligence for institutional-grade digital asset intelligence powering actionable insights across blockchain and market data, or contact our team to discuss custom solutions for your risk management strategy.
Amberdata Research Library
https://www.amberdata.io/research-library
Amberdata Intelligence Platform
Amberdata Docs
Contact Us
https://www.amberdata.io/contact-us
Recent from Amberdata
- The ETF Exodus Decoded: Basis Arbitrage, Not Capitulation
- Coincidence or Signal? Did WLFI Telegraph Crypto's $6.93B Meltdown
- How $3.21B Vanished in 60 Seconds: October 2025 Crypto Crash Explained Through 7 Charts
- Five Signals of FOMC Impact: How Interest Rate Decisions Reshape Crypto Market Microstructure
- Beyond the Spread - Understanding Market Impact and Execution
- The Rhythm of Liquidity - Temporal Patterns in Market Depth
- DeFi Activity, Stablecoins, and the Impact on Price Volatility: Part 1
- DeFi Activity, Stablecoins, and the Impact on Price Volatility: Part 2
- DeFi Activity, Stablecoins, and the Impact on Price Volatility: Part 3
- How Do On-Chain Metrics Explain Bitcoin Volatility? Part 1
- How Do On-Chain Metrics Explain Bitcoin Volatility? Part 2
- Amberdata 2024 Digital Asset Market Intelligence Report: Exchanges & Derivatives
- Crypto Pairs Trading: Part 1 - Foundations of Moving Beyond Correlation
- Crypto Pairs Trading: Part 2 - Verifying Mean Reversion with ADF and Hurst Tests
- Crypto Pairs Trading: Part 3 - Constructing Your Strategy with Logs, Hedge Ratios, and Z-Scores
- Crypto Pairs Trading: Part 4 - Empirical Results & Performance Analysis
Disclaimers
The information contained in this report is provided by Amberdata solely for educational and informational purposes. The contents of this report should not be construed as financial, investment, legal, tax, or any other form of professional advice. Amberdata does not provide personalized recommendations; any opinions or suggestions expressed in this report are for general informational purposes only.
Although Amberdata has made every effort to ensure the accuracy and completeness of the information provided, it cannot be held responsible for any errors, omissions, inaccuracies, or outdated information. Market conditions, regulations, and laws are subject to change, and readers should perform their own research and consult with a qualified professional before making any financial decisions or taking any actions based on the information provided in this report.
Past performance is not indicative of future results, and any investments discussed or mentioned in this report may not be suitable for all individuals or circumstances. Investing involves risks, and the value of investments can go up or down. Amberdata disclaims any liability for any loss or damage that may arise from the use of, or reliance on, the information contained in this report.
By accessing and using the information provided in this report, you agree to indemnify and hold harmless Amberdata, its affiliates, and their respective officers, directors, employees, and agents from and against any and all claims, losses, liabilities, damages, or expenses (including reasonable attorney’s fees) arising from your use of or reliance on the information contained herein.
Copyright © 2025 Amberdata. All rights reserved.