Share this blog:
Previously, we examined the volatility and returns distributions of cryptocurrency traders and showed how traders can take advantage of higher or lower volatility and liquidity by simply trading between market hours. In this report, we will examine how volatility differs and trading behaviors differ between exchanges. We looked at BTC trading across Binance, Bybit, Coinbase (GDAX), HTX (Huobi), Kraken, and OKX (Okex) by aggregating trading volumes and returns across various trading pairs (USD and major stablecoins).The full list of exchanges and the pairs that are supported by the exchange are listed below:
|
Pair |
Binance |
Bybit |
Coinbase |
Huobi |
Kraken |
OKX |
|
BTC / USD |
❌ |
❌ |
✅ |
❌ |
✅ |
❌ |
|
BTC / USDC |
✅ |
✅ |
✅ * Recently trades under BTC / USD |
✅ |
✅ |
✅ |
|
BTC / USDT |
✅ |
✅ |
✅ |
✅ |
✅ |
✅ |
|
BTC / DAI |
✅ |
✅ |
❌ |
❌ |
✅ |
✅ |
|
BTC / FDUSD |
✅ |
❌ |
❌ |
❌ |
❌ |
❌ |
|
BTC / TUSD |
✅ |
❌ |
❌ |
✅ |
❌ |
❌ |
We simplified returns and trading volumes by calculating the total trading volume per exchange by hour as our reported trading volume. We also maintained the hourly return by pair rather than averaging returns across all pairs. In other words, our scenario represents $1 invested in each pair per hour.
We also compared the following regions and their respective market hours:
|
Region |
Timezone |
Start Time |
End Time |
|
U.S. |
Eastern |
9:30 am |
4:00 pm |
|
London (LSE, EU) |
Greenwich Mean Time |
8:00 am |
4:30 pm |
|
Frankfurt (FSE, EU) |
Central European |
9:00 am |
5:30 pm |
|
Central Asia |
Hong Kong |
9:30 am |
4:00 pm |
|
Japan |
Tokyo |
9:00 am |
3:00 pm |
|
India |
Mumbai |
9:15 am |
3:30 pm |
Crypto Volatility Between Exchanges
Like in our previous report, we used the standard deviation of returns as our proxy for volatility and compared trades occurring inside and outside their regional market trading hours. Limitations of this analysis include the diversity of each region’s approach, their general adoption of cryptocurrencies, the crossover of hours between regions, and the multitude of nuances between exchanges. However, our methodology does not attempt to isolate trading to these regions and merely identifies differences between them for potential trading opportunities. Diligent traders should perform their analysis using Amberdata to get a comprehensive understanding of risk or reward.
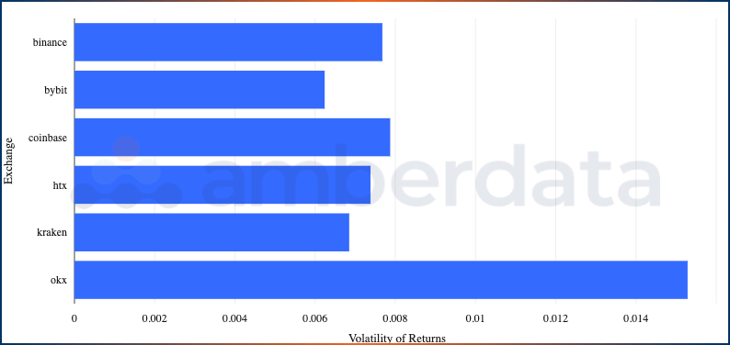
The standard deviation of hourly returns for trades on each exchange between 1/1/2018 and 10/31/2023.
When comparing the exchanges at a high level, we saw similarities between the exchanges with OKX as the sole exception to the rule. Excluding OKX as an outlier, Coinbase had the highest standard deviation of returns, followed by Binance and HTX, with Bybit having the lowest volatility. This visualization helped us establish a baseline of similar overall volatility of returns apart from OKX.
Volatility Between Centralized Exchanges and Timezones
We can expand this analysis by adding two more dimensions: regions and their respective trading hours.
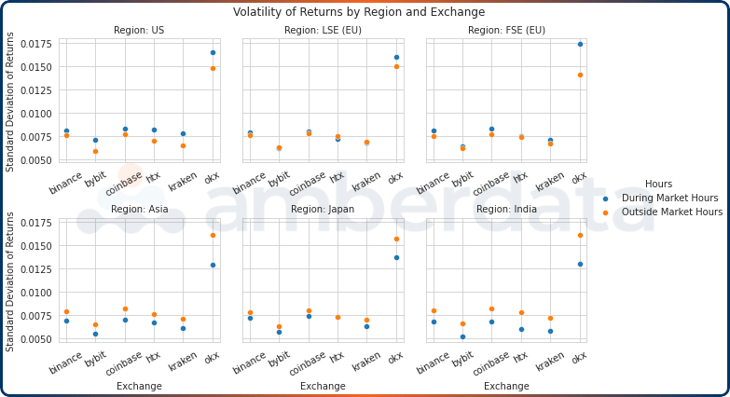
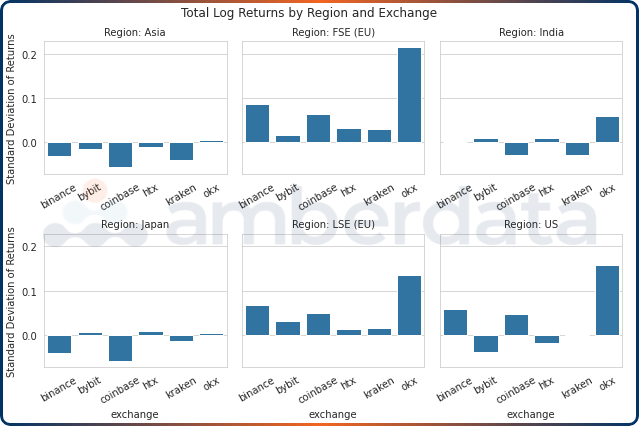
The standard deviation of hourly returns for trades on each region by exchange between 1/1/2018 and 10/31/2023.
Exchanges exhibit very similar trading behaviors across different regions, with all exchanges showing higher volatility outside of trading hours in APAC. In the West, Coinbase, OKX, and Binance had higher volatility during all market hours, but HTX, Kraken, and Bybit had lower volatility during London Stock Exchange (LSE) hours yet higher volatility during Frankfurt Stock Exchange (FSE) hours despite the short time difference. We can also assume that volatility provides liquidity, and thus U.S. traders can find higher volatility on Binance, Coinbase, and HTX than on Bybit. Asian traders trading on high volatility may want to flip their trading hours, while Japanese traders could use Binance, Coinbase, or HTX for similar volatility.
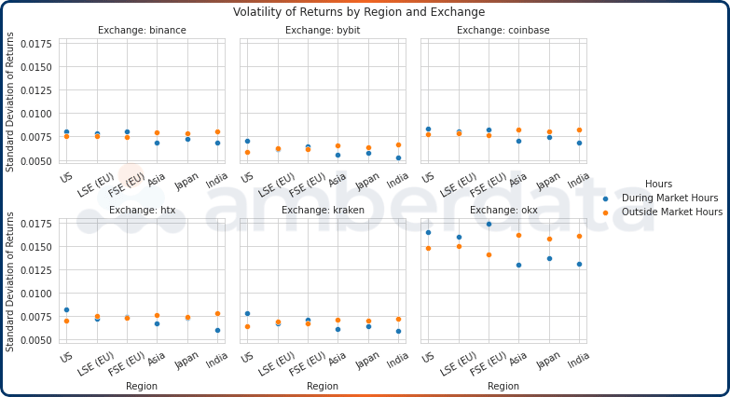
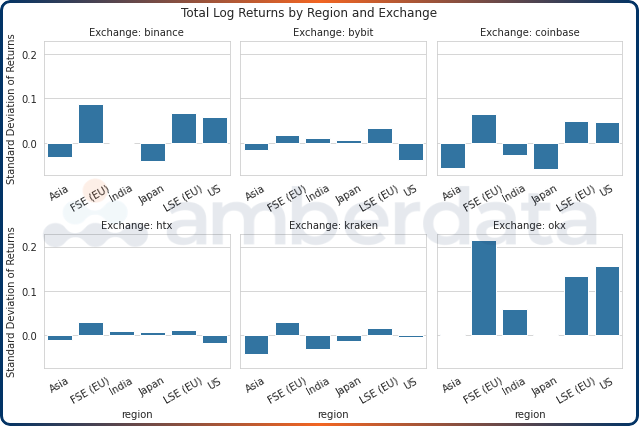
The standard deviation of hourly returns for trades on each exchange by region between 1/1/2018 and 10/31/2023.
Flipping the visualization, we examined the regional differences within each exchange. Binance, the world’s largest exchange, had the most narrow variance between regions, with Asia and India exhibiting the highest volatility difference between inside and outside market hours trading.
Hourly Token Trading Volume
Focusing on trading volumes, we get a different perspective on trading behaviors.
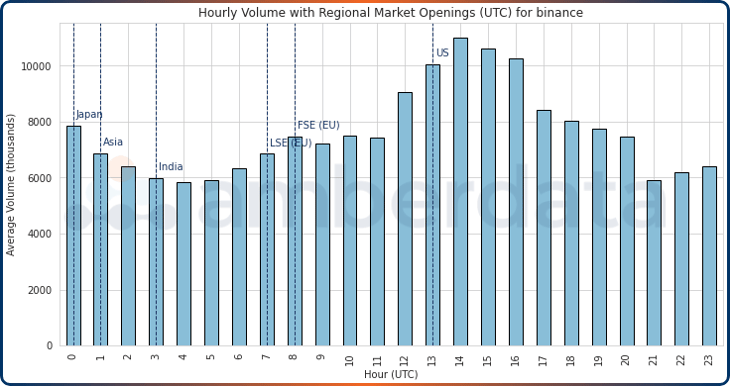
Average hourly volume (in thousands) for Binance between 1/1/2018 and 10/31/2023.
Binance often had the highest trading volume from 13:00 to 16:00 UTC between the end of European and US market hours and their beginning. Trading volume was lowest during Japan’s midday and Indian start hours of 02:00 and 06:00 UTC and after the U.S. ends at 21:00 UTC.
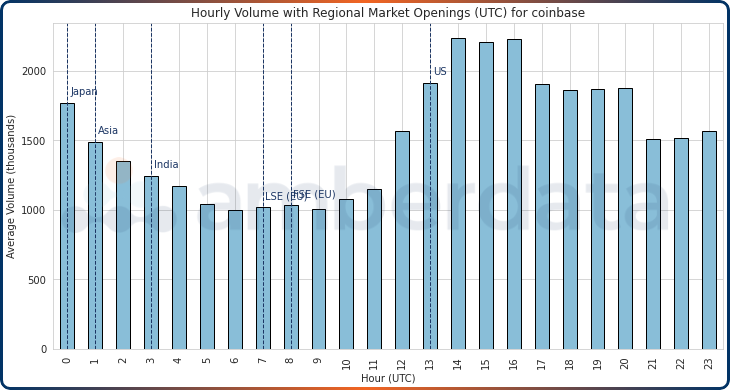
Average hourly volume (in thousands) for Coinbase between 1/1/2018 and 10/31/2023.
Coinbase’s peak hours were between 14:00 and 16:00 UTC, with U.S. trading hours keeping fairly stable trading volumes. Asia and Europe were major lows for the exchange and often had trading volumes less than half of peak volumes between 05:00 and 10:00 UTC. Compared to Binance, the US-based exchange appears to lose an edge in Asia with their customer base likely being concentrated in the United States. On scale, Coinbase had roughly 1/4th of the volume as Binance during peak hours and 1/5th of the volume during lows.
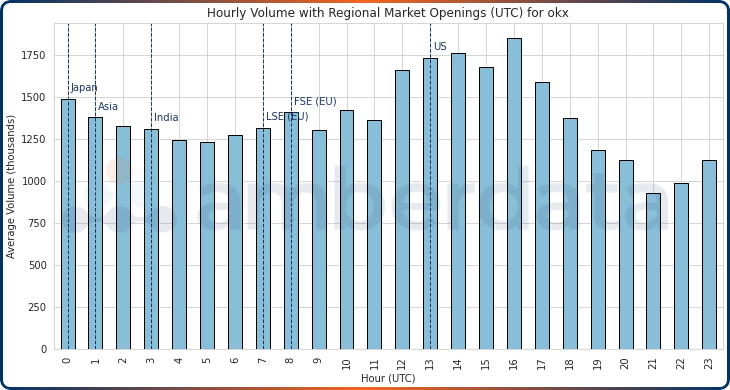
Average hourly volume (in thousands) for OKX between 1/1/2018 and 10/31/2023.
Our outlier exchange OKX exhibited a different pattern than the rest of the exchanges. Overall trading volume between 0:00 and 18:00 UTC was stable with some peaks during U.S. trading hours and dips during Indian trading hours. Lows between 21:00 and 22:00 UTC were over half of the volume of peak trading. There are many possible explanations for why OKX exhibits such behavior, such as trading bots. It is important to understand that exchanges have similar yet different trading environments, so choosing which exchange to use is a critical factor in any strategy.
Hourly Average Returns
When examining hourly returns, we saw even more similarities between exchanges.
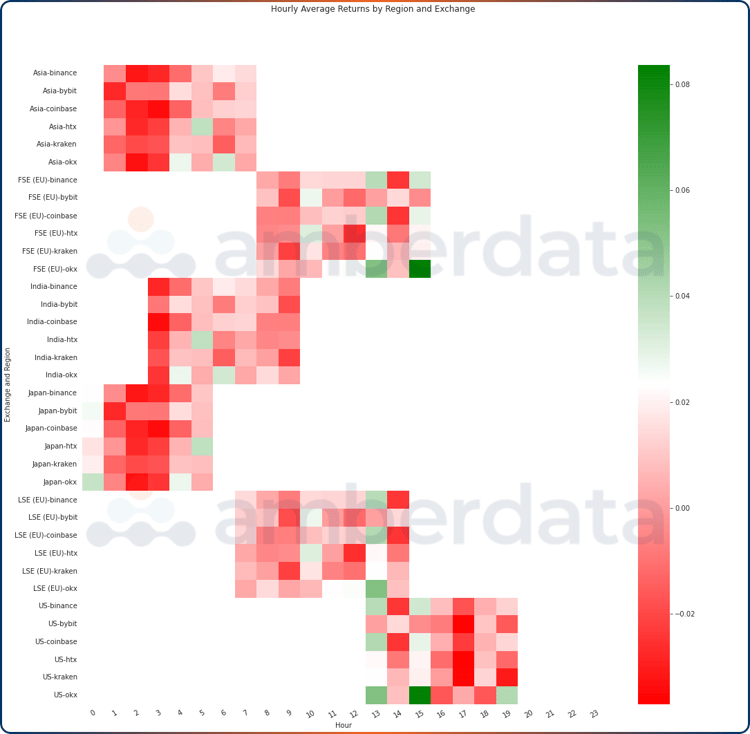
Average hourly returns for exchanges and regions between 1/1/2018 and 10/31/2023.
In the Central Asia region, most exchanges had similar high and low hours of returns, with later hours showing less negative returns than earlier hours. European FSE and LSE hours exhibited dynamic hourly returns, with several neutral hours as compared to the number of red areas in Asia. The highest returns most often occurred at 13:00 UTC when Europe was wrapping up its day and the United States started, and at 15:00 UTC after London ended its day.
Cumulative Log Returns
As we did in the previous report, we expand our hourly returns data further by looking at the cumulative log returns across each region and exchange.
Cumulative log returns for trades between 1/1/2018 and 10/31/2023.
Outside of OKX, Binance traders fared the best for cumulative return volatility when trading during FSE, LSE hours, and US hours, with Coinbase users behind them. Users based in Japan, Central Asia, and India fared the worst. This regional comparison illustrates how many exchanges have comparable volatility during regional market hours. The slight difference between exchanges allows sophisticated traders to take advantage of higher or lower volatility and liquidity between different markets by trading on different exchanges.
Cumulative log returns for trades between 1/1/2018 and 10/31/2023.
Bybit and HTX users had the most delta-neutral cumulative log returns in all regions other than the United States and Central Asia. Aside from our outlier OKX, Coinbase and Binance had higher volatility for all regions.
Hourly Garman-Klass Volatility
For comparison, we also included an analysis of the Garman-Klass Volatility (GK) which provides a measure for high and low volatility (hours with > 1 or < 1 standard deviations from GK, respectively).
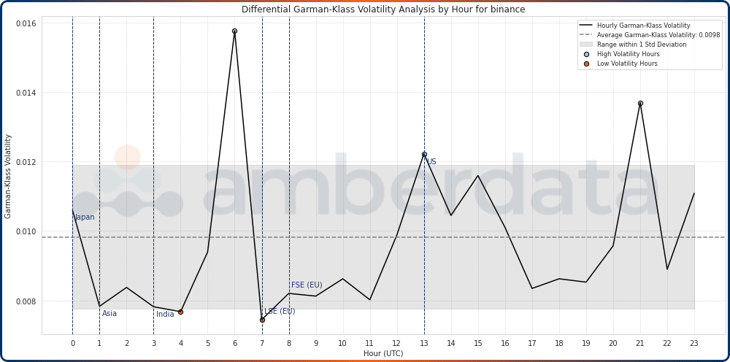
Hourly Garman-Klass volatility and ranges for trades on Binance between 1/1/2018 and 10/31/2023.
We can see from Binance’s GK volatility chart that the highest volatility occurred during the 06:00 UTC hour, with smaller high volatility points at 13:00 and 21:00 UTC. Low volatility occurred during 04:00 and 07:00 UTC, which was surprising given the highest volatility peak took place directly between those hours.
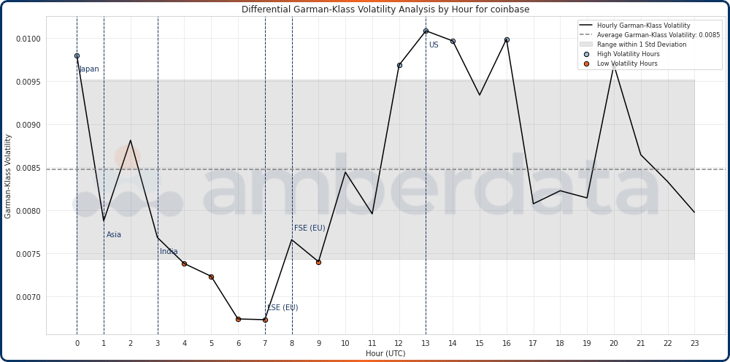
Hourly Garman-Klass volatility and ranges for trades on Coinbase between 1/1/2018 and 10/31/2023.
On Coinbase, we have already seen how US traders on average provided the highest volume trading hours. Still, volatility also peaked several times during the US market hours, with one peak right at the end of the day at 20:00 UTC and another at the start of Japan’s trading day at 00:00.
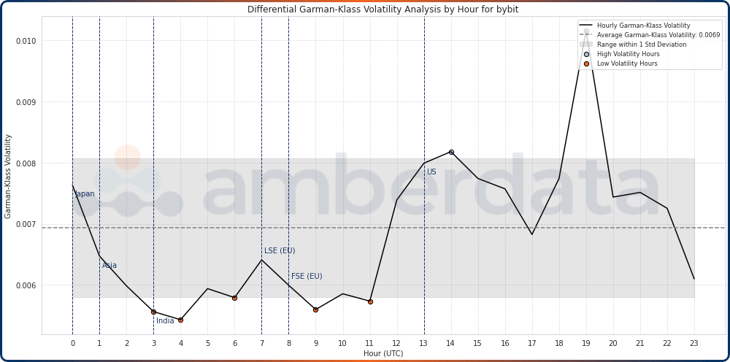
Hourly Garman-Klass volatility and ranges for trades on Bybit between 1/1/2018 and 10/31/2023.
Bybit is another interesting exchange that exhibits several low volatility hours: 03:00, 04:00, 06:00, 09:00, and 11:00 UTC, with only two high volatility hours: 14:00 and 19:00 UTC. Bybit’s 19:00 UTC volatility peak matched that of Coinbase’s 13:00 UTC peak, though volatility was far lower on Bybit than on Coinbase.
Conclusion
Despite differing user bases, popular centralized cryptocurrency exchanges exhibited very similar trading behaviors across different timezones and regions. Because the global scale of crypto exchanges is frequently intertwined and there are often no restrictions in the flow of funds between exchanges, users can move quickly between exchanges to optimize trading strategies or gain value in small price discrepancies. Highly liquid tokens and pairs often maintain a tight range between exchanges, and sometimes these exchanges share market makers so crypto order books are much more connected than we think. Minor differences between exchanges can provide traders with useful information not only on when to trade but also where.
