Share this blog:
Previously, we examined the volatility and returns distributions of cryptocurrency traders and showed how traders can take advantage of higher or lower volatility and liquidity by simply trading between market hours. After that, we expanded our research into volatility and returns across timezones for various exchanges. In this report, we will examine how volatility differs between tokens, which can give insights into trading behaviors and can lay a foundation for token research and risk evaluations.
We looked at trading across Binance, Bybit, Coinbase (GDAX), Huobi (HTX), Kraken, and Okex (OKX) by aggregating trading volumes and returns across various trading pairs (USD and major stablecoins) for BTC, ETH, DOGE, XRP, USDC, and USDT. The complete list of exchanges and supported pairs is below:
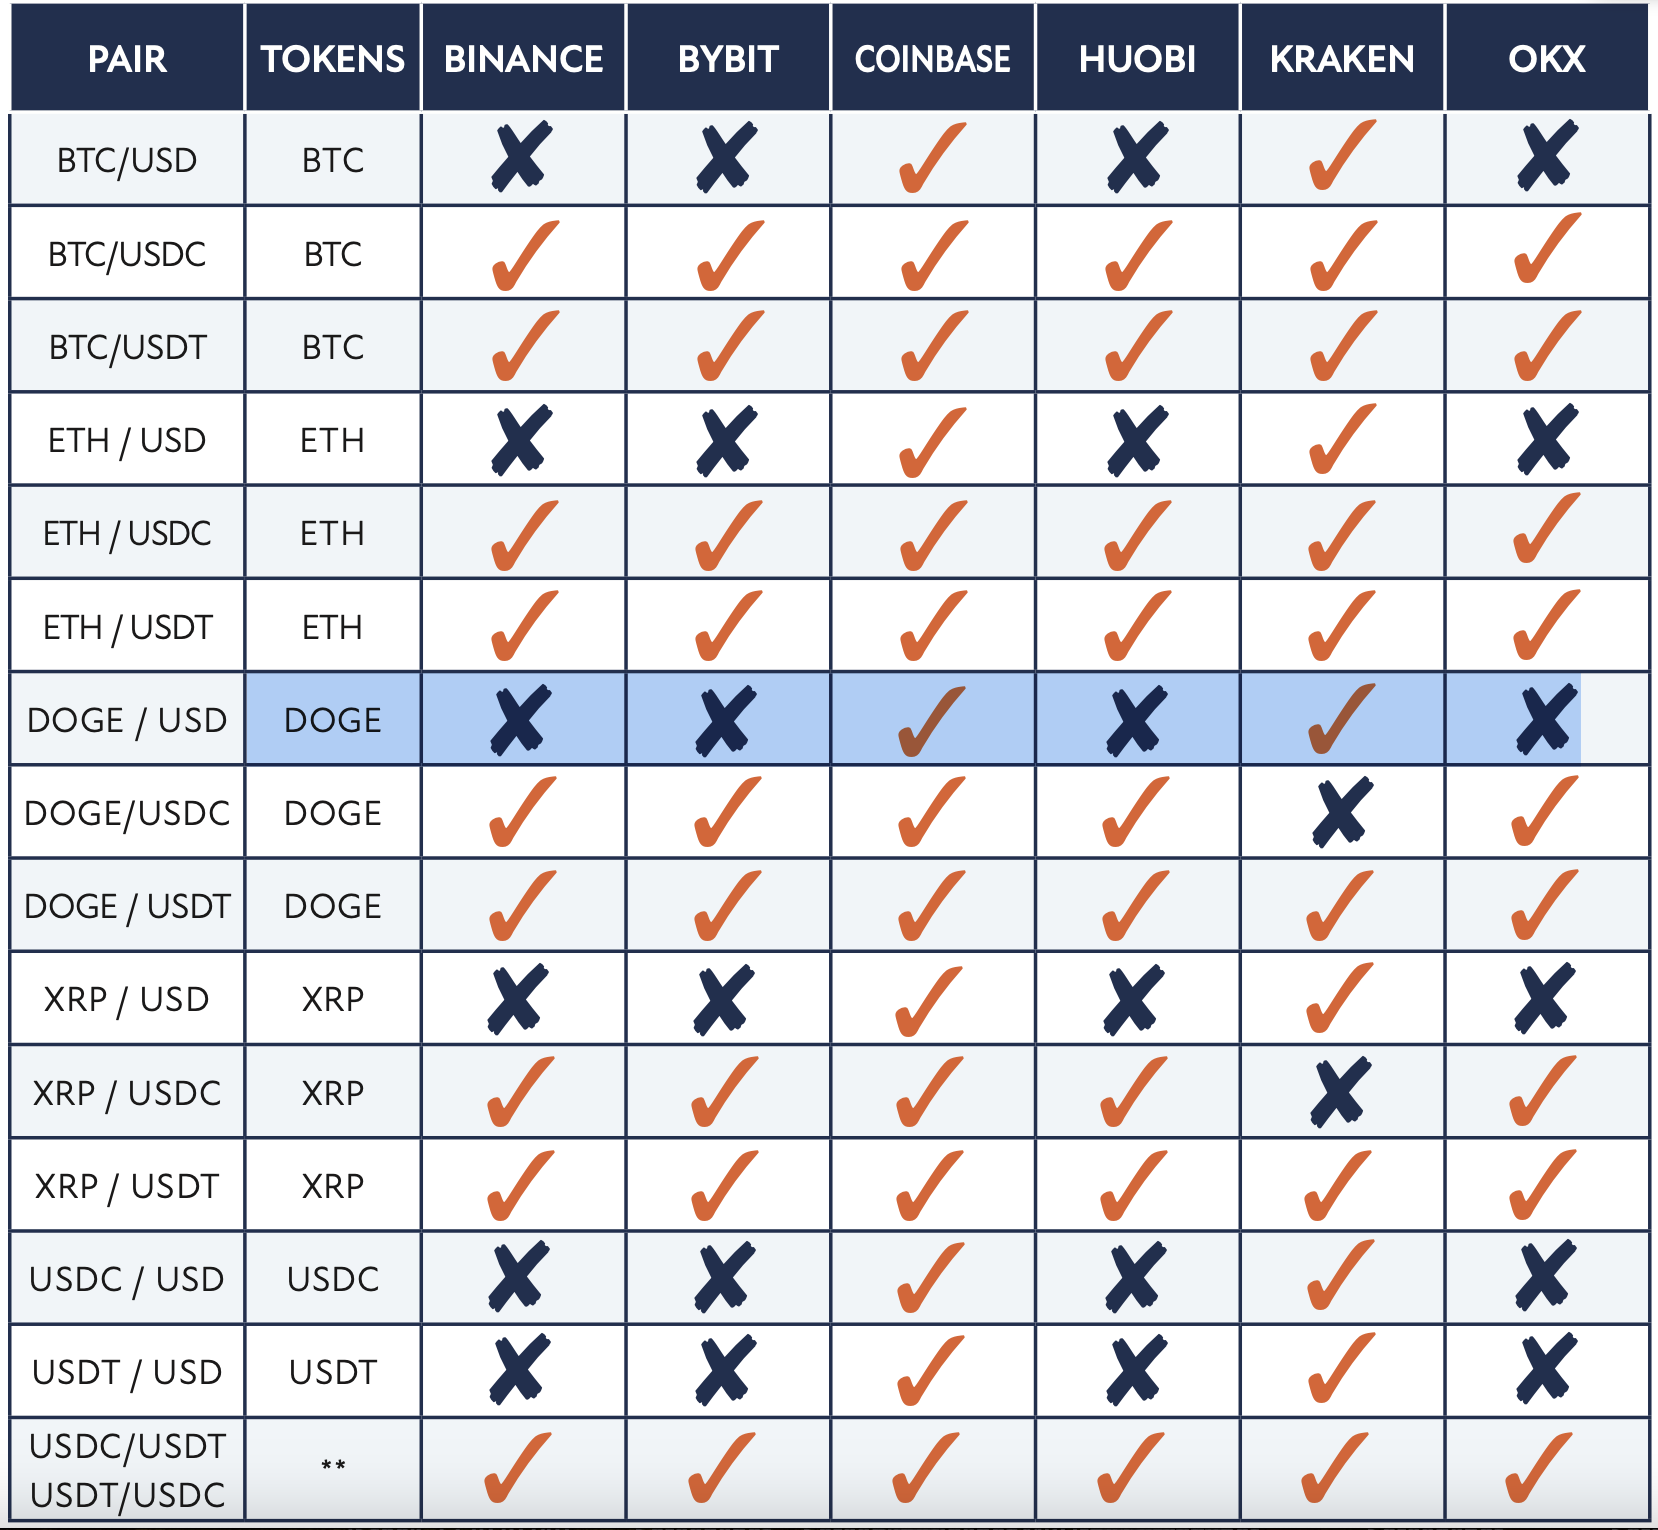
* Coinbase USDC trading pairs trade under the USD trading pair
** USDC/USDT trading pairs were not used in this analysis but are included here as a special mention. The pairs were not used as their inclusion would increase the correlation between the two and could obfuscate differences in trading behavior that were critical to the analysis.
We simplified returns and trading volumes by calculating the total trading volume per exchange by hour as our reported trading volume. We also maintained the hourly return by pair rather than averaging returns across all pairs. In other words, our scenario represents $1 invested in each pair per hour. Please note that these trading pairs and tokens have nuances, so comparisons may not always be appropriate for every use case.
This report uses the standard deviation of returns as our proxy for volatility. This report also compares trades occurring within and outside of regional market hours. Limitations include the stark differences between each token and the nuances of their use cases. The volatility of returns in this report does not relate to risk, as token risk is far more complicated than price volatility.
Volatility Between Tokens
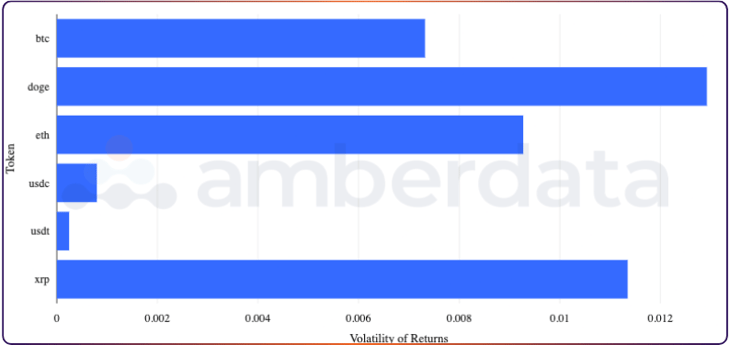
The standard deviation of hourly returns for trades on each token between 1/1/2018 and 10/31/2023.
Comparing the volatility of returns between each token between 1/1/2018 and 10/31/2023, we saw that DOGE and XRP have far higher volatility than BTC. DOGE in particular has been a rollercoaster after the memecoin was taken under X (formally Twitter) owner Elon Musk’s wing, who sporadically promoted the dog token. Musk’s acquisition of X also led speculators to hype the token in hopes of a payment integration. XPR faced regulatory battles and was listed, de-listed, and re-listed by several centralized exchanges after the SEC moved forward (and finally lost) with multiple suits accusing the token of being a security. After Ripple won on multiple charges, the token has seen higher-than-usual price volatility.
BTC’s low volatility is unsurprising since it is relative to other tokens which are volatile. The original cryptocurrency is often the first mover in any rise or fall in the macro-token environment and has far less dramatic swings in price than tokens like DOGE and XRP.
Crypto Volatility Between Tokens and Timezones
Next, we split the return volatility by region and their trading hours.
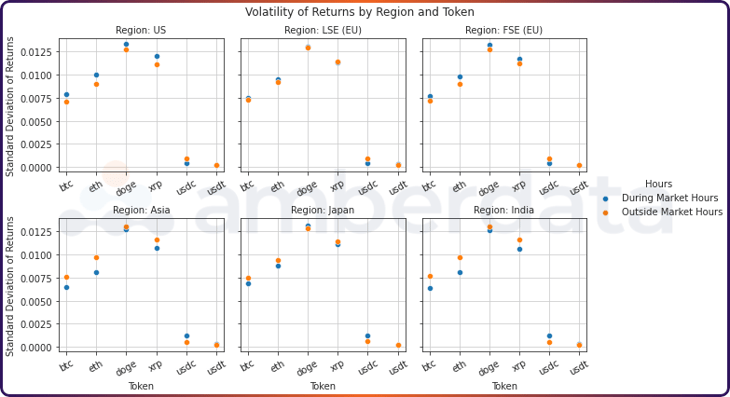
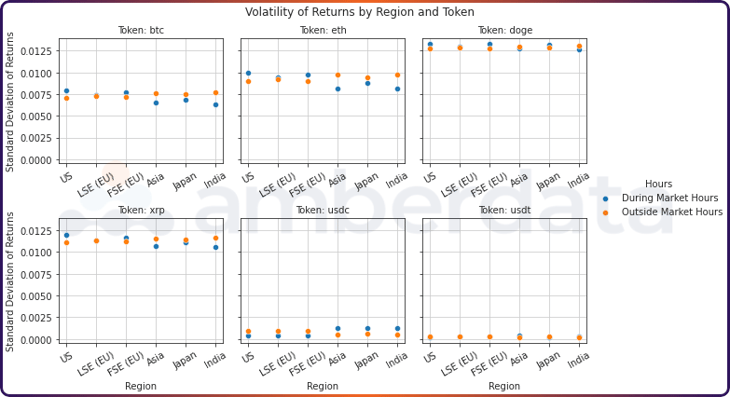
The standard deviation of hourly returns for trades on each region by token between 1/1/2018 and 10/31/2023.
Starting with regions, our three Western areas (US, London, and Frankfurt) all tend to see higher volatility during market hours while our three eastern regions (Asia, Japan, and India) see higher volatility outside of market hours. Stablecoins are the exceptions, which see slightly higher volatility during Eastern market hours. This higher volatility may be due to lower trading volumes on these tokens during the late Western hours or a cause of the higher exchange rate volatility between stablecoins and their local region currency.
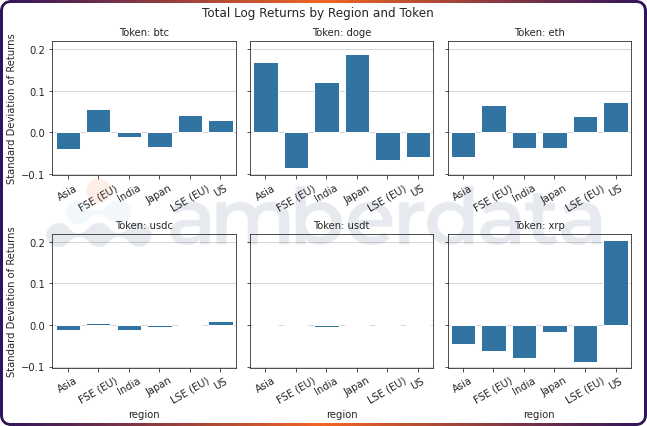
The standard deviation of hourly returns for trades on each token by region between 1/1/2018 and 10/31/2023.
Splitting our view by token, we saw that ETH and BTC tend to have a higher variance between regions’ market hour trading to non-market hour trading time frames. For example, the difference between Asia’s market hours and non-market hours volatility is higher than any other. DOGE and XRP seem to have tight deltas between every region’s market hour and outside market hour trading volatility, which may potentially point to relatively stable trading environments throughout the day. Compared to USDT, USDC tends to have higher return volatility, especially during Eastern market hours.
Hourly Token Trading Volume
To enhance our return volatility analysis, we investigated what hours have higher trading volumes for each token.
%20for%20BTC.png?width=730&height=393&name=Amberdata%20API%20Hourly%20volume%20with%20regional%20market%20openings%20(UTC)%20for%20BTC.png)
Average hourly volume (in thousands) for BTC between 1/1/2018 and 10/31/2023.
Bitcoin’s peak trading hours occur most often during US market times and are lowest during Asian trading hours. Given the large differences in peak and trough hourly trading volumes, diligent BTC traders can find the highest liquidity during US market hours between 13:00 and 16:00 UTC. US traders looking to take advantage of lower volumes should switch their focus on the late Indian market hours between 03:00 and 06:00 UTC.
%20for%20DOGE.png?width=730&height=384&name=Amberdata%20API%20Hourly%20volume%20with%20regional%20market%20openings%20(UTC)%20for%20DOGE.png)
Average hourly volume (in thousands) for DOGE between 1/1/2018 and 10/31/2023.
As we speculated earlier, DOGE appears to have fairly evenly distributed trading volumes between all-day hours. DOGE trades highest on CEXs during US market hours between 13:00 and 16:00 UTC, but low volume hours can be found at 21:00 - 23:00 UTC. Tokens in our analysis tend to have low volume hours around half of the peak volume, but the infamous memecoin managed to maintain almost 75% of the peak hour trading volume. Despite DOGE’s high price volatility, trading volume remains stable throughout the day and has high liquidity and volatility during all hours – a day trader’s gold mine.
%20for%20USDC.png?width=730&height=387&name=Amberdata%20API%20Hourly%20volume%20with%20regional%20market%20openings%20(UTC)%20for%20USDC.png)
Average hourly volume (in thousands) for USDC between 1/1/2018 and 10/31/2023.
%20for%20USDT.png?width=730&height=387&name=Amberdata%20API%20Hourly%20volume%20with%20regional%20market%20openings%20(UTC)%20for%20USDT.png)
Average hourly volume (in thousands) for USDT between 1/1/2018 and 10/31/2023.
USDC and USDT have several nuances, many of which we have previously discussed in our stablecoin primer. The two tokens display very similar trading patterns, though as expected, the scale of trading is far higher with the USDT/USD trading pair than USDC/USD. One key difference: there seems to be slightly higher USDC trading during European hours.
Hourly Average Returns
By examining hourly returns, we can see several differences between token returns:
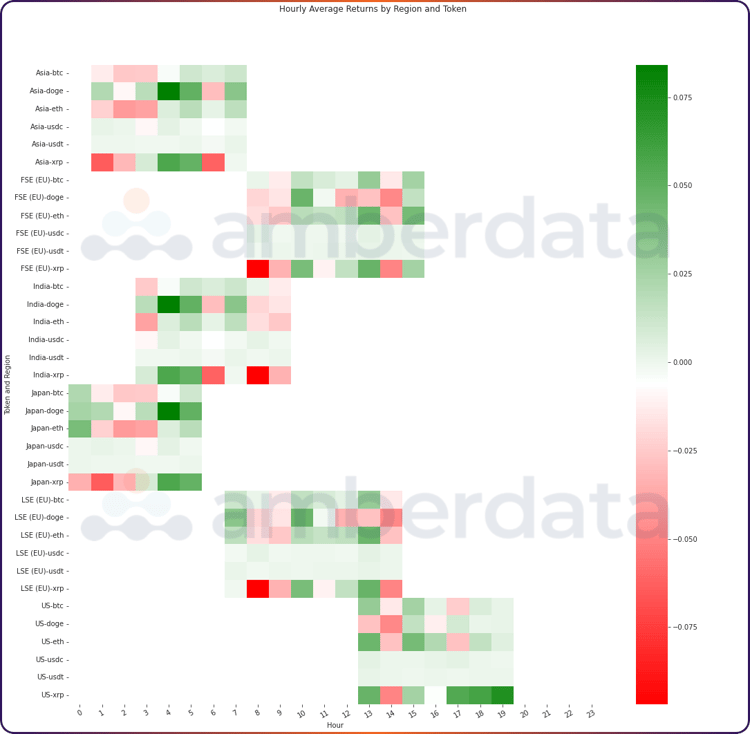
Average hourly returns for tokens and regions between 1/1/2018 and 10/31/2023.
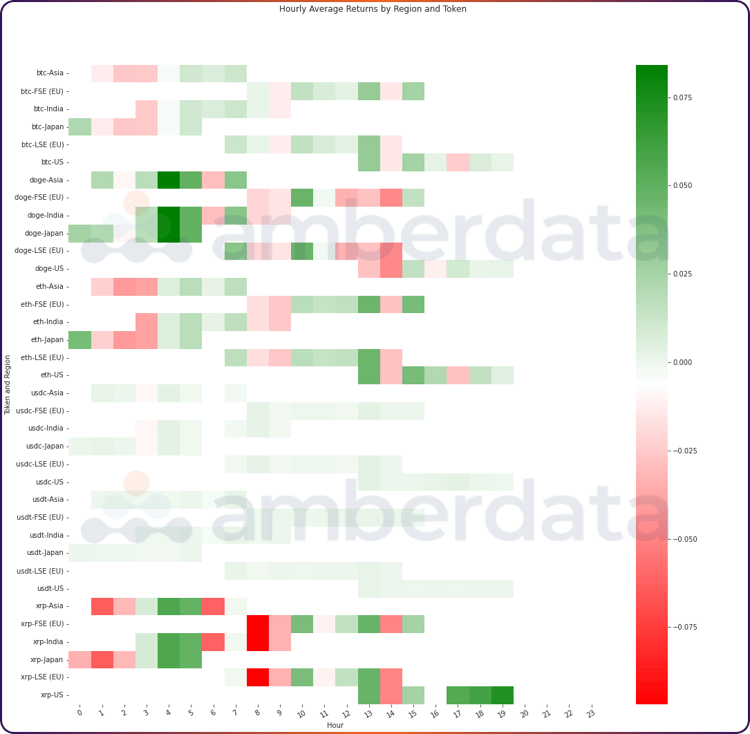
Average hourly returns for tokens and regions between 1/1/2018 and 10/31/2023.
Cumulative returns appeared to be dynamic between tokens and regions. As expected, our stablecoins are fairly stable between every region during market hours. During market hours for Asia and Japan, we saw overall positive returns for DOGE. Meanwhile, BTC sees higher positive returns during European and US hours. XRP and ETH were mixed, with XRP having the highest positive returns during late US hours and late Japan hours.
Cumulative Log Returns
Cumulative log returns provide us with more standard comparisons across tokens:
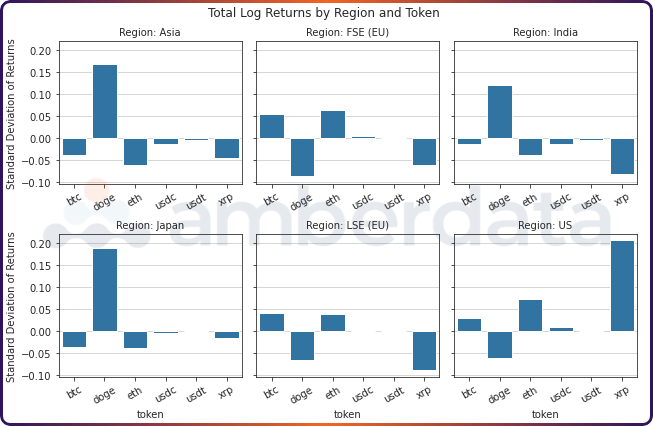
Cumulative log returns for trades between 1/1/2018 and 10/31/2023.
Cumulative log returns for trades between 1/1/2018 and 10/31/2023.
The cumulative log returns paint a very similar picture to what we saw before, with DOGE and XRP having more volatility overall in most regions. The biggest returns were on DOGE in Asia, Japan, and India, as well as XRP trading in the US.
Hourly Garman-Klass Volatility
For comparison, we also included an analysis of the Garman-Klass Volatility (GK) which provides a measure for high and low volatility, or hours with > 1 or < 1 standard deviation from GK, respectively.
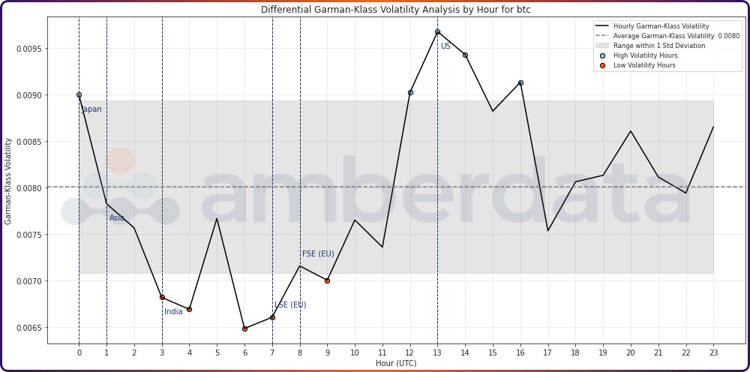
Hourly Garman-Klass volatility and ranges for BTC trades between 1/1/2018 and 10/31/2023.
High volatility during US hours peaks at the start of the day at 13:00 UTC. However, there was another peak in volatility during the start of Japan trading hours at 00:00 UTC. GK Volatility also confirmed that low points in BTC trading occur every hour between 03:00 and 09:00 UTC. Traders can take advantage of the lower volatility by trading during those hours. They can also find higher volatility during US trading hours.
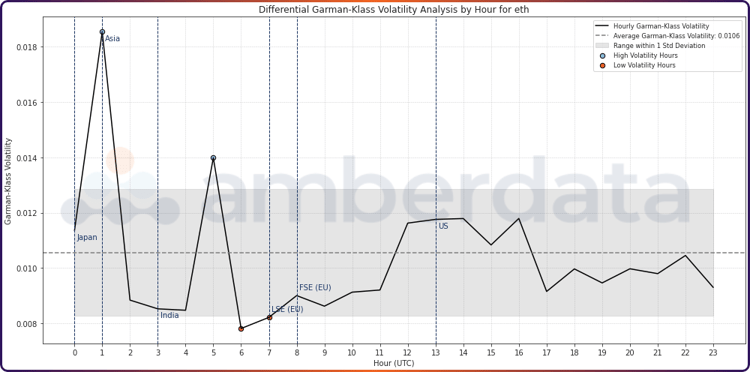
Hourly Garman-Klass volatility and ranges for ETH trades between 1/1/2018 and 10/31/2023.
ETH is a great counterpart to the highest market cap token BTC, which displays high volatility during Japanese and Asian trading hours. ETH has the fewest high volatility hours of all tokens analyzed in this report, with the only two peaks taking place at 01:00 UTC and 05:00 UTC. Overall, ETH is a far more stable token than BTC for trading throughout the day.
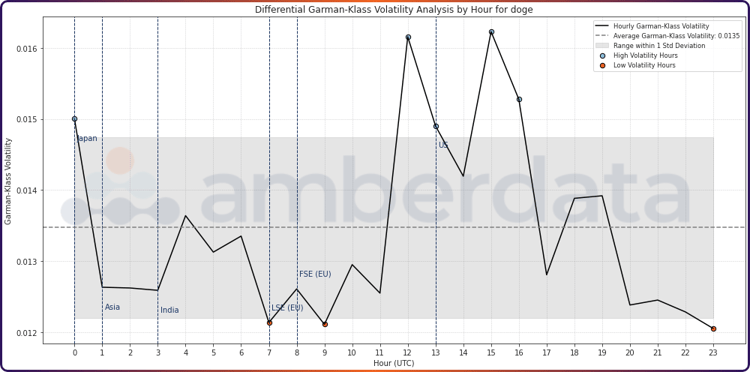
Hourly Garman-Klass volatility and ranges for DOGE trades between 1/1/2018 and 10/31/2023.
Despite the relative stability of trading volumes throughout the day, DOGE still had opportunities to capture high or low volatility, primarily during US and European hours respectively. Overall, DOGE and ETH have the lowest number of troughs with only three periods displaying low volatility.
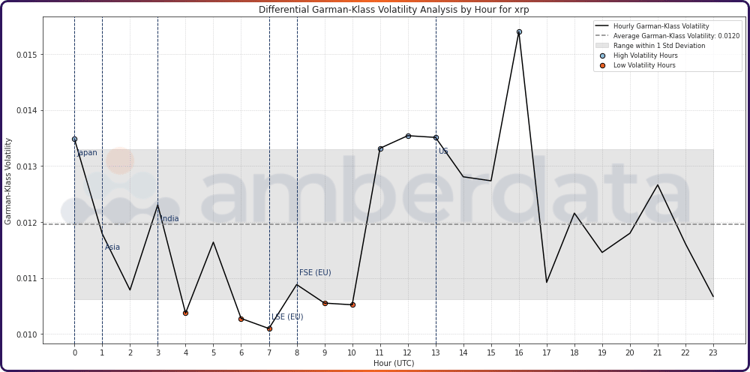
Hourly Garman-Klass volatility and ranges for XRP trades between 1/1/2018 and 10/31/2023.
XRP holders can look to India and Europe for long-term position acquisitions as these regions show multiple hours of low volatility. Traders can find the most opportunities starting a few hours ahead of US trading hours with several high volatility peaks taking place between 11:00 and 13:00 UTC. XRP’s trading volatility peaks around 16:00 UTC during the middle of the US market trading hours.
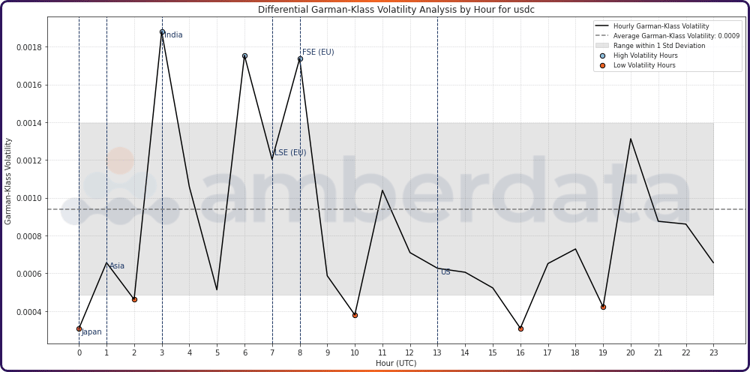
Hourly Garman-Klass volatility and ranges for USDC trades between 1/1/2018 and 10/31/2023.
USDC return volatility peaks during Asian hours, which tend to have lower trading volumes. Several low volatility periods exist throughout the day, however. When compared to the non-stablecoins in this report, the scale of volatility is far lower with an average GK of around 0.00095 as compared to BTC’s 0.0105.
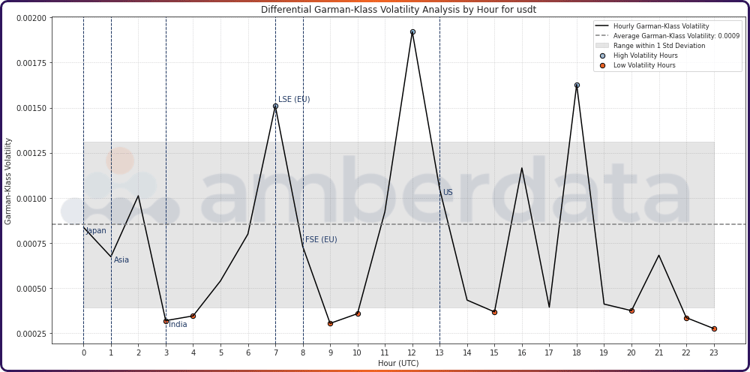
Hourly Garman-Klass volatility and ranges for USDT trades between 1/1/2018 and 10/31/2023.
Similar to USDC, several low volatility periods are scattered throughout the day for USDT trading. High volatility peaks are much different from USDC’s, and USDT sees higher volatility during later hours in the day while USDC has higher volatility earlier in the day.
Conclusion
This series of research has uncovered a wealth of trading behaviors. We found that average BTC trading tends to be high during US trading hours and lower during Asian trading hours. When we expanded this analysis to exchanges, we saw that all exchanges had higher trading volumes during US hours, with some exchanges in Asia more stable and with higher volumes than others.
Looking at tokens, USDC had more volatile returns than USDT. Trading on USDC frequently has higher peaks during European trading hours while USDT has higher peaks during Asian trading hours, indicating that there are likely more European traders than Asian traders on USDC, and vice versa. DOGE trading volumes are relatively stable throughout the day compared to other tokens and its returns are much less volatile across every region compared to BTC, ETH, and XRP, which tended to have higher return volatility for US, Asia, and India market hours.
These significant differences between how tokens trade across market hours help arm traders with critical information not only about what to trade but also when.
References
This Jupyter Notebook includes all the necessary code and comments to help you understand how the data was collected, the analysis performed, and how the visualizations were created. Feel free to explore, modify, and use this code as a basis for your investigations.
