Share this blog:
Introduction
In the fast-paced world of trading, every transaction, every bid, every ask, and every tick of price movement matters. Market participants, from high-frequency traders to long-term investors, use numerous techniques and tools to make informed decisions, enhance their trading strategies, and ultimately, increase their profitability. This report explores two critical aspects of trading that can provide a competitive edge in the marketplace: bid/ask order quantities and volume profiles.
Bid/ask order quantities reflect the supply and demand dynamics at each price level and offer crucial insights into market sentiment. Traders closely monitor these quantities to gain a sense of where the market is heading. A sudden increase in bid quantities, for instance, might signal a bullish sentiment, potentially leading to price increases.
Meanwhile, volume profiles provide a detailed breakdown of trading activity at different price levels. Unlike traditional volume indicators that simply tally the total trading volume for a specific time period, volume profiles offer a granular perspective, showing where exactly the majority of trading activity took place. Understanding volume profiles allows traders to identify key areas of support and resistance, enabling them to predict potential future price movements with more accuracy.
Moreover, the relationship between the bid/ask order quantities and volume profiles can create rich insights into market dynamics, potentially revealing unique trading opportunities.
This report delves into these topics in-depth, discussing their implications for trading strategies and market analysis. It sheds light on the complexities of bid/ask order quantities, provides an extensive overview of volume profiles, and examines the intriguing relationship between these two trading components. The analysis is supported by statistical and analytical tools to provide a clear, data-driven perspective on the subject matter.
The purpose of this report helps market participants gain a comprehensive understanding of these two critical aspects of trading. This understanding can help shape effective trading strategies, improve decision-making, and, ultimately, lead to better trading outcomes.
Exploring Bid/Ask Order Quantities
When it comes to the stock market, every tick on the screen tells a story. Each moment presents a narrative of its own, which we can decipher by focusing on Bid/Ask order quantities. These quantities serve as a temperature check for the market, gauging the mood of buyers and sellers at any given point in time.
Bids and asks represent the immediate supply and demand dynamics in the market. They signify the amount of currency buyers are willing to purchase (bids) and the number of sellers are willing to sell (asks) at a certain price. When these numbers shift, it signals a change in market sentiment, potentially pointing to an upcoming shift in price. With careful observation, these quantities can serve as an early warning system for traders to anticipate market movements.
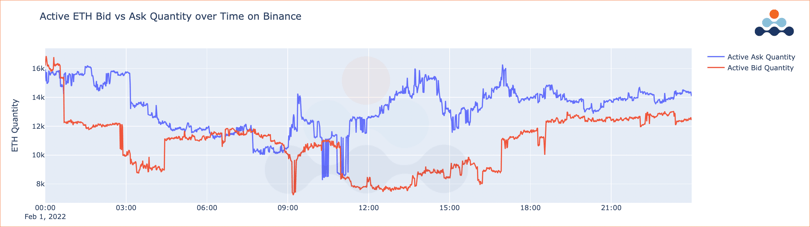
Looking at our first visualization, titled "Active ETH Bid vs. Ask Quantity over Time on Binance", we see a time series representing active ask and bid quantities at different time points. What's interesting is not only how these values change with time, but also the trend of these lines.
By following the trend, traders could understand the market's momentum. A rising bid line might suggest a growing buying interest, potentially indicating a bullish trend. Conversely, a rising ask line could mean increasing selling pressure, hinting at a bearish trend. Recognizing these trends can provide traders with valuable insight, helping them anticipate future market behavior.
Additionally, the points where the ask and bid lines intersect might indicate a potential inflection point. Such instances could suggest a balance between buying and selling pressures, which might indicate a pivotal moment in the market.
Also, it's worth paying attention to how ask and bid quantities fluctuate relative to each other. There are times when ask quantities surpass bid quantities, and vice versa. Spotting these disparities can help identify potential trading opportunities. For example, a surplus of ask quantities might hint at an oversupply in the market, possibly creating a prime buying opportunity for traders.
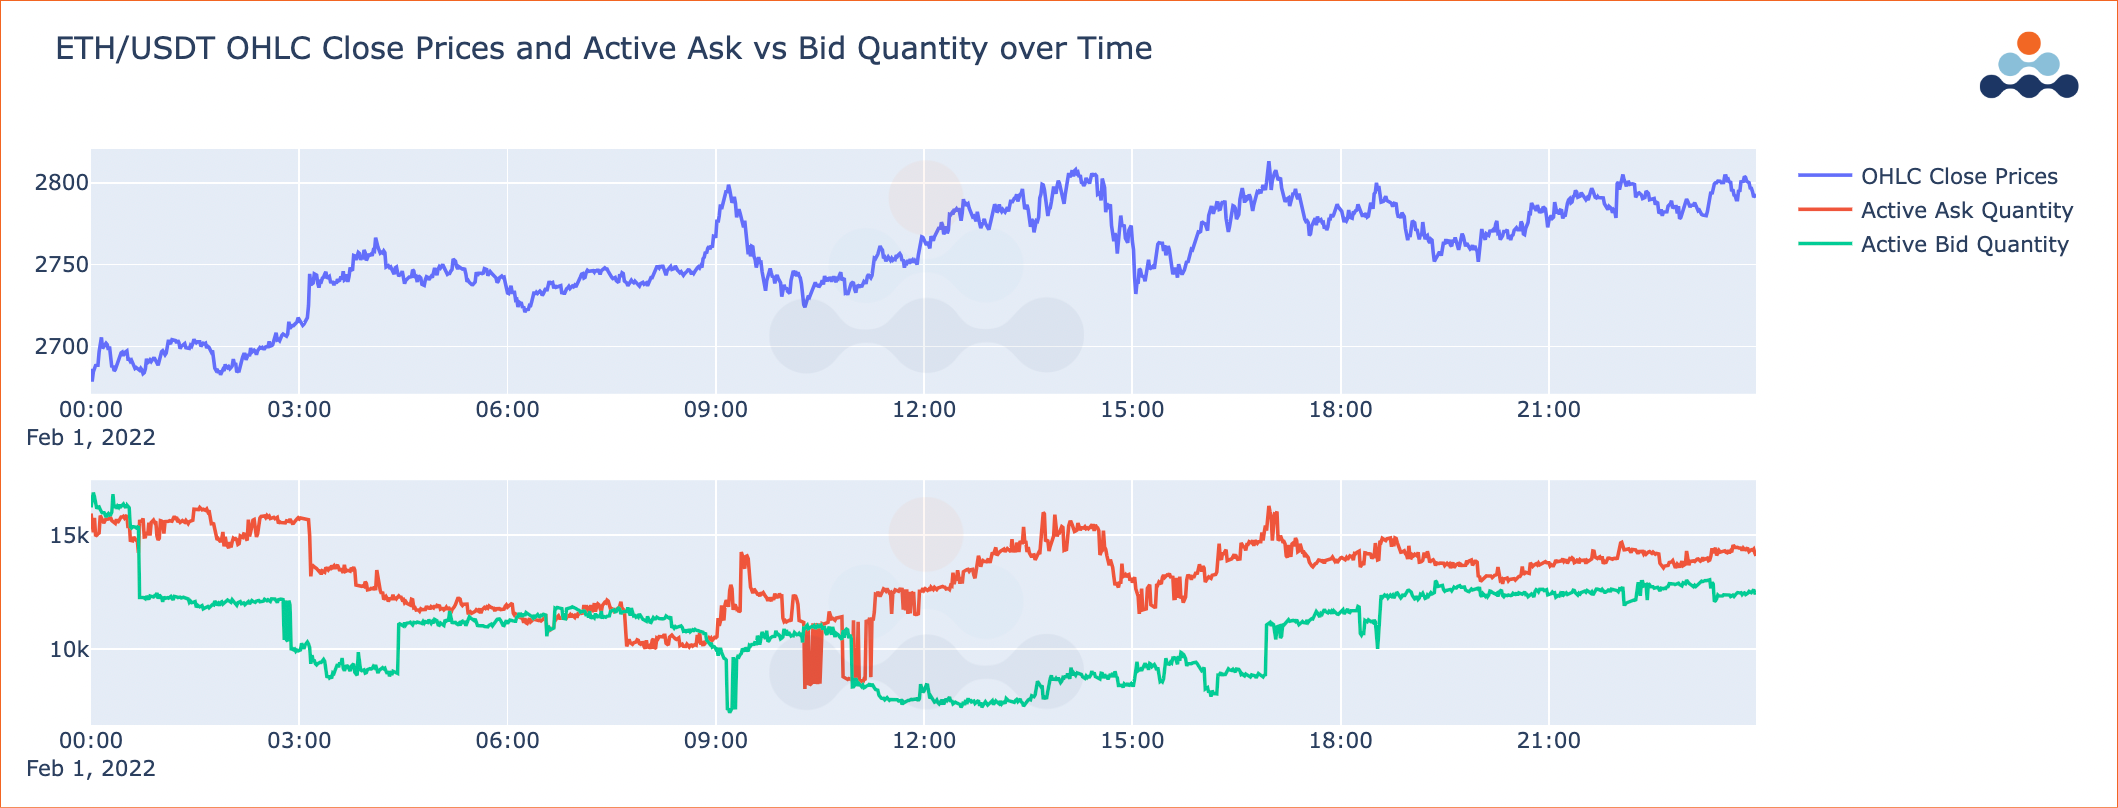
In the visualization titled "ETH/USDT OHLC Close Prices and Active Ask vs Bid Quantity over Time", we've added a new dimension by including the close prices for ETH/USDT. This graph consists of two sections, the top one displaying close prices and the bottom one presenting active ask and bid quantities.
The upper subplot allows traders to visualize the price trend over the specified timeframe, as well as recognize periods of intense volatility. For instance, if we see a consistent rise in ETH/USDT close prices, indicating a bullish trend, it could be substantiated by an increase in bid quantities. Alternatively, if the bid quantities are not rising with the price, it might suggest a weakening trend and a possible reversal.
The lower subplot showing active ask and bid quantities offers a comparative analysis against the close prices. For example, a significant increase in bid quantities coupled with a rise in the close prices could imply a strong buying interest, and thus, a bullish market sentiment. Conversely, if the close prices are falling despite an increase in ask quantities, it might suggest a stronger bearish sentiment. Such insights are valuable for traders in planning their trading strategies.
Understanding Volume Profile
Trading volume, on its own, tells us a story about “how much.” However, to form a complete narrative, we also need to know the “at what price.” That's where Volume Profile steps in. This tool provides a detailed look at how trading volume is distributed across different price levels, unveiling a new layer of market insights.
Volume Profile helps to identify price levels that have seen the most activity, essentially drawing a map of where the majority of transactions have occurred. These regions are typically of significant interest to traders as they represent potential areas of support and resistance. This tool uncovers the depth of the market, revealing the concentration of trading activity and helping us to understand where the market finds value.
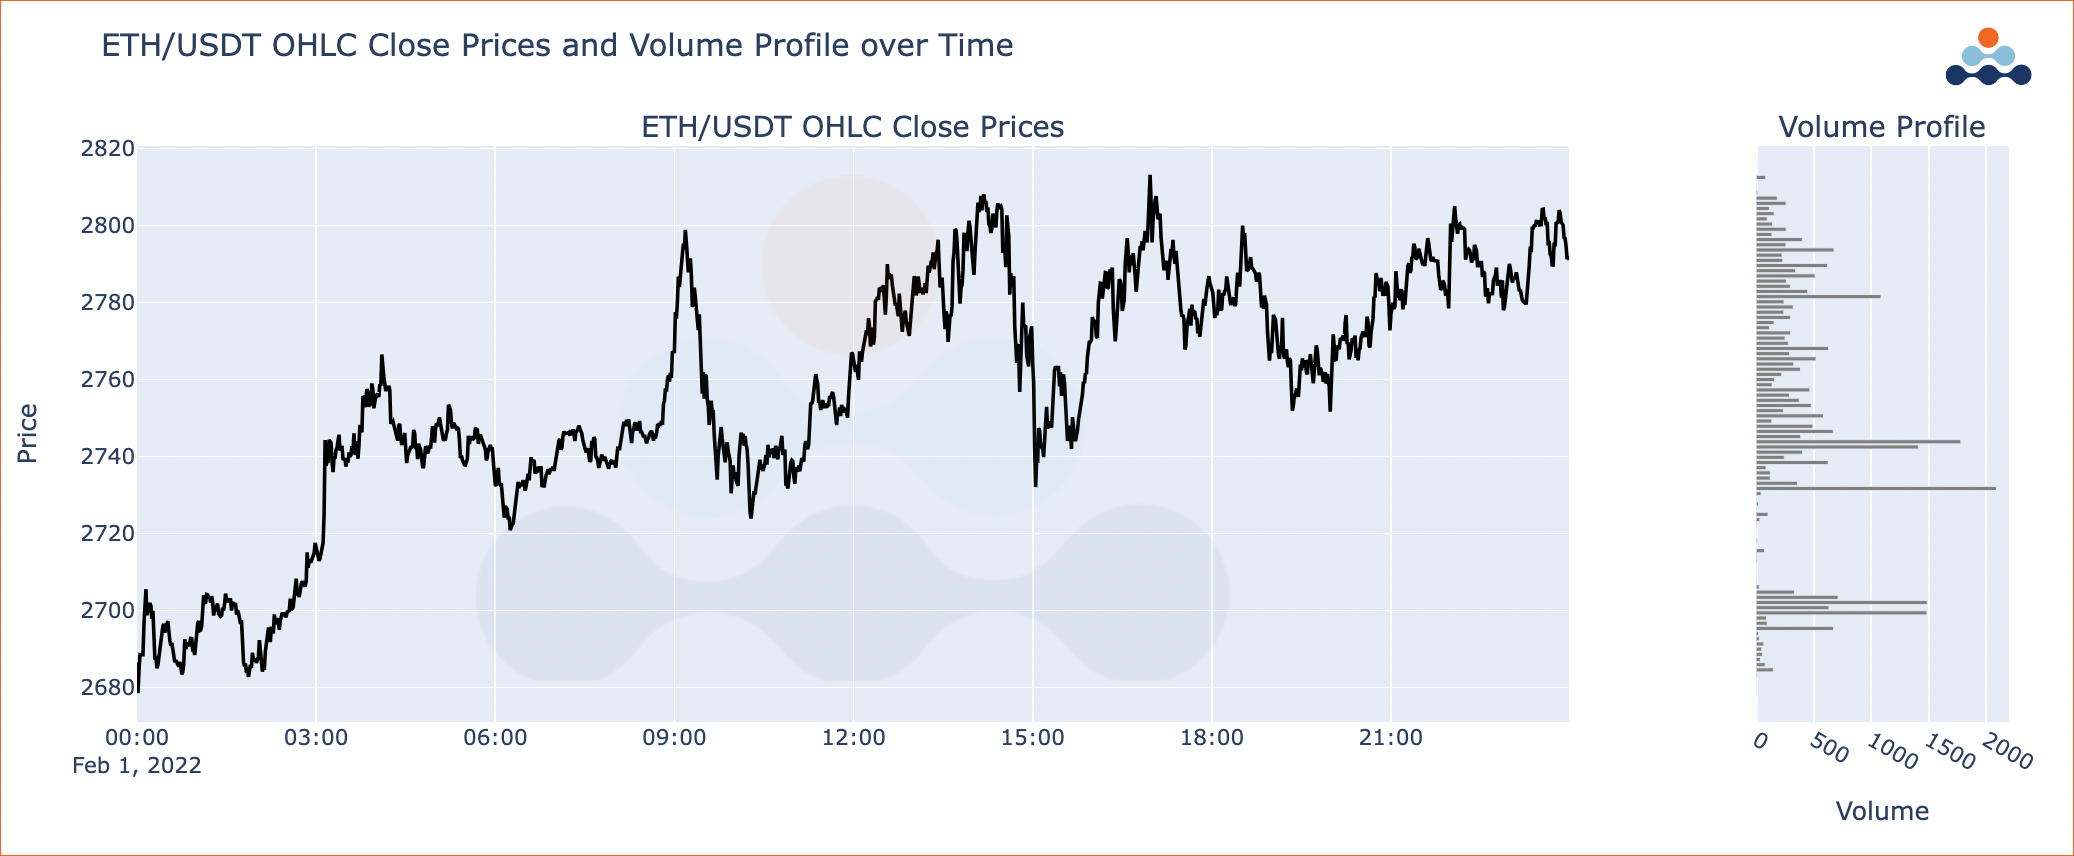
In the chart titled "ETH/USDT OHLC Close Prices and Volume Profile over Time", we utilize a subplot configuration to ETH/USDT close prices against the volume profile. This layout allows us to observe price action and volume distribution simultaneously
In the first subplot, the line graph captures the price movement over time, reflecting the highs and lows, the trends, and the volatility. Traders can use this data to understand how the price of ETH/USDT has changed during the selected period.
The second subplot, on the other hand, presents a volume profile, which showcases how much trading occurred at different price levels. In other words, it provides a horizontal look at the trading volume. This volume profile reveals the price levels where trading was most intense, hinting at potential areas of support and resistance. It complements the price chart by highlighting the price levels most favored by traders, thus offering additional insights that can inform trading decisions. For instance, if the volume profile suggests a concentration of trading at a certain price level, it may act as a support or resistance level in the future.
Analyzing Order Book Imbalance
As part of our deep dive into bid/ask quantities and volume profile, it's also important to consider the order book imbalance. By definition, the order book imbalance is a metric that quantifies the difference between bid and ask quantities. It provides a straightforward indicator of market sentiment, allowing us to gauge whether the market is leaning more toward the buy side (bullish sentiment) or the sell side (bearish sentiment).
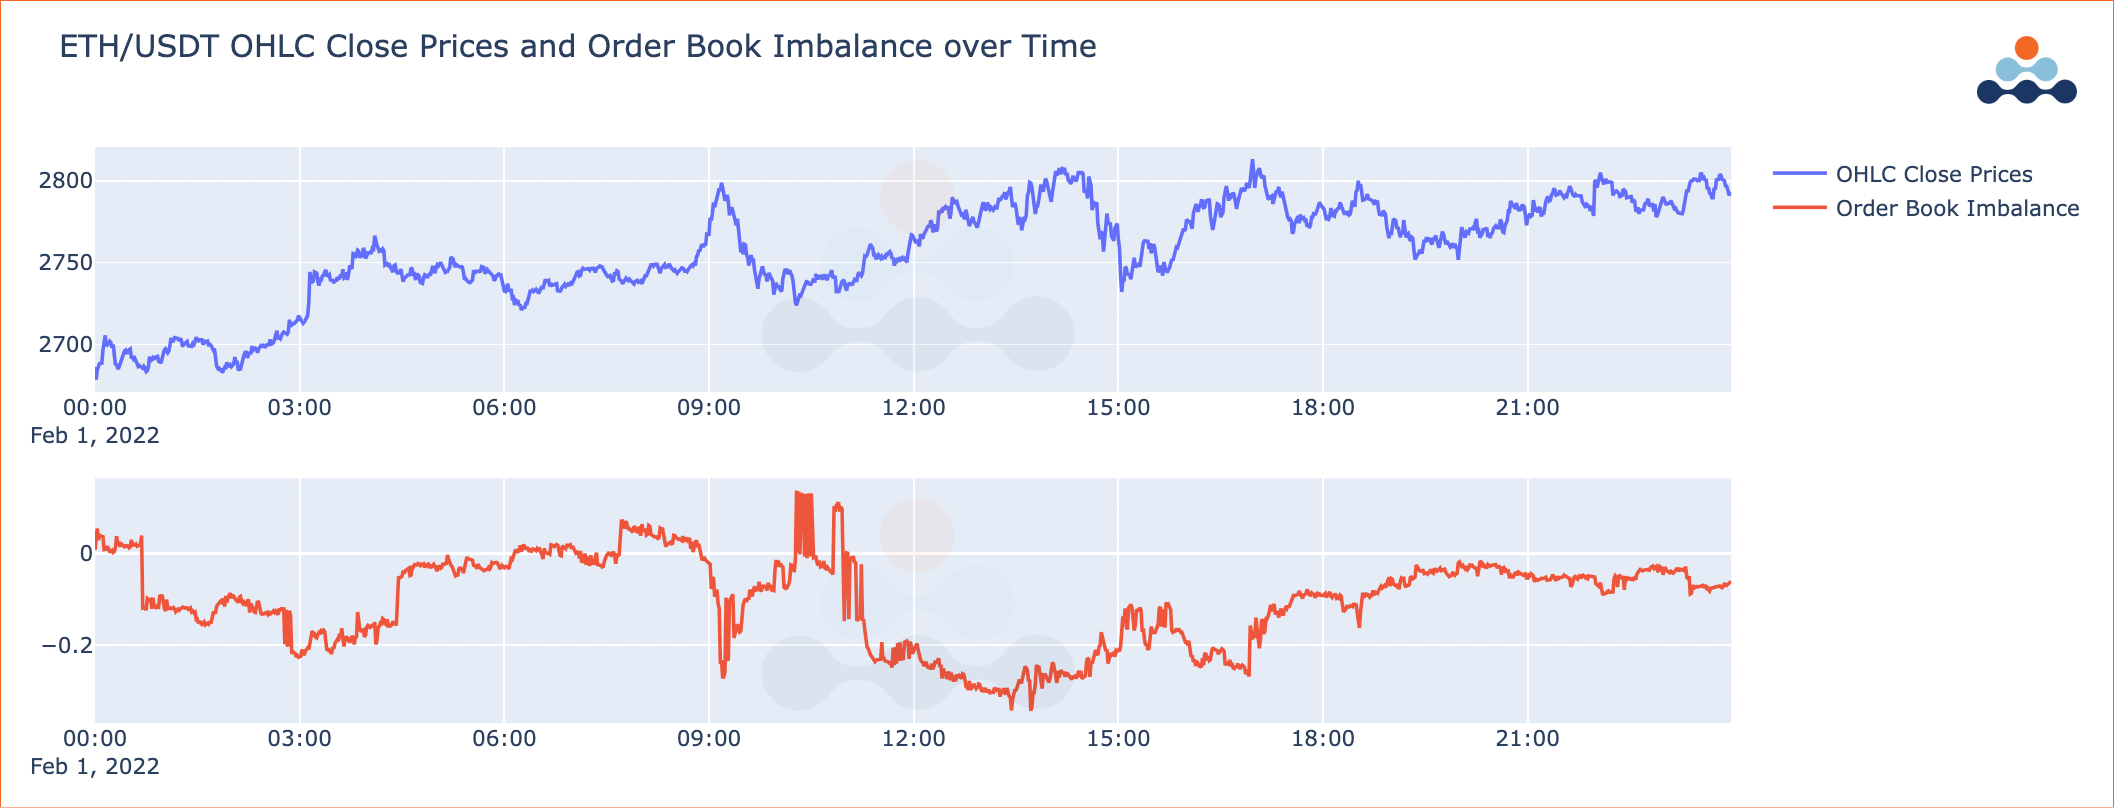
The imbalance is computed using the formula (bid quantity - ask quantity) / (bid quantity + ask quantity). This calculation yields a value between -1 and 1, inclusive. A positive value implies a dominance of bid orders (bullish sentiment), indicating that more traders are willing to buy. On the other hand, a negative value suggests a prevalence of ask orders (bearish sentiment), revealing that more traders are inclined to sell.
Plotting the order book imbalance over time can uncover potential trends and patterns in market sentiment. For example, periods of consistent positive imbalance could correspond to a bullish trend in price, while periods of negative imbalance might signal an upcoming downward price movement. Similarly, sudden changes in imbalance might indicate market reactions to news or events, revealing real-time shifts in sentiment.
By combining this imbalance analysis with our prior research into bid/ask quantities and volume profiles, we can gain a deeper understanding of market dynamics and insights. These insights could then inform better trading decisions, enhancing our strategy's effectiveness.
Conclusion
Understanding the principles of supply and demand is paramount in navigating financial markets, and they manifest through bid/ask quantities and volume profiles. These key components, along with the order book imbalances, can provide insightful clues about market dynamics and potential price movements.
After observing the interplay between bid and ask quantities, traders can anticipate potential shifts in market trends. The volume profiles provided a detailed view of trading activity at various price levels, helping traders identify significant support and resistance levels.
In addition, the order book imbalance provided a quantitative indicator of market sentiment by gauging the difference between bid and ask quantities. This information helps traders confirm signals obtained from bid/ask quantities and volume profiles.
Ultimately, each of these metrics collectively provides a comprehensive understanding of the market, enabling traders to make more informed decisions. They shed light on the intricate market dynamics and enhance trading strategies. However, trading involves risks, and these tools should be utilized as part of a well-rounded strategy. By using these tools effectively, traders can improve their market predictions and trading outcomes.
To learn more about Amberdata, please contact us to book a demo, hear how our products can help your business, or receive pricing information.
