Share this blog:
The constant and changing cryptocurrency markets bring both opportunities and hurdles for traders. The 24/7 nature of crypto trading is an important differentiator over many traditional trading markets, and some crypto traders believe that trading between market hours can generate alpha. In this report, we will quantify these trading dynamics through an analysis of BTC/USDT trading on Binance. We examine trading volume and volatility across multiple regions to determine whether cryptocurrency traders in specific time zones benefit from trading in other active market times.
The regions we compare, and the market hours for those regions, are listed below:
|
Region |
Timezone |
Start Time |
End Time |
|
U.S. |
Eastern |
9:30 am |
4:00 pm |
|
London (LSE, EU) |
Greenwich Mean Time |
8:00 am |
4:30 pm |
|
Frankfurt (FSE, EU) |
Central European |
9:00 am |
5:30 pm |
|
Asia |
Hong Kong |
9:30 am |
4:00 pm |
|
Japan |
Tokyo |
9:00 am |
3:00 pm |
|
India |
Mumbai |
9:15 am |
3:30 pm |
Volatility Between Regions
We used the standard deviation of returns as a proxy for volatility and compared trades occurring within and outside of their respective market trading hours across each region. The limitations of this analysis include the diversity of each region’s approach, their general adoption of cryptocurrencies, and the crossover of hours between regions. However, our methodology does not attempt to isolate trading to these regions and merely identifies differences between them for potential trading opportunities. This analysis also only examines trades on the BTC/USDT pair on Binance, so there is likely to be variability when using different exchanges or trading pairs. Diligent traders should perform their own analysis using Amberdata to get a comprehensive understanding of risk or reward.
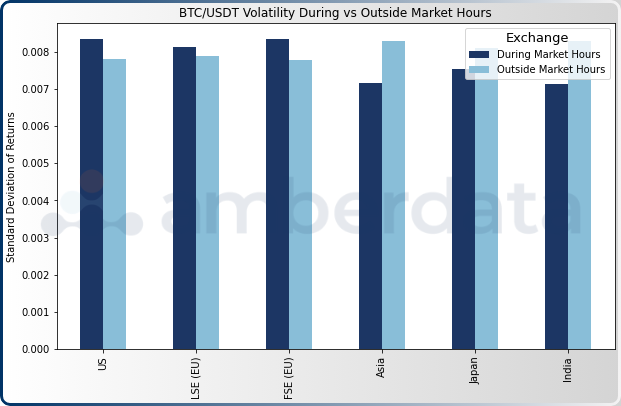
The standard deviation of returns for BTC/USDT trades on Binance between 1/1/2018 and 10/31/2023.
First, we compared BTC/USDT volatility during trading hours and outside of trading hours. The United States and EU markets tend to have higher volatility during market hours, potentially due to higher trading activity. In contrast, Asian markets tend to have higher volatility outside market hours. Interestingly, the US and EU show similar volatility patterns despite their 4-hour time difference, and Asian markets such as Japan and India have similar volatility patterns with a 3.5-hour time difference. Japan’s time difference to the U.S. (EST) is 13 hours, while India has a 5.5-hour difference with GMT. There is a high variation between India and the EU markets, which shows that traders in these two regions can take advantage of higher volatility during US hours. This also illustrates how US traders can avoid volatility by trading during Asian hours.
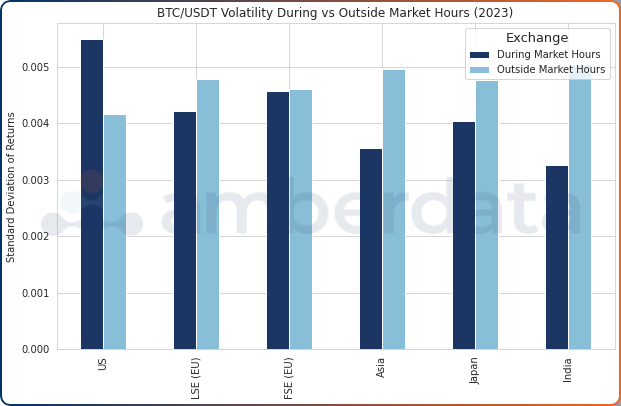
The standard deviation of returns for BTC/USDT trades on Binance between 1/1/2023 and 10/31/2023.
Although 2023 had much lower trading volumes than previous years, the influence of the United States trading market on volatility is clear, as it is the only region with a higher standard deviation of returns. Asian markets also had far lower volatility during market hours.
Hourly Trading Volume
From our high-level analysis of volatility, we can see how trading activity changed over time. Hourly activity gives far more insights into the regional influences on trading volume and for trading focused on using volatility as an indicator of when to trade, high volatility often goes hand-in-hand with liquidity.
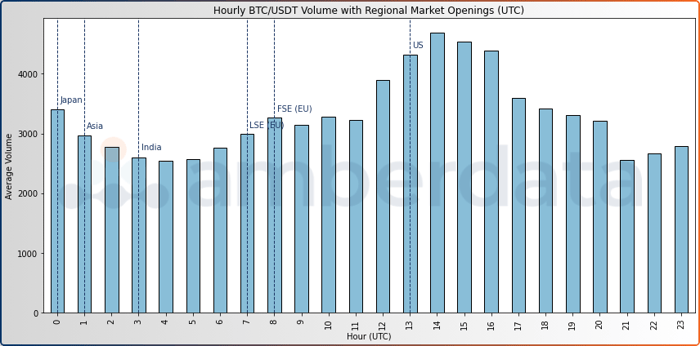
Average hourly trading volume for BTC/USDT trades on Binance between 1/1/2018 and 10/31/2023.
The EU regions begin trading at 07:00 (Frankfurt) and 08:00 (London) UTC, which initiates the gradual climb in trading volume. At 13:00 UTC, the U.S. trading opens and adds additional market volume until the EU market hours close and volumes begin to decline. At 21:00 UTC, volumes begin to climb through 00:00 UTC. Market volumes decline during Asian trading windows until the low hour of 04:00 when they start to slowly climb in anticipation of the EU region's market opening. Some hour overlaps between the EU region and Asia are likely contributors to the 07:00 UTC climb in trading volumes.
The lowest global trading volumes appear during the early hours 02:00 - 06:00 UTC, and the late night hours 21:00 - 23:00 UTC.
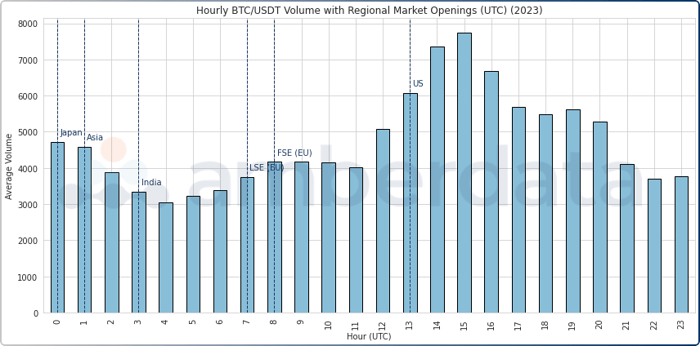
The standard deviation of returns for BTC/USDT trades on Binance between 1/1/2023 and 10/31/2023.
Isolating 2023, we see very similar trading window patterns with the market climbing during later EU trading hours through to the US trading hours overlapping with peak volume during 15:00 UTC.
As we expected from our initial volatility analysis, trading volumes are not evenly distributed across the day. There is a significant difference in trading volumes during Asian hours and US hours, and leveraging these patterns to better understand liquidity and potential market shifts can inform trading strategies.
Hourly Average Returns
Expanding upon the hourly trading volume dispersions, we can examine how profits and risks are tied to various trading windows. The average hourly return is calculated as the difference between the closing price for BTC/USDT within the hour and the hour prior.
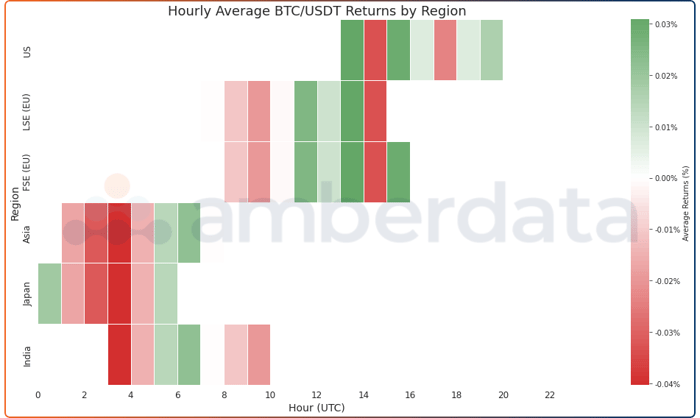
Average hourly returns for BTC/USDT trades on Binance between 1/1/2018 and 10/31/2023.
During the last few hours of EU trading, returns begin to correlate with increasing volumes and peak during the first hours of US trading. In addition to higher trading volatility and volumes, U.S. trading hours also see a concentration of positive returns during these hours compared to other regions. On average, the U.S. saw only two of eight trading hours return negatively, whereas the EU regions had three of eight hours return negatively, and Asian hours had four negative return hours.
External factors can certainly play a role in these conclusions, especially considering the extremely negative events of 2022, when the crypto bear market saw several exchanges, prominent hedge funds, and market makers collapse due to declining asset prices and reduced trading volumes.
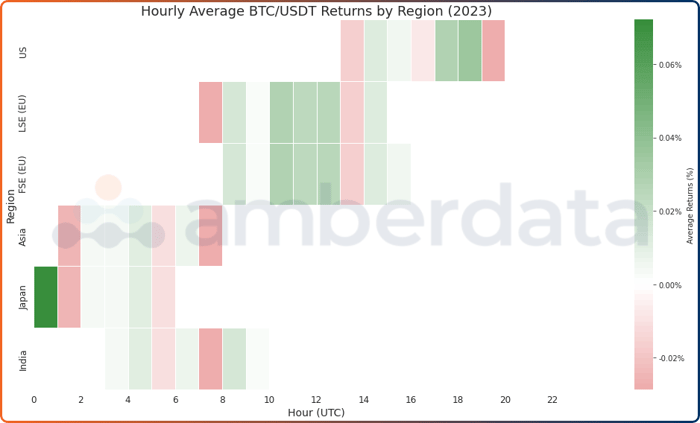
Average hourly returns for BTC/USDT trades on Binance between 1/1/2023 and 10/31/2023.
2023 shows us an interesting story. While average returns between 2018 and 2023 were highest during US trading hours, EU trading hours saw the best correlation of positive returns. Asia still faced the worst market hour performance, but despite having fairly average trading volumes, the start of Japan’s market window (00:00 UTC) was by far the highest positive return hour in the day.
Cumulative Log Returns
Extending the hourly data even further, we can make further conclusions on overall region performance by looking at the cumulative log returns. Log returns standardize comparisons across regions and can be added over time to provide a cumulative return over an extended period, as opposed to standard returns which do not provide the ability to compare and accumulate over time. Cumulative log returns are simply the sum of log returns over a timeframe and allow traders to better understand market trends to adjust or develop trading strategies to match current market conditions in various regions.
Cumulative log returns for BTC/USDT trades on Binance between 1/1/2018 and 10/31/2023.
Negative total log returns in Asian markets may be a reflection of market dynamics or external factors affecting trading in these markets, though they generally had lower volatility and trading volumes than the other regions. Asian markets have also made large strides in regulations over the last year, which is likely to spur trading and opportunities across all markets. In the U.S. and Europe, positive total log returns point to favorable trading times and better outcomes with a potential advantage trading during the first hour of London’s trading window for strategies relying on lower volatility or trading stability given the region's neutral performance.
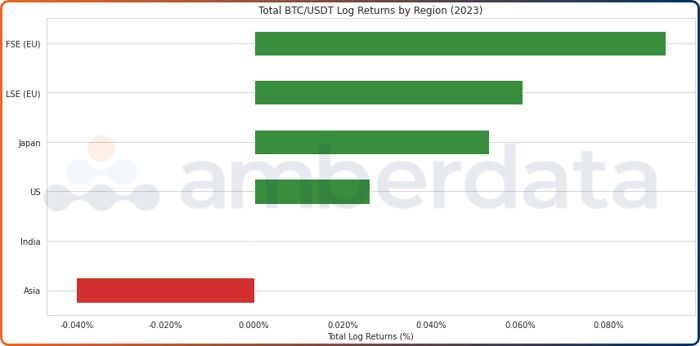
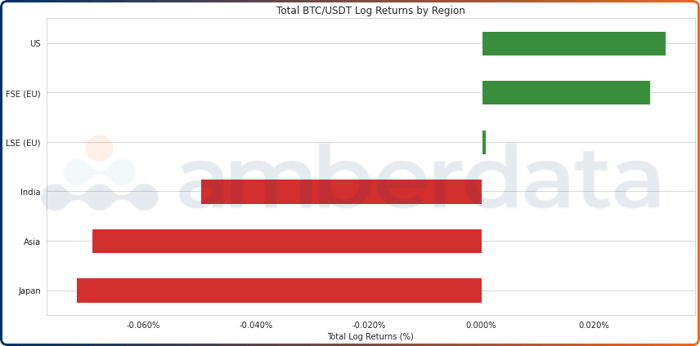
Cumulative log returns for BTC/USDT trades on Binance between 1/1/2023 and 10/31/2023.
Surprisingly, 2023 was a net positive year for all regions except for Central Asia, which was the only area that faced negative cumulative returns. India’s cumulative returns were neutral throughout the year, which could point to an advantageous trading window for neutral strategies and low trading volatility. 2023’s growth came with several stops and starts but was recently nudged forward by rumors of Bitcoin spot ETFs and overcame the year’s earlier flat price trends.
Hourly Garman-Klass Volatility
An alternative approach to standard volatility is the Garman-Klass (1980) range-based measurement which provides a measure for high and low volatility. In this case, we look at hourly volatility and compare this to the daily average Garman-Klass volatility (GK), and 1 standard deviation (high volatility is denoted at >1 standard deviation from GK and low volatility is <1 GK).
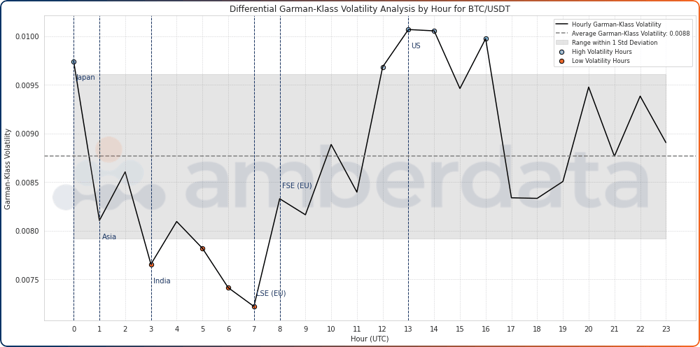
Hourly Garman-Klass volatility and ranges for BTC/USDT trades on Binance between 1/1/2018 and 10/31/2023.
Looking at BTC/USDT trading on Binance between 2018 and October 31, 2023, the start-to-market trading in every region appears to have the biggest influence on the subsequent hour’s trading. The start of Asia, India, and London market hours tended to lead to an increase in volatility, while the start of Japan and Frankfurt market hours usually led to a decrease in trading volatility the next hour.
Notably high volatility hours were 00:00, 12:00, 13:00, 14:00, and 17:00 UTC, with four of the five peaks being around US trading hours. These hours represent key times for traders aiming to exploit high-volatility changes. Notably low volatility hours were 03:00, 05:00, 06:00, and 07:00 UTC, all within the India trading hours and reversing course with the London market open.
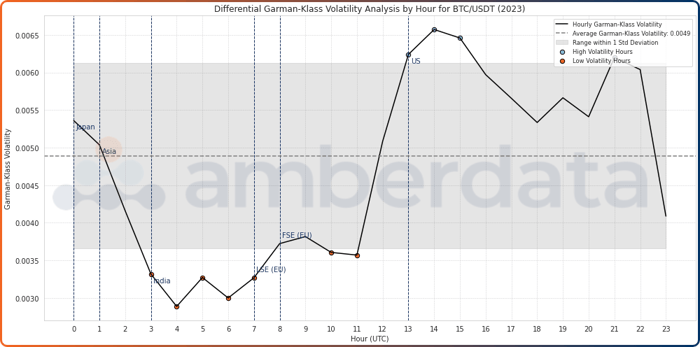
Hourly Garman-Klass volatility and ranges for BTC/USDT trades on Binance between 1/1/2023 and 10/31/2023.
The Garman-Klass volatility during 2023 paints an interesting picture for comparison. Low volatility was concentrated during Indian market hours and early EU hours, while high volatility was concentrated during US trading hours. Trading in 2023 was far less volatile with an average Garman-Klass volatility of 0.0088 in 2018 nearly dropping in half to 0.0049 in 2023.
Conclusion
The global nature of crypto shows us that trading is extremely dynamic, and regional differences can make a significant variance in returns. Compared to Asian markets, volatility patterns in the US and EU show that trading during hours of overlap can provide traders with higher volatility and liquidity, whereas Asian markets can provide traders with lower volatility and higher stability. Moreover, the Garman-Klass Volatility analysis accentuates the effect of regional market activities on intraday volatility, particularly highlighting the influence of the US market.
These volatility dynamics are further emphasized considering the effects that 2023 had on longer-term volatility analyses. With 2023 showing higher-than-average trading volumes compared to 2018-2022 average trading volumes, 2023 also had lower volatility and more dramatic returns. The rapid shifts in market dynamics in crypto require a continuous eye for more signs of potential opportunities.
These findings offer a lens into the global trading dynamics of cryptocurrency markets on Binance. Navigating market trading hour volatility dispersion and regional rhythms is instrumental for traders and investors to properly develop strategies and make informed decisions.
References
This Jupyter Notebook includes all the necessary code and comments to help you understand how the data was collected, the analysis performed, and how the visualizations were created. Feel free to explore, modify, and use this code as a basis for your investigations.
