Share this blog:
.png)
Inflation remains sticky, the Fed is not cutting rates, and yields are rising. This creates a genuinely difficult backdrop for risk assets, one that predates the current crisis. An inflation shock is still 3-4 weeks away, with agriculture, shipping, and manufacturing facing months of elevated input costs as the supply chain absorbs it.
Within crypto, a short squeeze is underway, which can move the price but mechanical short covering is not a regime change.
|
KEY TAKEAWAYS |
|
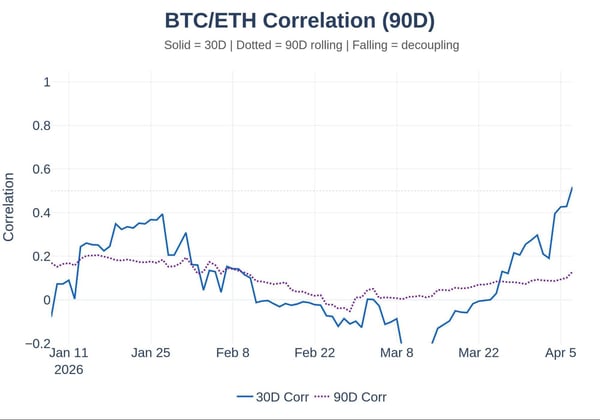
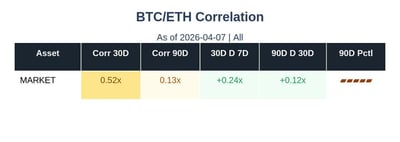
1. Market
|
KEY TAKEAWAYS |
|
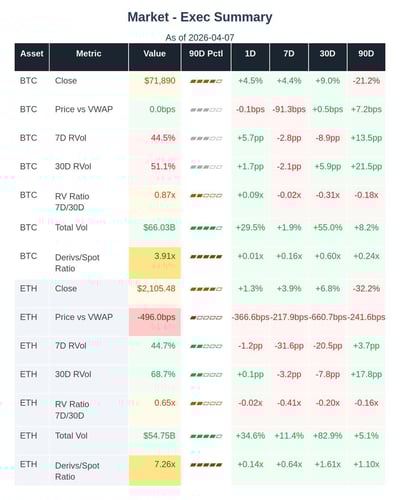
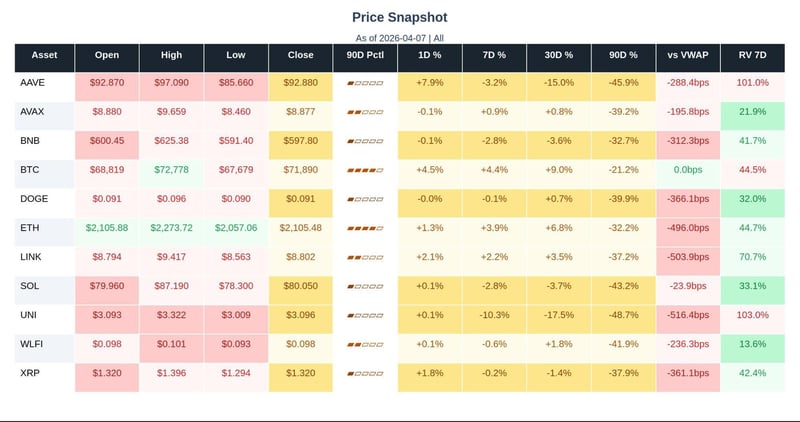
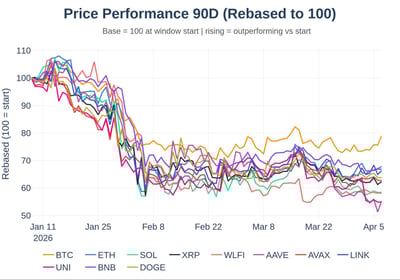
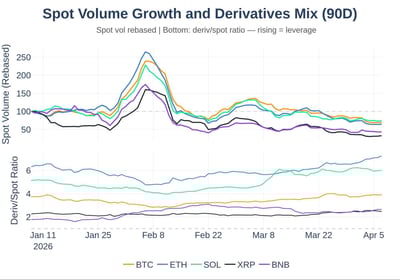
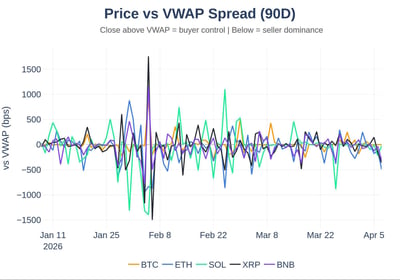
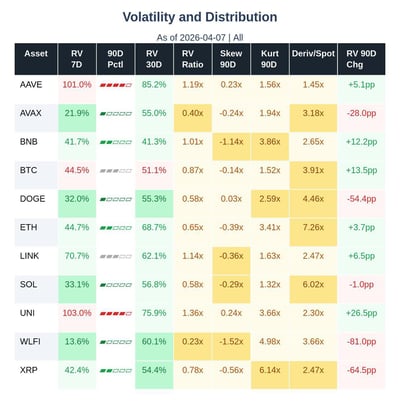
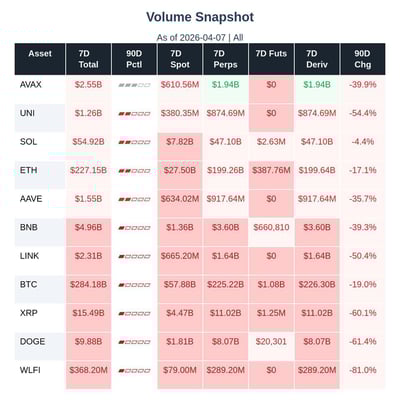
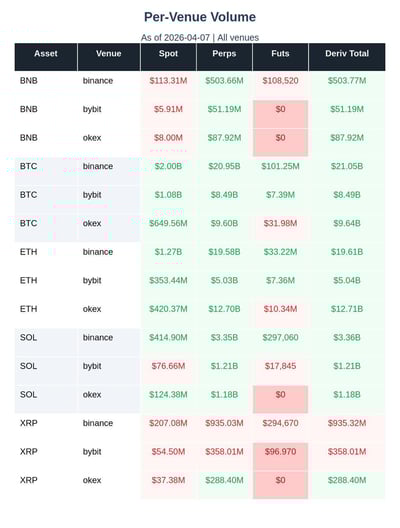
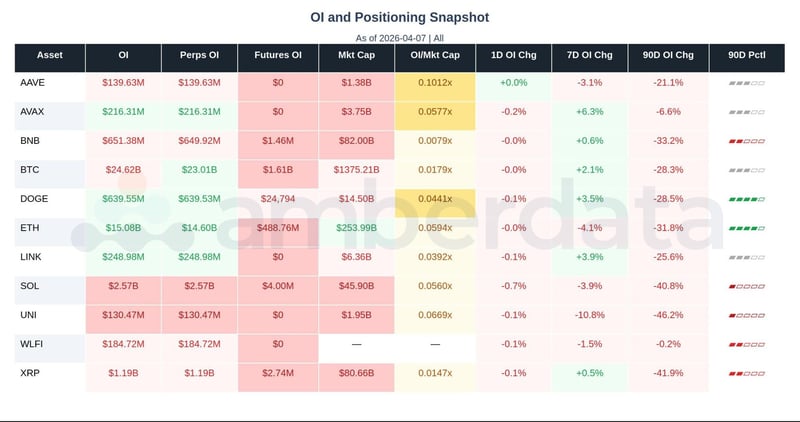
Prices are near multi-month lows: SOL (9th percentile), XRP (6th), AAVE (1st), and UNI (90-day low) are at the bottom of their 90-day ranges; BTC at the 65th percentile is the only major asset holding ground. ETH's VWAP spread at -496 bps (9th percentile) signals persistent late-session selling. Derivatives-to-spot ratios run elevated (ETH 7.26x, SOL 6.02x, both above the 75th percentile) against spot volumes at or below the 25th percentile across the board.
CHARTS
DETAIL TABLES
2. Liquidity
|
KEY TAKEAWAYS |
|
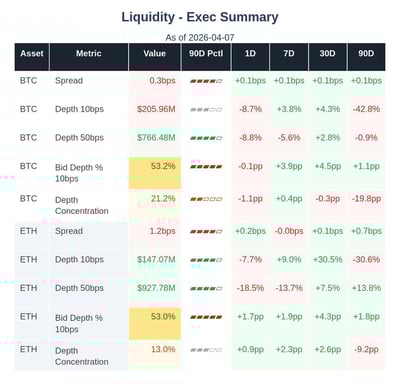
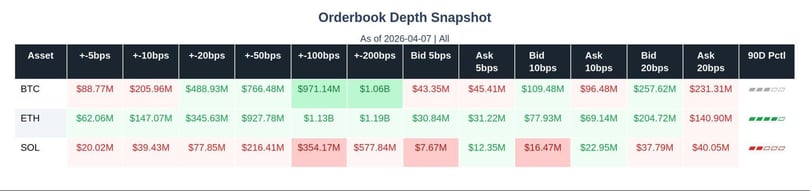
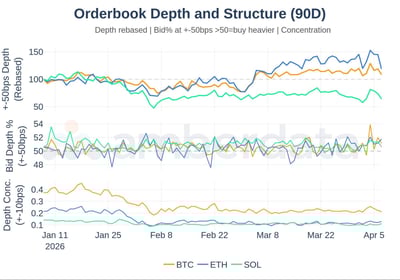
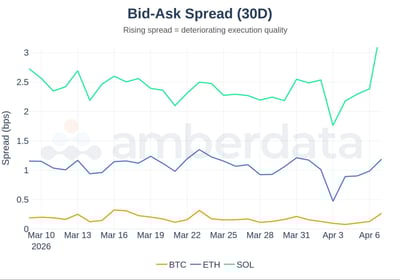
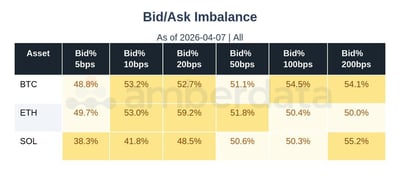
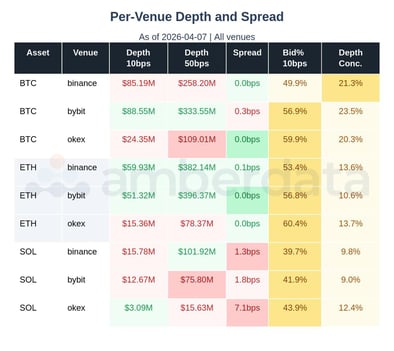
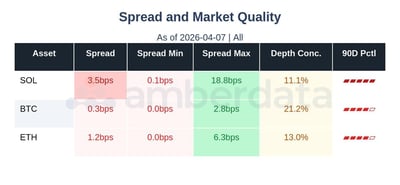
BTC bid/ask imbalance at the 98th percentile and ETH at a 90-day high. Mean buy-side depth dominates both books, a constructive signal that conflicts with the price picture. Spreads are elevated: SOL at 98th percentile (3.5 bps), BTC at 89th percentile (0.3 bps). BTC's depth concentration at the 25th percentile (21.2%) is the hidden risk: depth is fragmented, not stacked near mid.
CHARTS
DETAIL TABLES
3. Rates
|
KEY TAKEAWAYS |
|
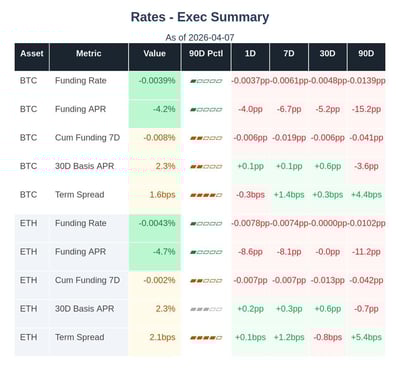
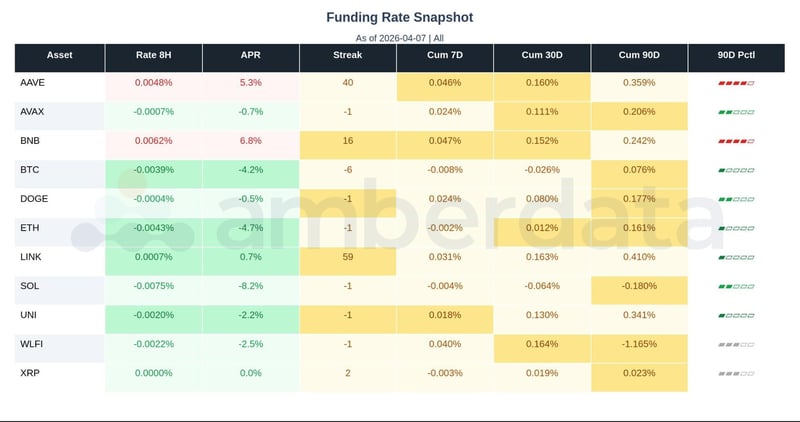
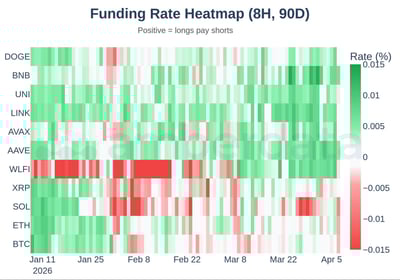
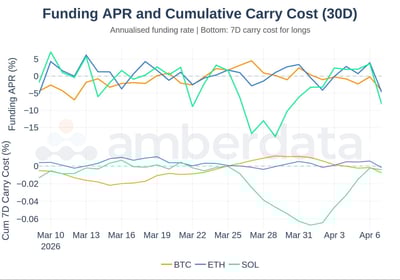
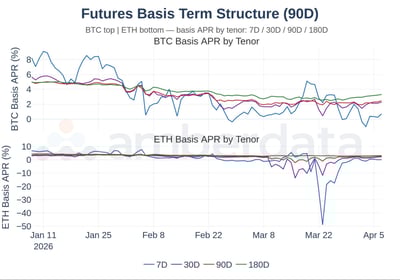
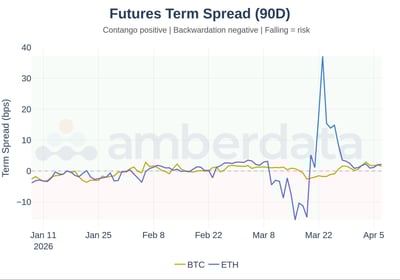
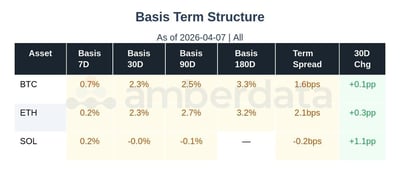
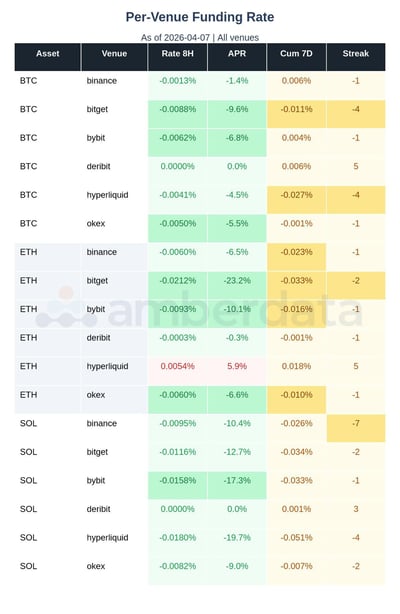
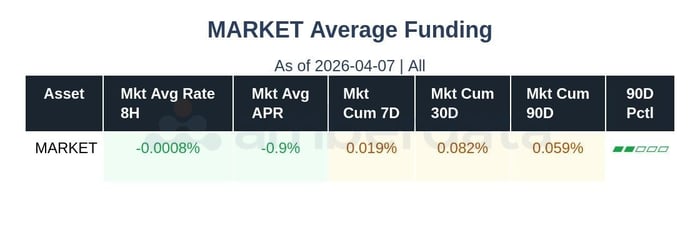
Funding rates are deeply negative across the majors: BTC at -4.2% APR (7th percentile), ETH at -4.7% (4th percentile), SOL at -8.2% (17th percentile), with the market aggregate at -0.9% APR (19th percentile). Shorts pay a daily carry cost that historically resolves via covering rather than sustained downside. Basis is compressed: BTC at 2.3% APR (37th percentile), with BNB the lone exception at +6.8% (87th percentile).
CHARTS
DETAIL TABLES
4. Positioning
|
KEY TAKEAWAYS |
|
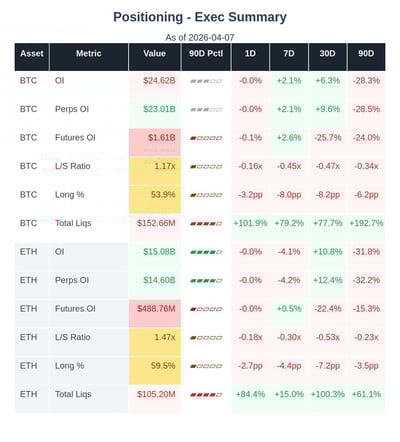
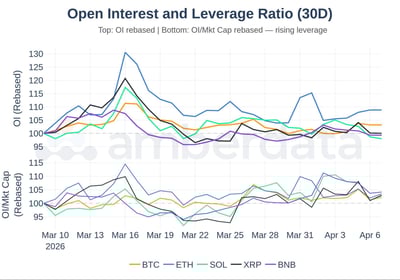
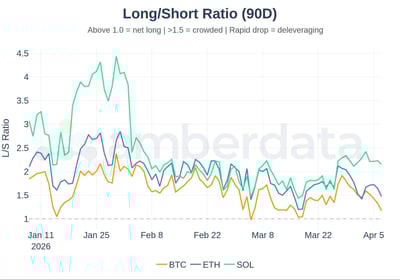
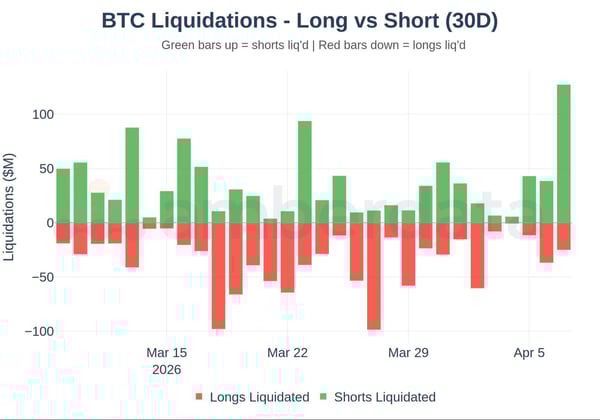
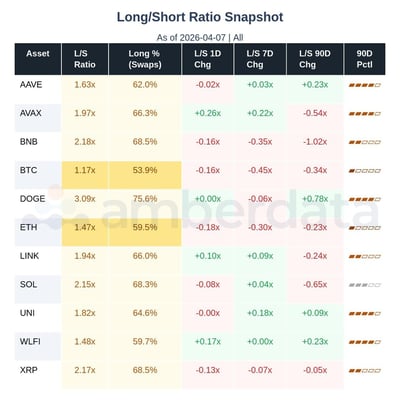
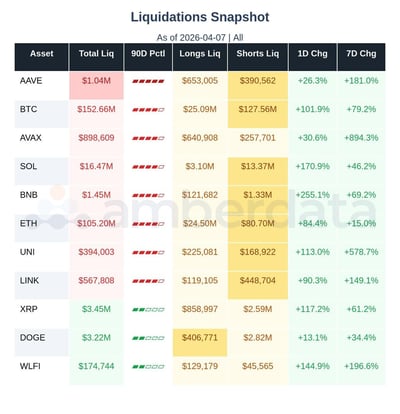
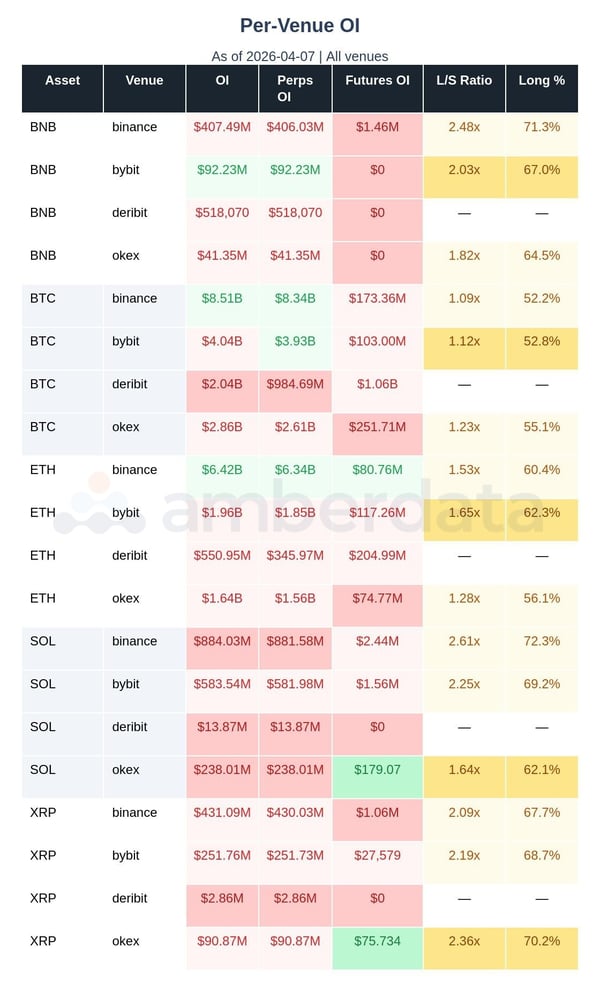
Open interest is broadly depressed: BTC at the 49th percentile, ETH at the 60th, SOL at the 6th. The liquidation breakdown is unambiguous: BTC saw $127.9M in short closures vs $25.1M in longs, ETH $82.6M shorts vs $24.5M longs - a short squeeze, not a long capitulation. Long/short ratios for BTC (1.17x, 4th percentile) and ETH (1.47x, 6th percentile) near their 90-day lows confirm net positioning is not crowded long.
CHARTS
DETAIL TABLES
5. ETF Flows
|
KEY TAKEAWAYS |
|
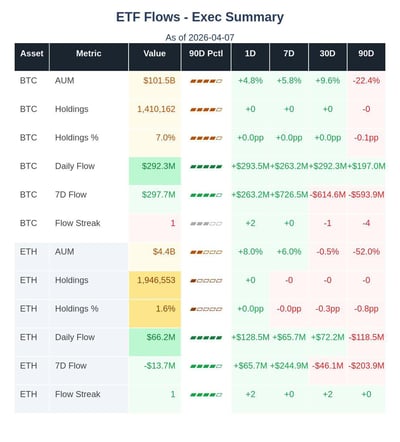
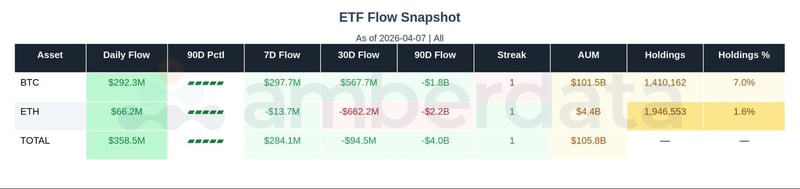
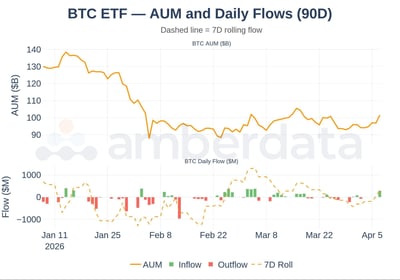
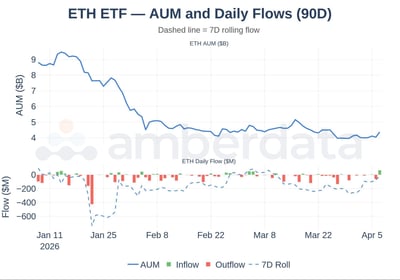
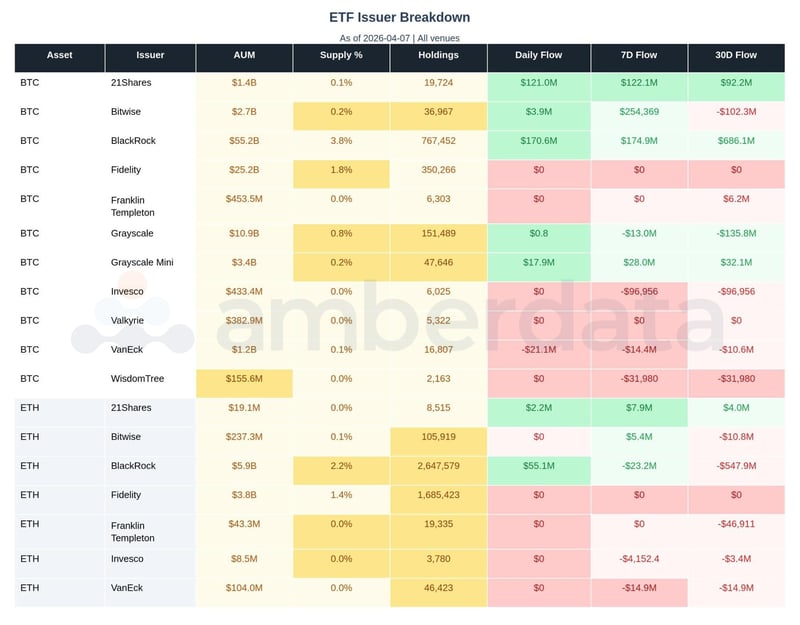
Daily inflows were strong: BTC $292M (92nd percentile) and ETH $66M (90-day high). The 7-day context matters: BTC's cumulative 7-day flow is only $298M (25th percentile) and ETH's is -$13.67M, confirming today's print reverses a negative weekly trend rather than extending one. BTC ETF holdings at 7.0% of supply (75th percentile) constrain float; ETH's 1.6% (25th percentile) reflects sustained institutional underweighting.
CHARTS
DETAIL TABLES
6. Stablecoin
|
KEY TAKEAWAYS |
|
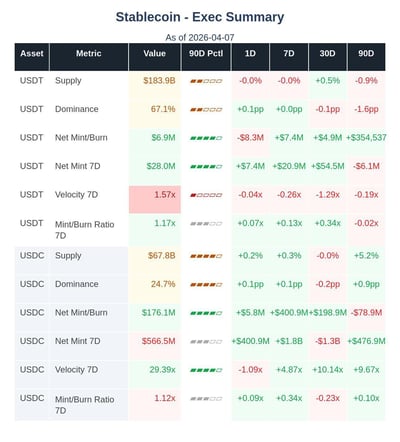
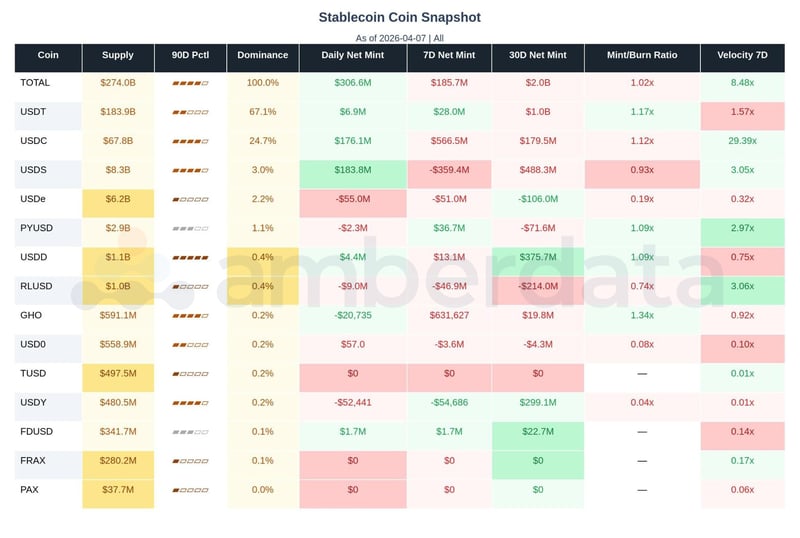
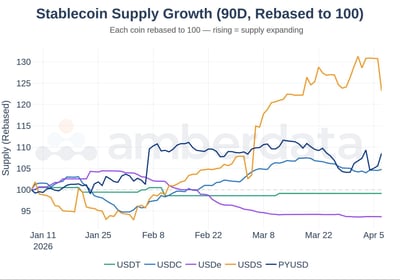
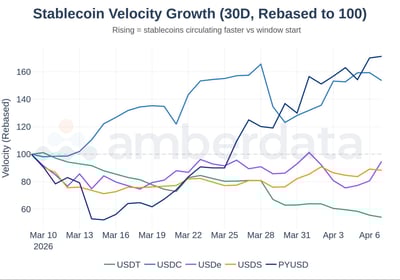
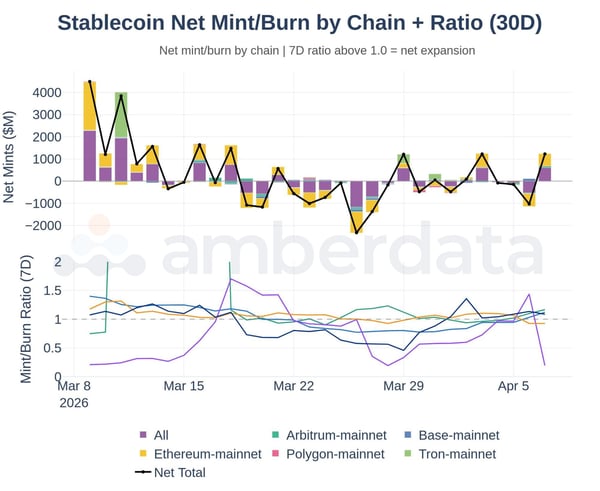
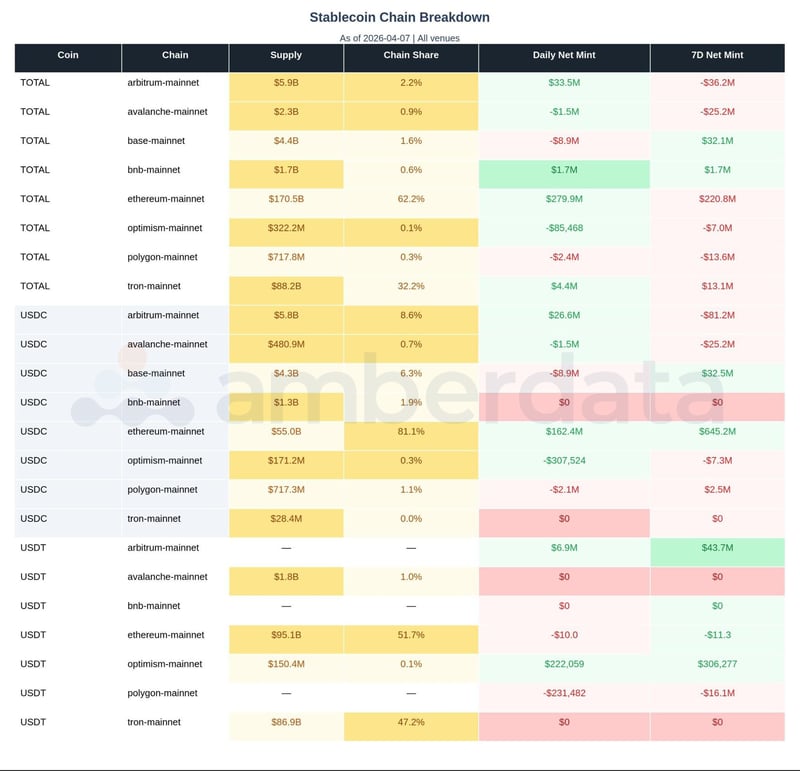
USDC leads: $566M 7-day net minting (75th percentile) with velocity at 29.39x (80th percentile) - supply is being actively deployed. USDT shows the inverse: $28M net mint and velocity at 1.57x (90-day low) despite $183.94B in supply, consistent with risk-off hoarding. USDe contracts at -$55M daily, mint/burn ratio 0.19x (3rd percentile), as DeFi carry positions unwind.
CHARTS
DETAIL TABLES
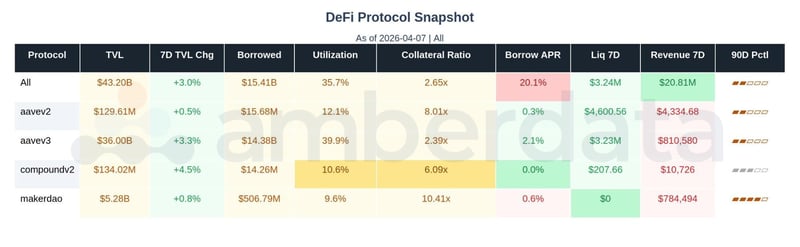
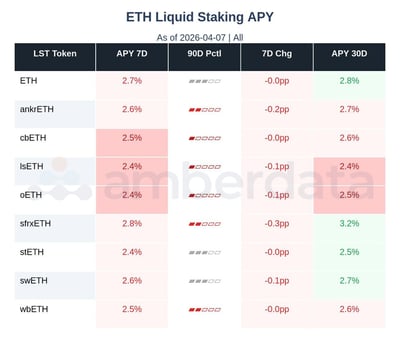
7. DeFi Lending
|
KEY TAKEAWAYS |
|
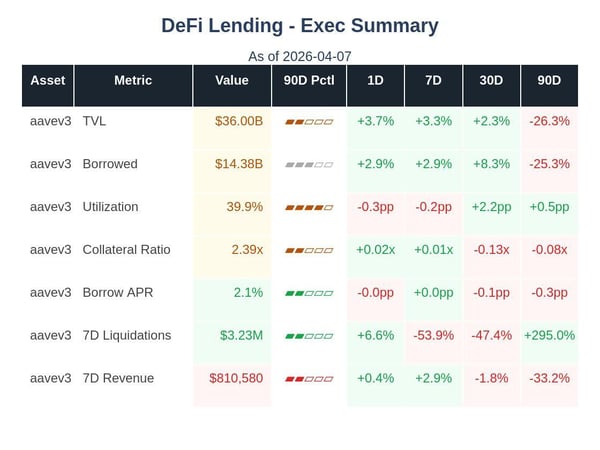
ETH base APY sits at 2.7% (38th percentile), with validator growth compressing yields toward the 2.5-3.0% band. sfrxETH leads at 2.9-3.2% while cbETH, lsETH, and oETH are at 90-day lows. With ETH perpetual funding at -4.7% APR, the leveraged-staking carry trade is likely under pressure.
CHARTS
DETAIL TABLES
Full-Market Research. Institutional Depth. Derivatives, ETFs, on-chain, DEXs, microstructure, risk signals - and more. Subscribe at the bottom of our page for research that covers every corner of crypto and visit Amberdata Research.
Access Amberdata Intelligence for institutional-grade digital asset intelligence, or contact our team to discuss custom solutions.
Links & Resources
Platform
Recommended next reads
ETF Cost Basis Series
- Part 1/3: The $80,000 Floor (ETF Cost Basis)
- Part 2/3: Who Breaks First (ETF Cost Basis)
- Part 3/3: The Stress Test (ETF Cost Basis)
More key reads
- The ETF Exodus Decoded: Basis Arbitrage, Not Capitulation
- Bitcoin's Great Rotation: Who Bought the Dip and Why It Matters
- October 2025 Crash (7 charts): How $3.21B Vanished in 60 Seconds
- Beyond the Spread: Market Impact and Execution
Disclaimers
The information contained in this report is provided by Amberdata solely for educational and informational purposes. The contents of this report should not be construed as financial, investment, legal, tax, or any other form of professional advice. Amberdata does not provide personalized recommendations; any opinions or suggestions expressed in this report are for general informational purposes only.
Although Amberdata has made every effort to ensure the accuracy and completeness of the information provided, it cannot be held responsible for any errors, omissions, inaccuracies, or outdated information. Market conditions, regulations, and laws are subject to change, and readers should perform their own research and consult with a qualified professional before making any financial decisions or taking any actions based on the information provided in this report.
Past performance is not indicative of future results, and any investments discussed or mentioned in this report may not be suitable for all individuals or circumstances. Investing involves risks, and the value of investments can go up or down. Amberdata disclaims any liability for any loss or damage that may arise from the use of, or reliance on, the information contained in this report.
By accessing and using the information provided in this report, you agree to indemnify and hold harmless Amberdata, its affiliates, and their respective officers, directors, employees, and agents from and against any and all claims, losses, liabilities, damages, or expenses (including reasonable attorney's fees) arising from your use of or reliance on the information contained herein.
Copyright © 2026 Amberdata. All rights reserved.