


Share this blog:
.png)
Why ATM IV Is the Floor, Not the Forecast: Reading Level, Rank, Shape, and the Surface in Coordination
|
KEY TAKEAWAYS |
|
Implied vol is solved-for, not forecast. ATM IV is the volatility input that makes Black-Scholes match the observed option price. It is the consensus risk-transfer price for variance, weighted by capital. Calling it the market's prediction obscures more than it reveals. That distinction is why IV can sit above realized for years and why the right comparison is rank against its own history, not level against subsequent RV. BTC 30D ATM IV is 37.6%, sitting in the 12th percentile of its 90-day distribution. ETH 30D ATM IV is 50.5%, in the 1st percentile. The absolute levels read like average vol. The percentile context says vol is at a regime low for both assets. The killer insight is that the 20-40 percentile band has historically produced the fastest forward vol moves in BTC, not the extremes. Quiet vol is dangerous vol. IV rank and IV percentile measure different things. IV rank places current IV linearly between window high and low. IV percentile measures the fraction of days in the window when IV was lower. When the distribution is skewed (which it usually is), the two diverge. BTC IVR 30D at 0.28 with IVP 30D at 0.38 is a fourteen-point gap that tells you the distribution has long left tails and fat right tails. Term richness below 1.0 is the curve telling you something. BTC term richness at 0.94 and ETH term richness at 0.90 both sit in the 19th percentile of their respective 90D distributions. The curve is flatter than usual, with front-end vol bid relative to back-end. That is the signature of event premium in the near tenors. The market is paying for near-dated protection while back-dated vol sits at structural lows. |
This is the third piece in The Vol Stack, a 10-part series unpacking how to read crypto options markets layer by layer. Each piece anchors to live data from the Amberdata Options & Macro Weekly Report and Amberdata Intelligence.
BTC 30-day at-the-money implied volatility is 37.6%. The realized 30-day is 28.6%. The market is pricing roughly 9 vol points of premium above what just printed. Is that fair, rich, or cheap? The level alone does not say. The 90-day distribution does. BTC IV sits in the 12th percentile of its trailing-90-day range. ETH IV sits in the 1st. Two assets, one signal: implied vol has compressed to a regime low while spot has fallen 5.8% to 9.0% on the week. That combination is informative, but only if you read the surface across three dimensions, not one.
What IV actually is.
Implied volatility is not a forecast. It is a solved-for number. The Black-Scholes pricing model takes five inputs (spot, strike, time to expiry, interest rate, and volatility) and produces an option price. Four of those inputs are observable. The fifth, volatility, is the input that has to be solved-for to make the model match the market price. Implied vol is whatever number a calculator has to plug into Black-Scholes to reproduce the observed option price.
That distinction matters. "IV at 38%" does not mean the market expects 38% realized vol over the next 30 days. It means the average market participant, weighted by trading capital, is willing to lay 38 vol points of premium to be on either side of the variance bet. Some of those participants are dealers laying off inventory. Some are insurance buyers paying for tail protection. Some are systematic vol sellers harvesting premium. The price is a weighted consensus of their willingness to transact, not a probability-weighted forecast of the underlying process.
The implication is structural. Implied vol can persist above realized vol for years because the population paying for variance protection is willing to pay more than the population delivering it would charge in a frictionless market. The variance risk premium (Post 5) is the structural compensation for taking the other side. Treating IV as a forecast leads to repeated confusion when realized prints below implied: the reader concludes the market was "wrong," when the market was simply pricing the risk-transfer cost, not predicting the outcome.
The right reference frame for IV is its own history, not subsequent realized. The question to ask is not "will IV match RV." The question is "where does today's IV sit in the distribution of past IV readings." That is the rank question, and it is the question this post is built around.
One practical consequence of getting this distinction wrong shows up in how traders frame vol mispricing. "IV is too high, sell vol" makes sense only if the comparison is against the rank distribution. The same level can be regime-rich on one read (high IVR) and regime-cheap on another (low term richness). The level alone supports neither call. Reading IV through the lens of "forecast versus realized" produces repeated whipsaws on the variance trade because the framing is wrong. Reading IV through the lens of "rank, shape, and surface" produces a structural read that holds across regimes.
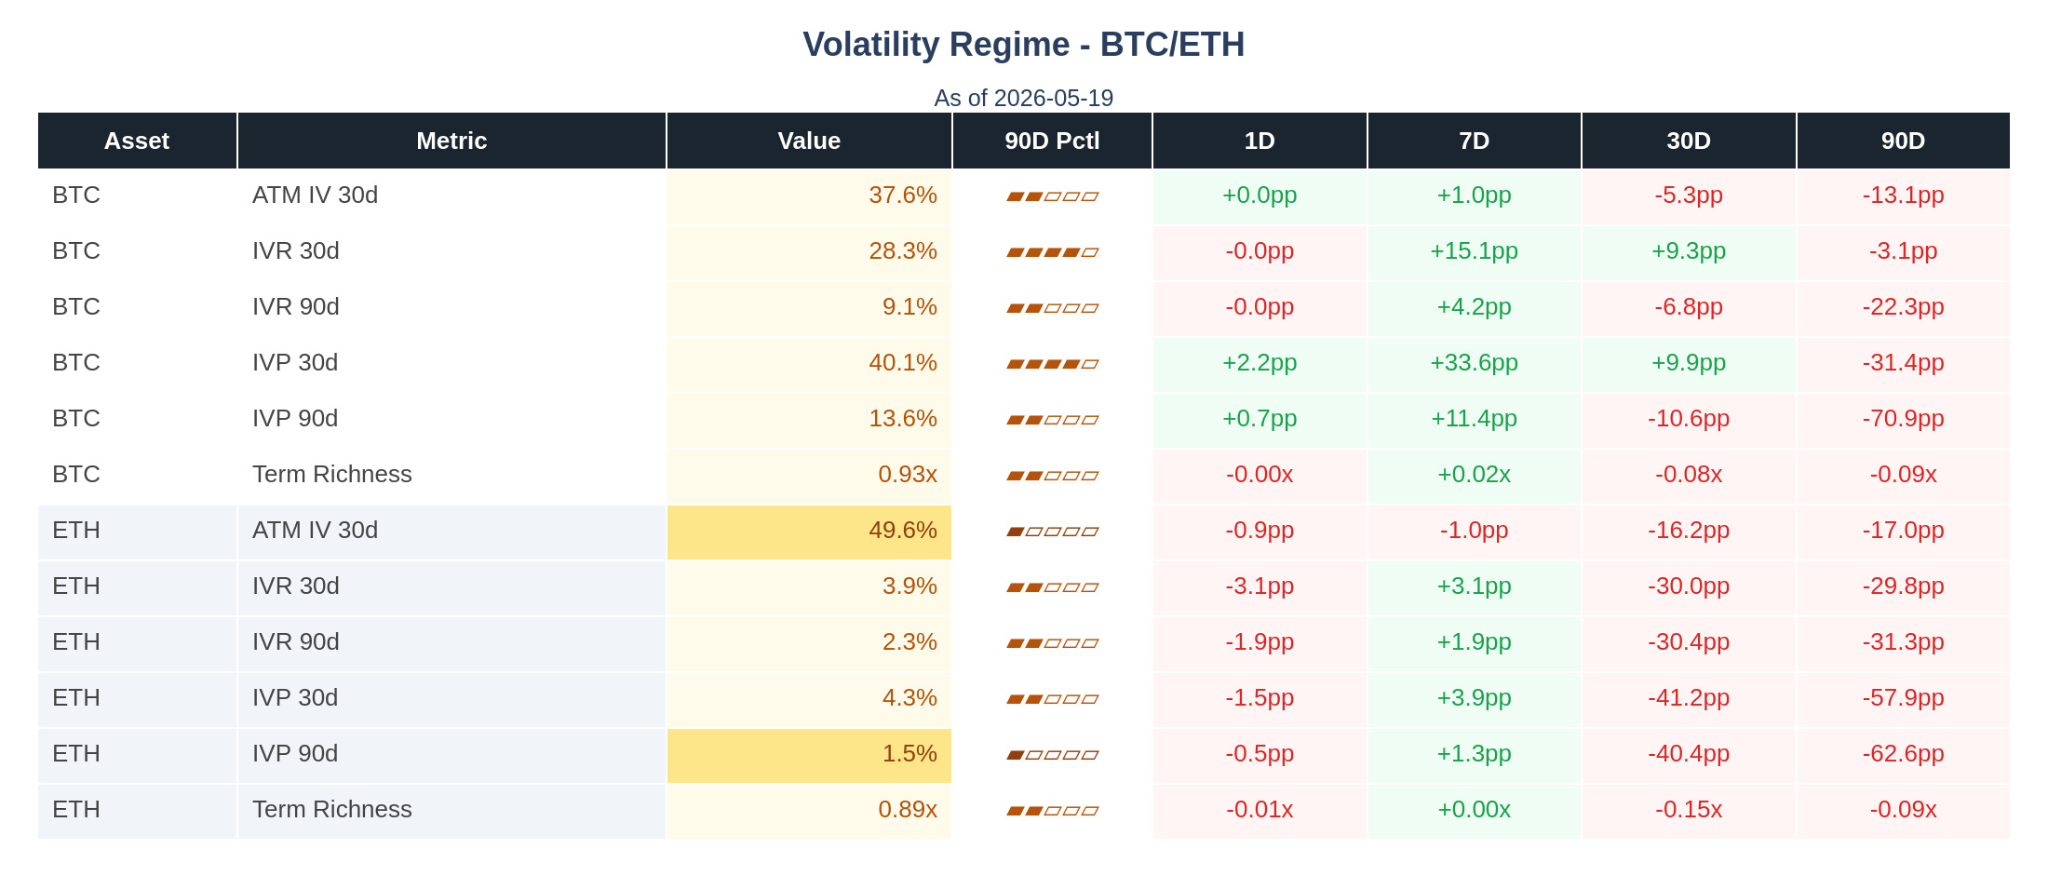
Figure 3.1: Volatility Regime. 30D ATM IV with IV rank and IV percentile (30D and 90D windows), plus term richness. The level reads moderate. The percentile reads extreme. The IVR and IVP gap reads the distribution shape. The three views together are the regime read.
IV across tenors.
The vol surface is two-dimensional. IV varies by tenor (time to expiry) and by moneyness (strike vs spot). Most analysis collapses both dimensions into a single number: the at-the-money 30-day IV. That collapse is useful for quick reads but throws away information. Four key tenors carry most of the surface read, and each tells you something different.
The 7-day tenor is the front end. It is dominated by event risk: the next FOMC decision, the next CPI print, the next options expiry. Front-end IV moves on the calendar, not on the regime. When front-end IV expands while longer tenors stay flat, the move is event-priced, not regime-priced.
The 30-day tenor is the middle. It is where most volume sits, where market-makers concentrate, and where the consensus IV reading lives. When traders quote "BTC IV" without qualification, they almost always mean 30D ATM. It is the headline number for the surface.
The 90-day tenor is the longer-term regime view. It cuts through individual events and reflects the structural read on vol over a quarter. When 90D IV moves, the market is updating its medium-term variance assumption. That is a regime call, not a calendar call.
The 180-day tenor is structural. It is where vol traders express views on the broader cycle, where insurance demand for tail events lives, and where the back-end of the curve gets shaped. 180D IV moves slowly and is the least responsive to individual news prints. When it moves, it matters.
Reading the full curve at this resolution requires the IV surface to be computed across every tenor with consistent methodology, timestamp-aligned across venues, and rebuilt nightly so the shape comparison against history is apples-to-apples. Most retail platforms display ATM 30D and stop. The shape read is impossible without the full surface, and the full surface is harder to maintain than it looks.
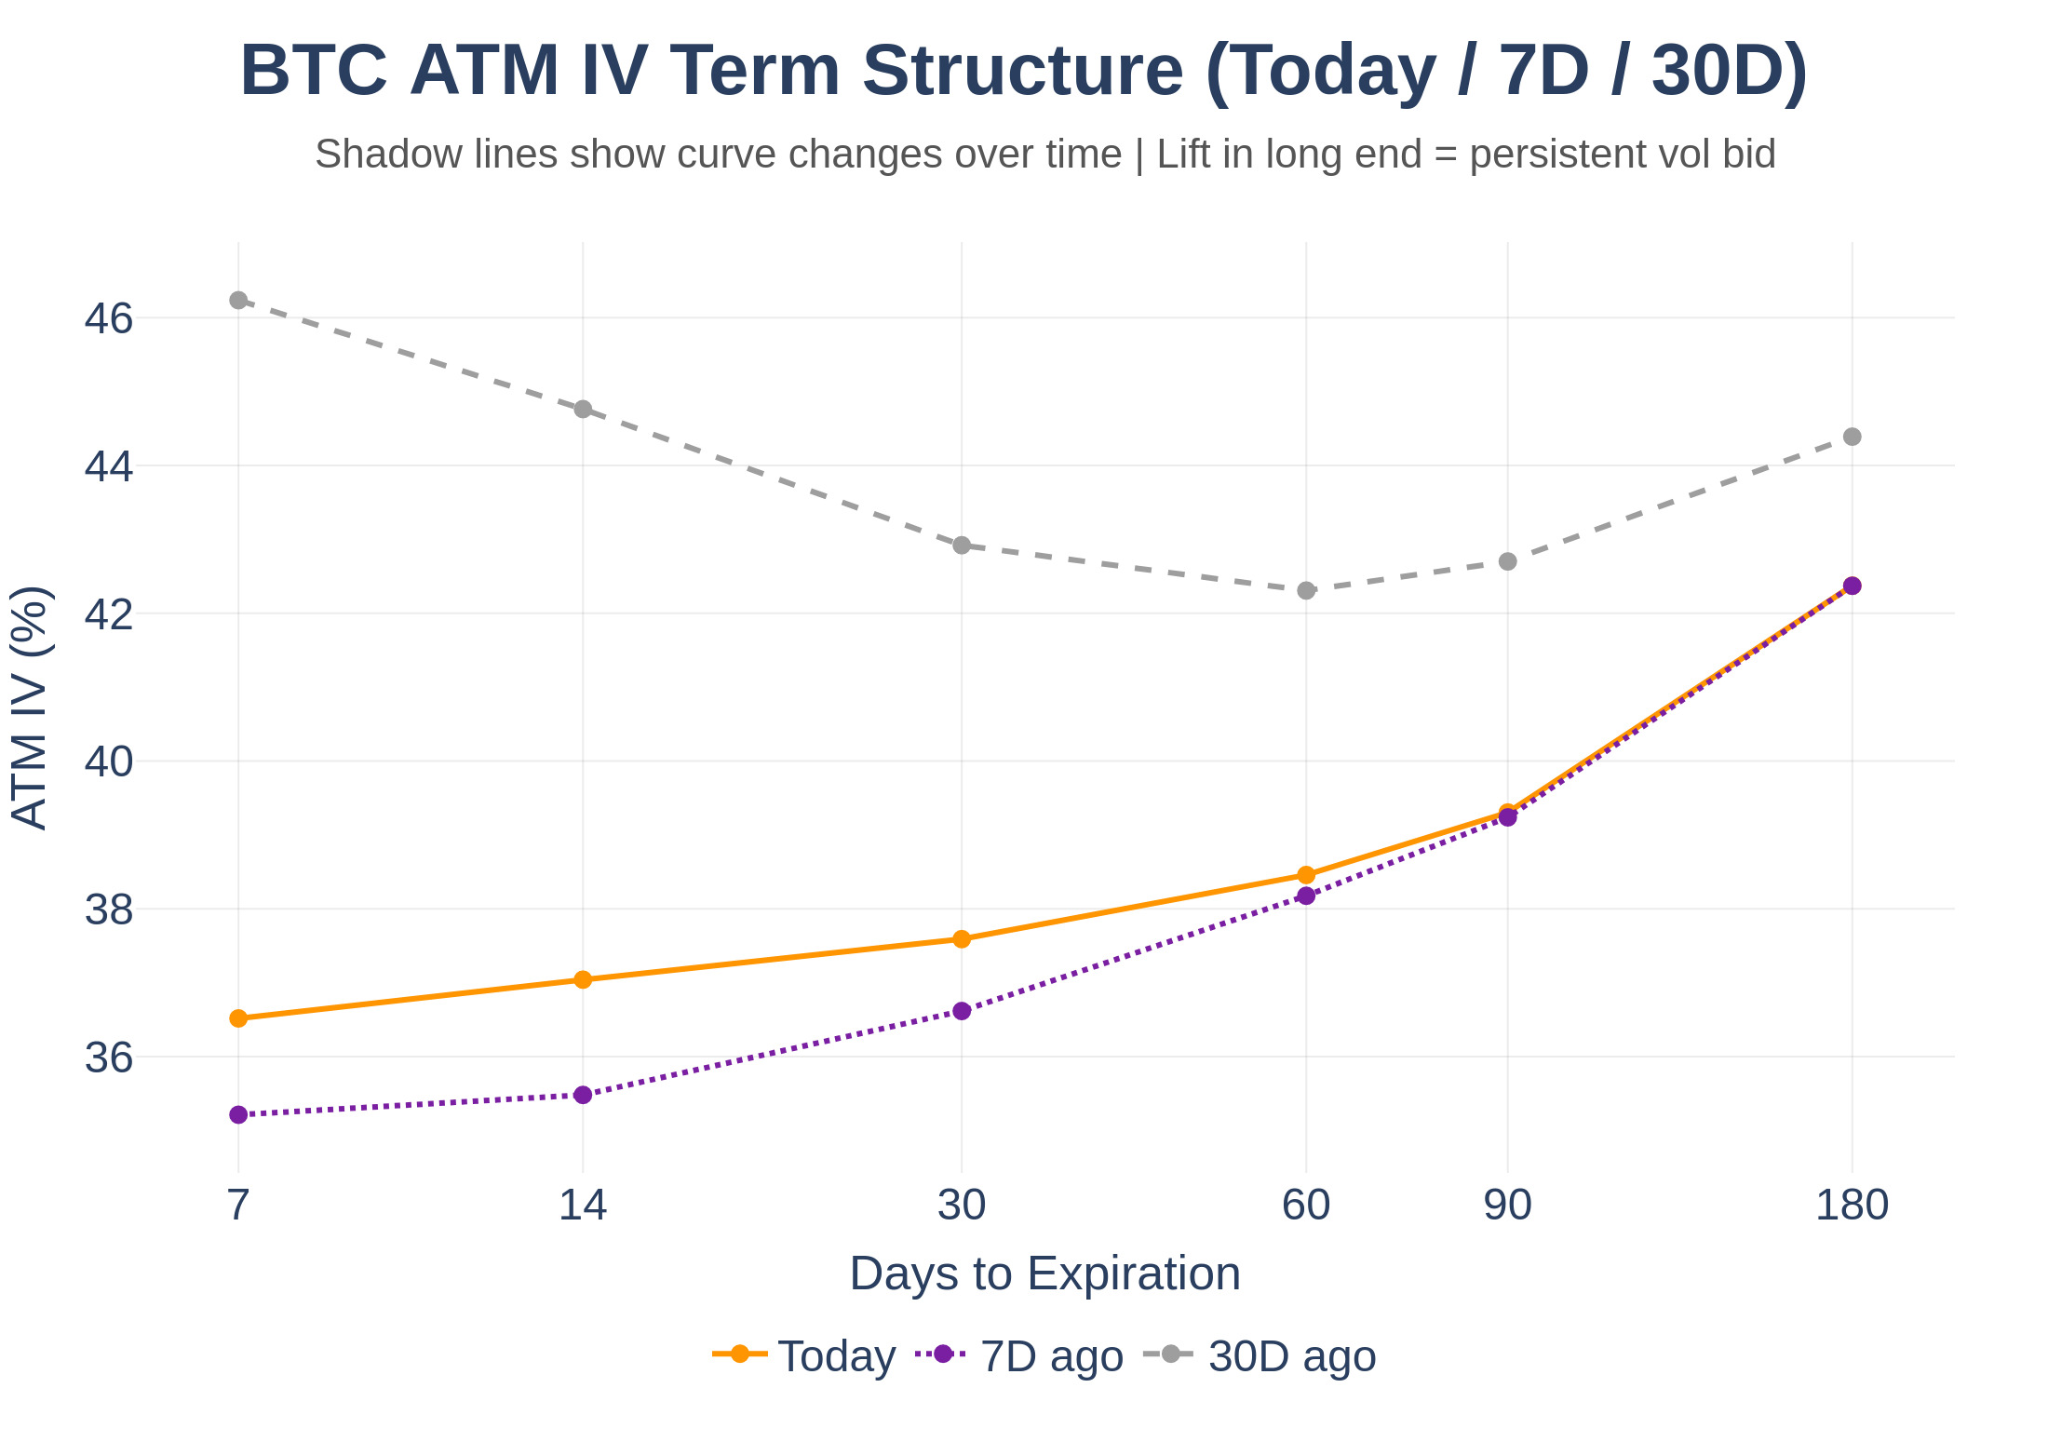
Figure 3.2: BTC ATM IV Term Structure with Historical Shadow. Current curve overlaid against the prior month and the trailing-90-day envelope. Shape matters more than level. A curve flatter than its shadow is the signature of front-end event pricing or back-end compression.
This week's BTC curve sits below its trailing-30-day shadow across every tenor, with the steepest compression in the 30D and 60D buckets. That shape says two things simultaneously. Absolute vol has fallen across the surface (the level read). The middle of the curve has compressed faster than the front or back (the shape read). The middle compressing fastest is consistent with a market that has priced through a near-term event without expecting a regime change on the longer horizon.
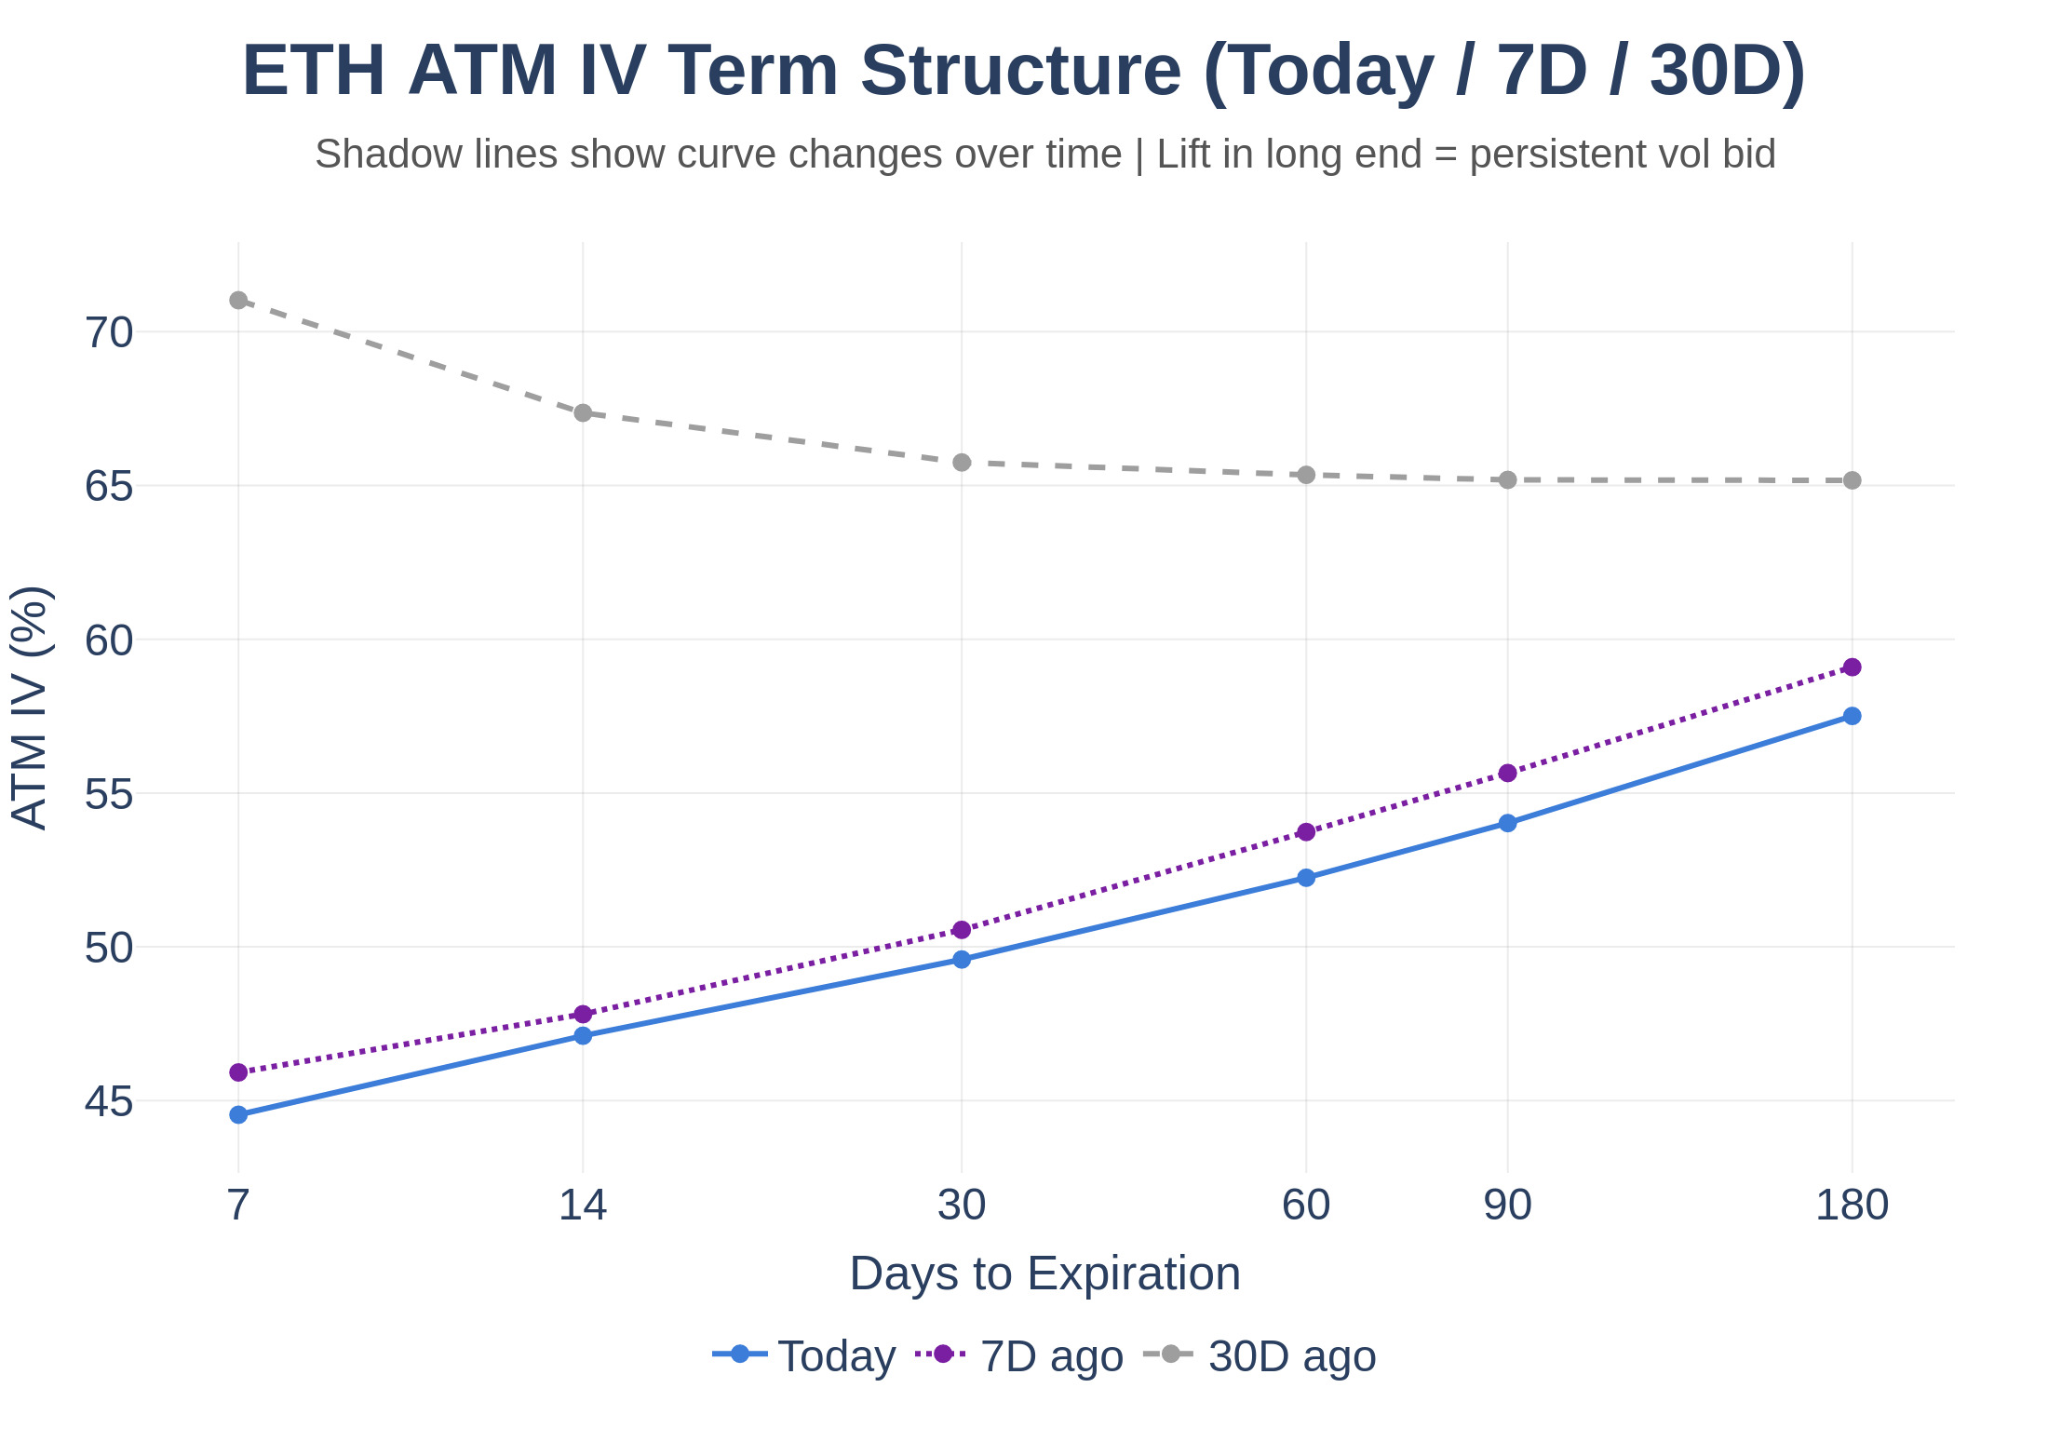
Figure 3.3: ETH ATM IV Term Structure with Historical Shadow. Same construction as BTC. The shape comparison across BTC and ETH is the most useful within-crypto vol cross-section in the surface.
The ETH curve sits even further below its shadow than BTC. ETH 30D ATM IV at just below 50% is in the 1st percentile of its 90-day distribution, a more extreme reading than BTC's 12th percentile on the same metric. The cross-asset comparison tells you ETH has compressed faster on the surface than BTC, which aligns with what Post 2 showed on realized vol: ETH RV is also more compressed than BTC RV. The surface is following the realized tape rather than leading it.
Rank versus percentile.
The two most common rank metrics for IV are IV Rank (IVR) and IV Percentile (IVP). The names sound interchangeable. The computations are not, and the difference matters in practice.
IVR is linear interpolation. Current IV minus the 90-day minimum, divided by the 90-day range. An IVR of 0.5 means current IV sits exactly midway between the 90-day low and the 90-day high. IVR is sensitive to the extremes of the distribution: a single spike up or down can pull the range and shift the rank meaningfully.
IVP is the empirical distribution function. The fraction of days in the 90-day window when IV was below current. An IVP of 0.5 means current IV is at the median of the trailing 90 days. IVP is insensitive to extremes because it counts days, not distances.
When the IV distribution is symmetric, IVR and IVP agree closely. IV distributions are almost never symmetric. They have long left tails (vol grinds lower) and fat right tails (vol spikes higher), which means the same current reading can give very different IVR and IVP numbers.
28
BTC IV Rank 30D sits at the 28th percentile, dead center in the 20-40 percentile band that has historically produced the fastest forward vol moves in BTC. Quiet vol is dangerous vol, and quiet vol after a directional spot decline is the standard setup pattern.
This week's BTC reading is the illustration. BTC IVR 30D is 0.28. BTC IVP 30D is 0.38. The gap is ten percentile points. Translation: current BTC IV is 28% of the way between the 90-day low and the 90-day high, but it is higher than 38% of the days in the window. The distribution skews low. There are more days clustered at low IV with a few days reaching to the upper bound. Reading IVR alone makes vol look cheaper than it is on a day-count basis. Reading IVP alone misses that the recent high-vol episodes were severe enough to push the range high.
The practical rule. Use IVR for regime extremity: "is vol historically rich or cheap for this regime." Use IVP for distribution position: "how unusual is this level on a day-count basis." When they agree, the read is durable. When they disagree, the regime has had recent dispersion and the move that resolves the disagreement is the trade to watch.
Term richness.
Term richness is the one-number summary of curve shape. The construction is a ratio of long-tenor IV to short-tenor IV, normalised against the curve's own historical shape so the metric reads as a single comparable number across regimes.
Above 1.0: the curve is steeper than usual, which is contango. Long-dated vol is bid relative to short-dated. The market is paying for structural regime risk further out. This is the normal regime in stable markets.
Below 1.0: the curve is flatter or backwardated. Front-end vol is bid relative to back-end. The market is paying for near-term protection more than long-term protection. This is the signature of event premium or acute stress in the near tenors.
Cycling around 1.0: the regime is transitional. The market is uncertain whether the near-term move resolves into a regime change or fades back to baseline. Transitional regimes are where the term richness signal carries the most information, because the shape change happens before the level change.
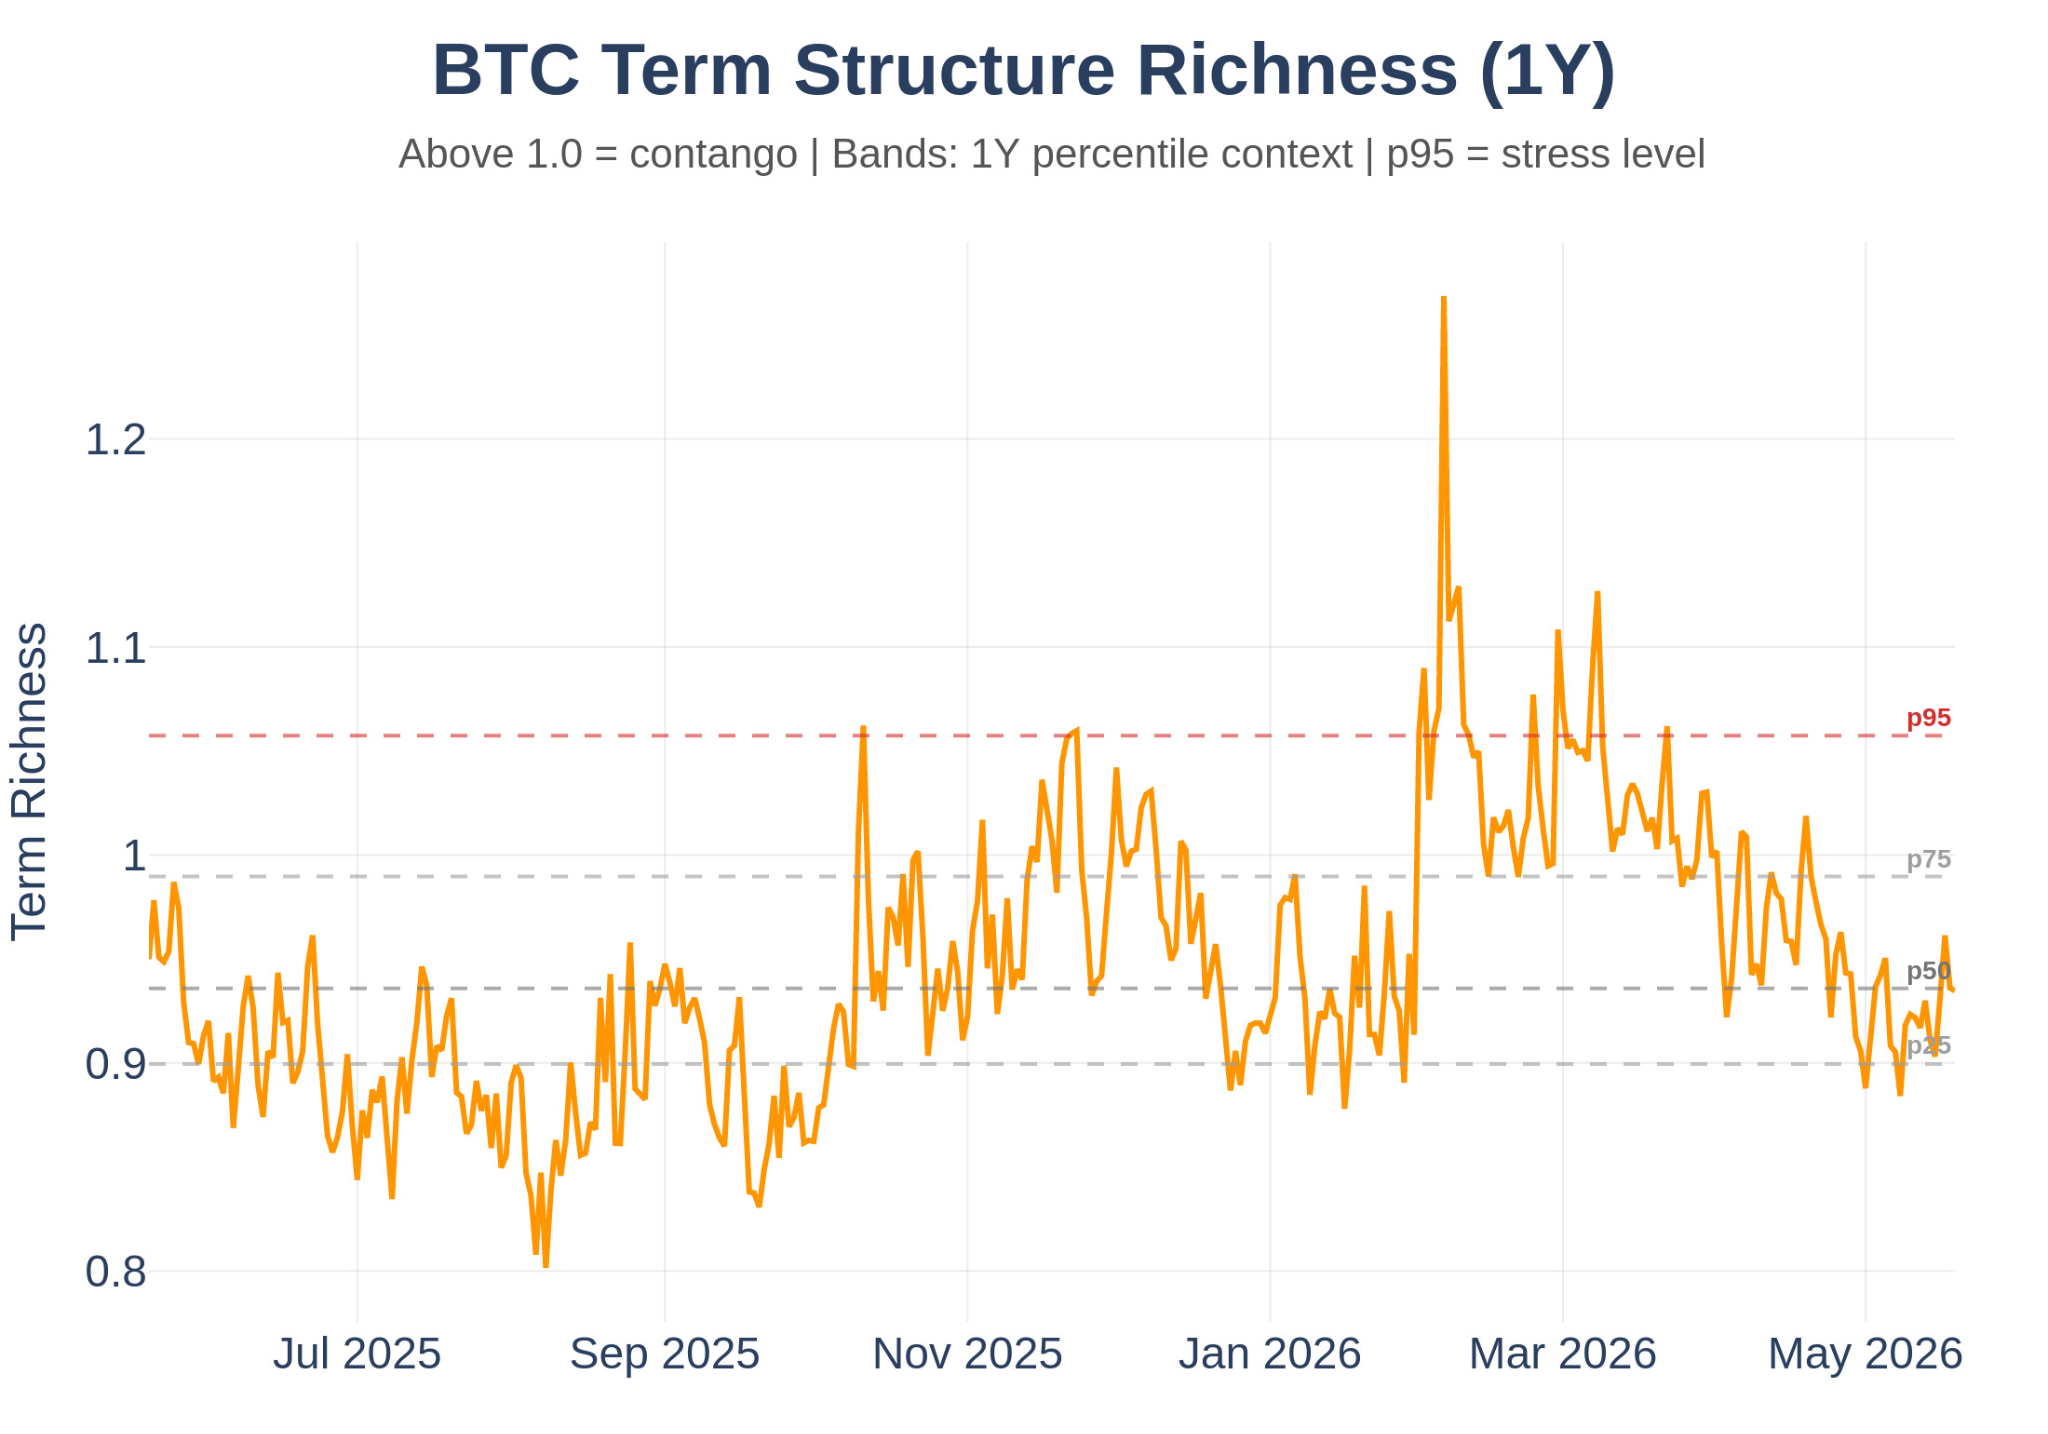
Figure 3.4: BTC Term Richness over 1 Year. Single ratio line oscillating around 0.9-1.0
BTC term richness this week is 0.94, sitting in the 19th percentile of its 90-day distribution. ETH term richness is 0.90, also in the 19th percentile. Both are below 1.0 but not at extremes. The shape read across the major-cap complex is consistent: the curve is flatter than its own recent history, with front-end vol bid relative to back-end. That is the signature of near-tenor event pricing on a surface where the regime read on long tenors has not yet moved.
The combination of low absolute IV with sub-1.0 term richness is informative. The market is not paying up for structural variance protection (long tenors compressed). It is paying for near-term protection while leaving the back of the curve at structural lows. That is the surface signature of a market that thinks the next move is near and limited rather than far and large.
The heatmap.
The IVR heatmap is the surface in two dimensions. Tenor on one axis, time on the other, colour intensity equal to IV rank. The single chart compresses what would otherwise take a stack of term-structure snapshots: how the rank of every tenor has evolved across the trailing window.
Two patterns matter on the heatmap. Vertical streaks (single dates where every tenor moves rank together) mark regime transitions. The whole surface re-prices on the same day, which is what regime changes look like. Persistent horizontal patches (single tenors holding their rank over time) mark durable regimes. When a tenor sits in the same rank band for weeks, the surface has stabilised on that horizon.
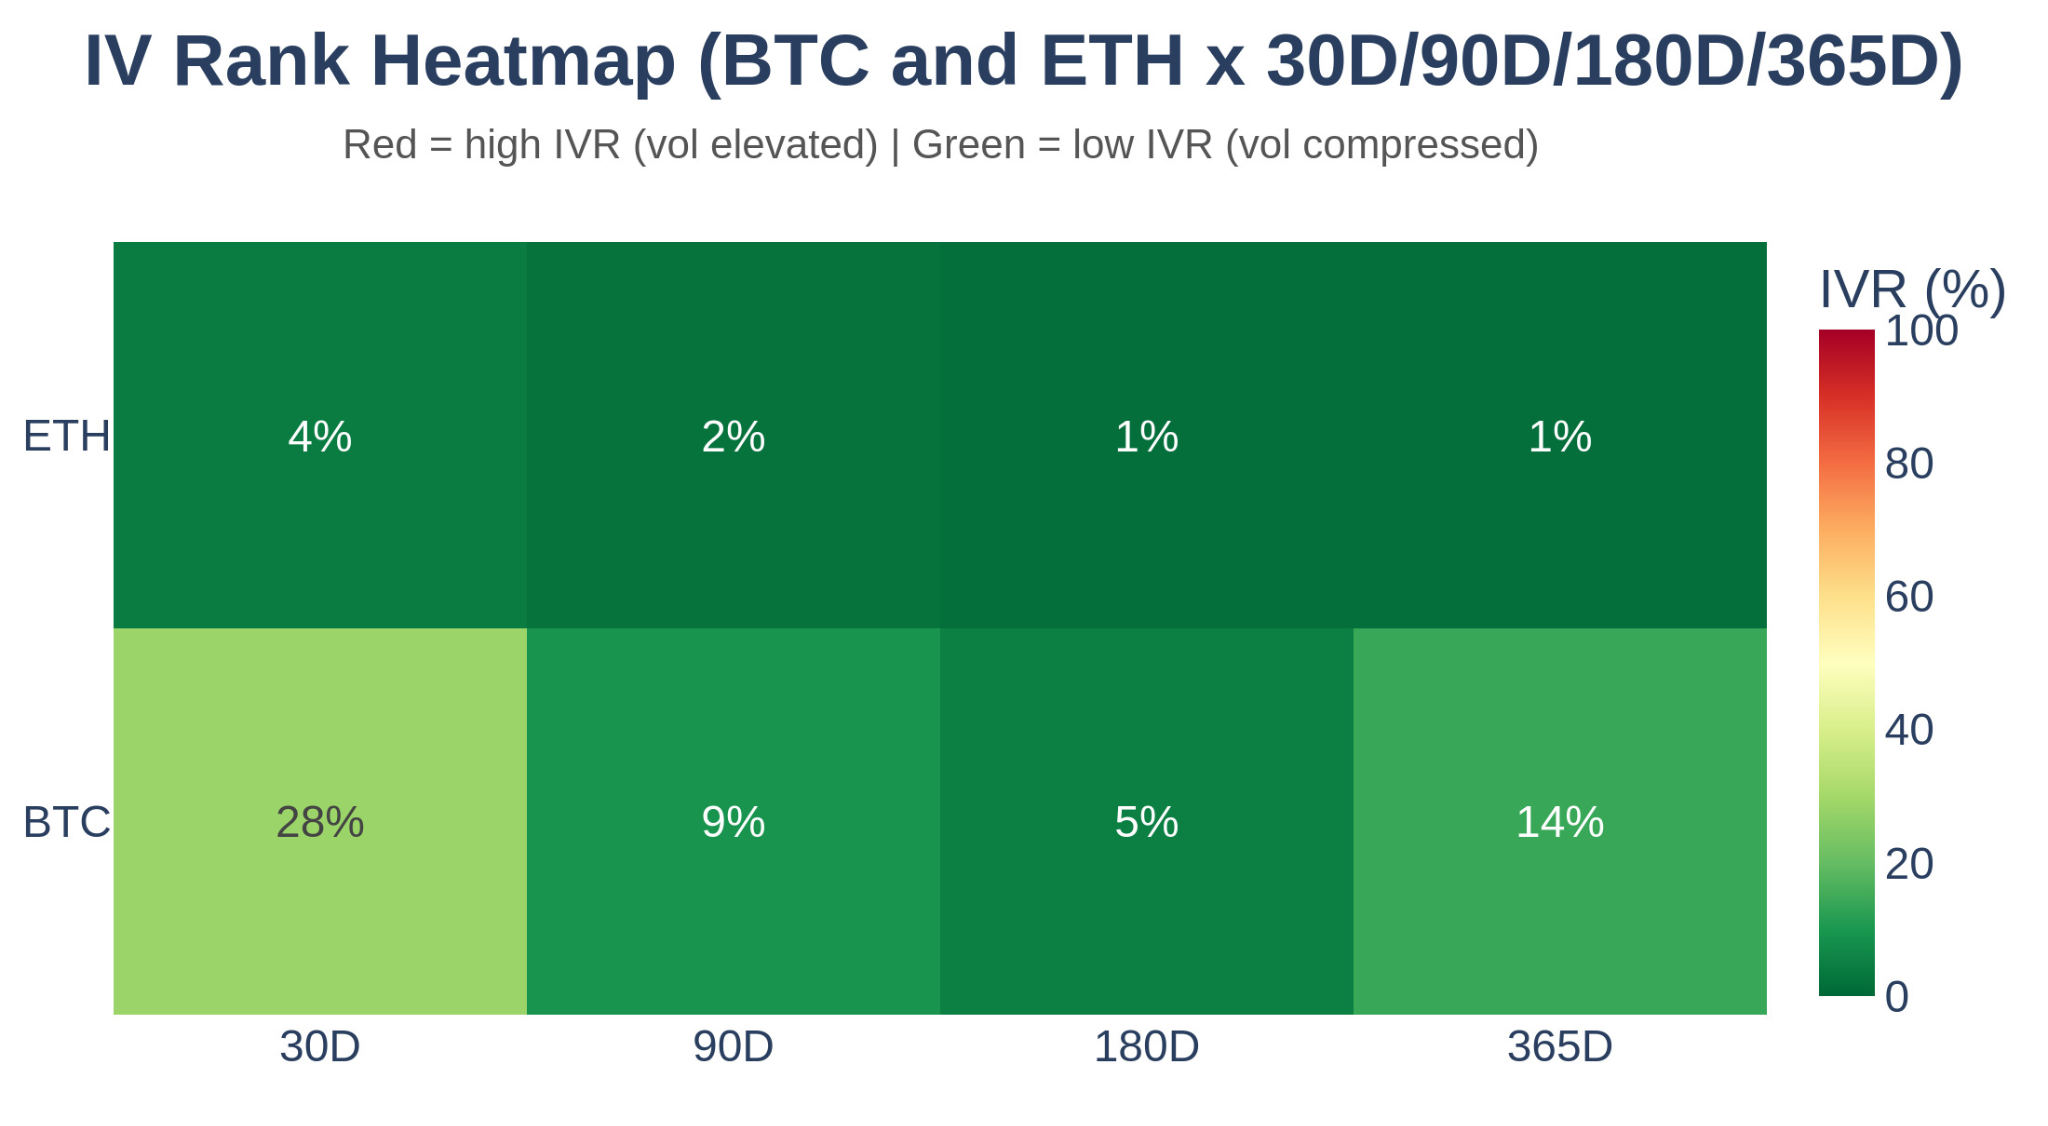
Figure 3.5: BTC IV Rank Heatmap. Tenor on the vertical axis, time on the horizontal, colour = IV rank. Read vertical streaks as regime transitions and persistent horizontal patches as durable regimes. The current right edge tells you where the surface sits today.
The current right edge of the heatmap reads compressed across every tenor, with the deepest cool colours in the 30D-to-90D middle. That is the visual signature of the same pattern Sections 3 and 4 described: middle-of-the-curve compression with surface-wide low rank. There is no vertical streak in the recent window suggesting a fresh regime change. The heatmap is the chart that confirms the surface has settled into the low-vol regime rather than transitioning through it.
The cross-asset application makes the chart more powerful still. Overlay the BTC heatmap against the ETH heatmap and the divergences light up. When BTC shows persistent green in the back-end while ETH shows the same back-end in red, the surface is pricing a regime divergence inside the crypto complex. When both heatmaps print a vertical streak on the same date, the regime change is crypto-wide rather than asset-specific. The single visual reduces a stack of term-structure snapshots and cross-asset comparisons into a glance. Once the reader has the mechanics, the heatmap takes ten seconds to read and tells the regime story faster than any other chart in the toolkit.
Reading today.
Synthesis. The implied vol regime this week reads compressed across every dimension. Level: BTC 30D ATM IV at 37.6%, ETH at 49.5%, both well below their 90-day medians. Rank: BTC IVR 30D at 0.28, ETH IVR 30D at 0.07, the gap between them showing ETH has compressed materially faster than BTC. Shape: BTC term richness at 0.94, ETH at 0.90, both below 1.0 with front-end bid relative to back-end. Surface: the IVR heatmap confirms the read.
The killer insight applies. BTC IV at the 28th percentile sits inside the 20-40 percentile band that has historically produced the fastest forward vol moves. The reading is not extreme enough to invite reflexive vol buying, but it is exactly the zone where compressed vol on a quiet tape has resolved sharply in past cycles. Quiet vol is dangerous vol. ETH at the 7th percentile is more compressed still, and the cross-asset gap (BTC and ETH both compressed, ETH more so) makes the asymmetric setup more interesting on the ETH leg than the BTC leg.
Implied vol is not a forecast. It is the consensus risk-transfer price, weighted by capital. That distinction explains why IV can stay above realized for years.
What comes next in The Vol Stack.
This was the implied vol level layer of the stack. ATM IV at four tenors, two rank metrics, one shape number, and the full heatmap. Post 1 established the macro vol regime. Post 2 established the realized vol kinetic state. Post 3 has established the IV surface read across level, rank, shape, and surface.
Post 4 moves to skew: where the IV surface bends across moneyness rather than across tenor. ATM IV is the floor. The smile is the structure on top. Crypto skew tells a story equity markets never will, because the participant mix and the structural call bid create patterns that have no equity analogue. The risk reversal, the butterfly, and the wings of the surface are where directional positioning shows up in the options book before it shows up in spot.
The fastest moves in BTC vol have historically come from the 20-40 percentile band, not from extremes.
Next in The Vol Stack: The Smile: Why Crypto's Skew Tells a Story Equity Markets Never Will.
|
THE BOTTOM LINE |
|
The implied vol regime this week is compressed across every dimension. BTC 30D ATM IV at 37.6% sits in the 12th percentile of its 90-day distribution, with IVR at 0.28 and IVP at 0.38. ETH 30D ATM IV at 49.5% is in the 1st percentile, with IVR at 0.07. Term richness is below 1.0 for both assets, sitting at 0.94 for BTC and 0.90 for ETH, both in the 19th percentile of their 90-day distributions. The curve is flatter than its own recent history, with front-end bid relative to back-end. The killer insight is that BTC IV at the 28th percentile is dead center in the 20-40 band that has historically produced the fastest forward vol moves. The combination of compressed level, low rank, sub-1.0 term richness, and a quiet realized tape is the standard setup pattern. The asymmetry sits on the ETH leg, where the compression is more extreme. |
Full-Market Research. Institutional Depth.
Derivatives, ETFs, on-chain, DEXs, microstructure, risk signals, and more. Subscribe at the bottom of our page for research that covers every corner of crypto and visit the Amberdata Research Blog.
Access Amberdata Intelligence for institutional-grade digital asset intelligence, or contact our team to discuss custom solutions.
Links & Resources
Amberdata Research Library
https://www.amberdata.io/research-library
Amberdata Intelligence Platform
https://intelligence.amberdata.com
Amberdata Docs
Contact Us
https://www.amberdata.io/contact-us
Recent from Amberdata
• The Vol Stack #2: Spot, Leadership, and How Realized Vol Tells the Story First
• The Vol Stack #1: The Macro Vol Regime and Why Crypto Is Never an Island
• The Stress Test: ETF Cost Basis Part 3/3
• Who Breaks First: ETF Cost Basis Part 2/3
• The $80,000 Floor: ETF Cost Basis Part 1/3
• Bitcoin's Great Rotation: Who Bought the Dip and Why It Matters
• The Leverage Purge: Why the Market Is Healthier After $8.55B in Pain
• The ETF Exodus Decoded: Basis Arbitrage, Not Capitulation
• Coincidence or Signal? Did WLFI Telegraph Crypto's $6.93B Meltdown
• How $3.21B Vanished in 60 Seconds: October 2025 Crypto Crash Explained Through 7 Charts
The information contained in this report is provided by Amberdata solely for educational and informational purposes. The contents of this report should not be construed as financial, investment, legal, tax, or any other form of professional advice. Amberdata does not provide personalized recommendations; any opinions or suggestions expressed in this report are for general informational purposes only.
Although Amberdata has made every effort to ensure the accuracy and completeness of the information provided, it cannot be held responsible for any errors, omissions, inaccuracies, or outdated information. Market conditions, regulations, and laws are subject to change, and readers should perform their own research and consult with a qualified professional before making any financial decisions or taking any actions based on the information provided in this report.
Past performance is not indicative of future results, and any investments discussed or mentioned in this report may not be suitable for all individuals or circumstances. Investing involves risks, and the value of investments can go up or down. Amberdata disclaims any liability for any loss or damage that may arise from the use of, or reliance on, the information contained in this report.
By accessing and using the information provided in this report, you agree to indemnify and hold harmless Amberdata, its affiliates, and their respective officers, directors, employees, and agents from and against any and all claims, losses, liabilities, damages, or expenses (including reasonable attorney's fees) arising from your use of or reliance on the information contained herein.
Copyright © 2026 Amberdata. All rights reserved.