Share this blog:

Arbitrage using cryptocurrency exchanges remains as lucrative as ever. But what does crypto arbitrage look like using decentralized exchanges, and how can firms leverage price differentials to make low-risk gains?
In this report, we used Amberdata’s API to backtest crypto arbitrage trading strategies. We go into the structure of decentralized and centralized exchanges, explore the different factors and considerations necessary to develop a trading strategy, and then discuss our own backtesting results.
What is crypto arbitrage trading?
Just like in traditional finance, crypto arbitrage is the simultaneous buying and selling of digital assets to take advantage of price differences. Prices of a cryptocurrency like Bitcoin can have slight price discrepancies across exchanges, allowing traders to capitalize on the difference.
Decentralized exchanges vs. centralized exchanges
There are two types of cryptocurrency exchanges, centralized exchanges (CEXs) and decentralized exchanges (DEXs), and each has a different mechanism for determining the asset's price.
Centralized exchanges are platforms that act as trusted intermediaries between buyers and sellers and often custody users’ funds and data. Similarly to traditional finance, prices of the cryptocurrency assets on centralized exchanges depend on the most recent bid-ask price on the exchange order book.
Decentralized exchanges are peer-to-peer marketplaces for buying, trading, and selling digital assets. These exchanges lack an intermediary to facilitate the transfer and custody of funds, and without a centralized authority charging fees for transactions, DEXs are often less expensive than their centralized counterparts.
Decentralized crypto exchanges use a different method from centralized exchanges for determining crypto asset prices. DEXs rely on liquidity pools funded by users who deposit their assets to provide liquidity in exchange for a proportional share of the transaction fees. Each liquidity pool is made up of a specific pair of assets.
For example, if you wish to trade ether (ETH) for DAI you would trade in the DAI/WETH pool. These exchanges are run by automated market maker (AMM) algorithms that keep the ratio of assets in the pool balanced. Because traders do not have to wait for a counterparty to match their bid or ask, trades can be executed at any time.
Additionally, user behavior differs between centralized and decentralized exchanges. CEX users put their trust into the exchange and allow the company custody of their assets. In return, users enjoy convenient benefits, such as cross-chain interactions and fiat conversions. DEXs, on the other hand, are decentralized and permissionless. DEX users do not have to pass Know Your Customer (KYC) regulations, and those who primarily trade on their platforms are generally more willing to try innovative solutions.
Because of their different behavioral profiles, DEX and CEX users may think and react differently to different scenarios, triggering price disparities across venues. For example, a large cryptocurrency holder, referred to as a whale, could sell its assets on a DEX, triggering a big difference in the prices of the assets in the pool compared to the average price across all other CEX exchanges.
Other times, a whale selling assets could cause panic among other users and trigger a chain reaction, which would depeg the price of the asset in comparison to other exchanges. In the right conditions and with visibility across CEX and DEX behaviors, these scenarios provide low-risk arbitrage opportunities to act on.
What are the right conditions for arbitrage trading?
There are multiple factors to look at to identify and quantify arbitrage opportunities between a centralized and decentralized exchange.
First, the gains from the arbitrage trade must exceed the cost of executing the transaction. Gas fees are required to swap on DEXs and to borrow on lending protocols, and trading across two crypto exchanges may also incur withdrawal and deposit fees. Gas fees can also be extremely high when there is a large price difference between exchanges as many traders and bots are trying to capitalize at the same time.
The role of borrowing in crypto arbitrage
When you need to borrow assets to conduct arbitrage using a lending protocol like Aave, Maker, or Compound, you have to consider the asset’s liquidity, interest rates, and collateral factors. The liquidity of the asset determines the total size of the funds you can borrow from the platform, and interest rates control how much to pay the token lender after borrowing. However, in arbitrage loans are paid back very quickly, so this should not be a major concern.
The collateral factor, also referred to as the liquidation threshold, determines the risk of the asset put up as borrowing collateral being liquidated. The total value of your borrowed amount should not exceed the limit of the collateral factor multiplied by the underlying asset one deposits. Additionally, each asset’s liquidation threshold may not be the same as each asset has a different risk profile. For example, on Aave the liquidation threshold for DAI is set at 90%, while MKR is set at 70%.
Overview of slippage in arbitrage trades
Slippage is another aspect of crypto arbitrage to consider, as simply looking at prices reflected on an exchange does not accurately reflect what gains or losses could be made from arbitrage. To precisely calculate slippage on centralized exchanges, it is important to look at the depth of the order book, the liquidity available at current price levels, and the respective price impact on illiquid markets.
On decentralized exchanges, arbitrage traders can consider slippage by calculating the price impact of a trade on a pool using the liquidity price. This equation is referred to as a constant product formula and is x * y = k. For retail crypto traders, it is not necessary to understand the underlying mechanisms of a DEX. For advanced traders that use complex strategies for multi-step trades like arbitrage, understanding these aspects of a DEX is essential for precise profit calculation. We’ll cover detailed calculations and examples of how to use a constant product formula more below.
Price differences in crypto arbitrage
Another essential component of arbitrage to consider is the price differential time window. The goal of arbitrage is to buy assets on one venue while simultaneously (or as close to that as possible) selling on another exchange to close the spread between the two and lock in on the profits. Decentralized exchanges that trade on Ethereum operate at a much slower rate than centralized exchanges due to the Ethereum block time, which is usually around fifteen seconds.
A lot of movement can happen on a CEX within fifteen seconds, and by the time the trade is executed the price of the digital asset may have changed, and the arbitrage window may be gone. Being able to quickly identify price variances and execute across both venues is paramount for any arbitrage strategy.
The trading mechanisms of crypto arbitrage
Let’s look at an example mechanism of crypto arbitrage between a centralized and decentralized exchange.
A user is looking to capitalize on the price of ether. The trader has 100,000 USDC in custody on a centralized exchange and 100,000 USDC in custody in a DeFi wallet. When there is a 2% difference in ETH between a CEX and a DEX, a bot will initiate a buy signal to determine if the arbitrage opportunity has a positive expectancy. Using the Amberdata API, the bot will check the exchanges’ current gas fees, and if they are within the set limit arbitrage will commence.
When the ETH price on a CEX is lower than the ETH price on a DEX, a bot will use the initial fund of 100k USDC on the CEX, let’s say Binance, to buy ETH. The bot will then use a constant product formula to calculate slippage and will sell the acquired ETH on a DEX like Uniswap V2. Next, the bot will borrow the same amount of ETH on a DeFi lending protocol such as Aave and receive wrapped ether (WETH). The WETH is then sold on the DEX USDC-WETH pool. In order to close the trade, the ETH loan is paid back at the lower price and the user has gained a profit from the difference.
When the ETH price on a DEX is lower than a CEX, the bot will take the funds in the DEX wallet and swap USDC for ETH on a pool like UniswapV2, buying ETH for the lower price. Then, the bot can borrow the same amount of ETH on the CEX and sells it at a higher price. The loan is then repaid with the ETH from the DEX, generating a profit.
Amberdata API example: crypto arbitrage in action
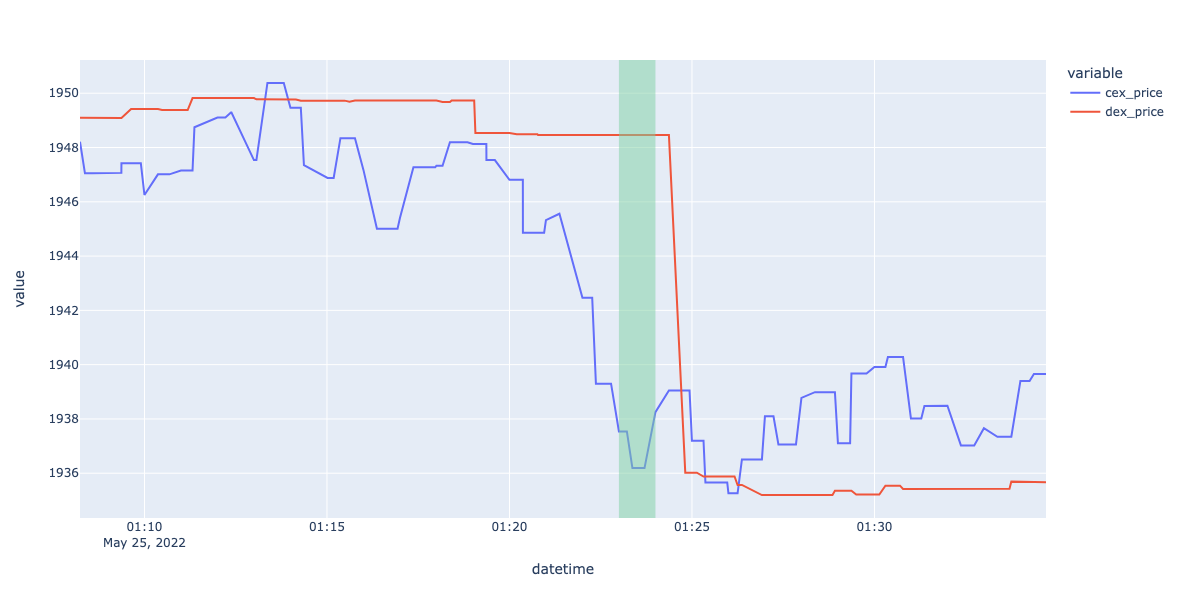
Figure 2.1.1: The USDC price of ETH on Binance (CEX) and Uniswap V2 USDC - ETH pool (DEX) over thirty minutes. The green bar indicates an optimal divergence of price for arbitrage trading.
As shown on the graph at time 1:23, the Uniswap pool price is about 1949 USDC/ETH, while the Binance price is around 1936 USDC/ETH. This deviation is large enough to attract traders to arbitrage and is represented by the green bar. The gap between the exchanges quickly disappears, illustrating the importance of monitoring the arbitrage opportunity time window.
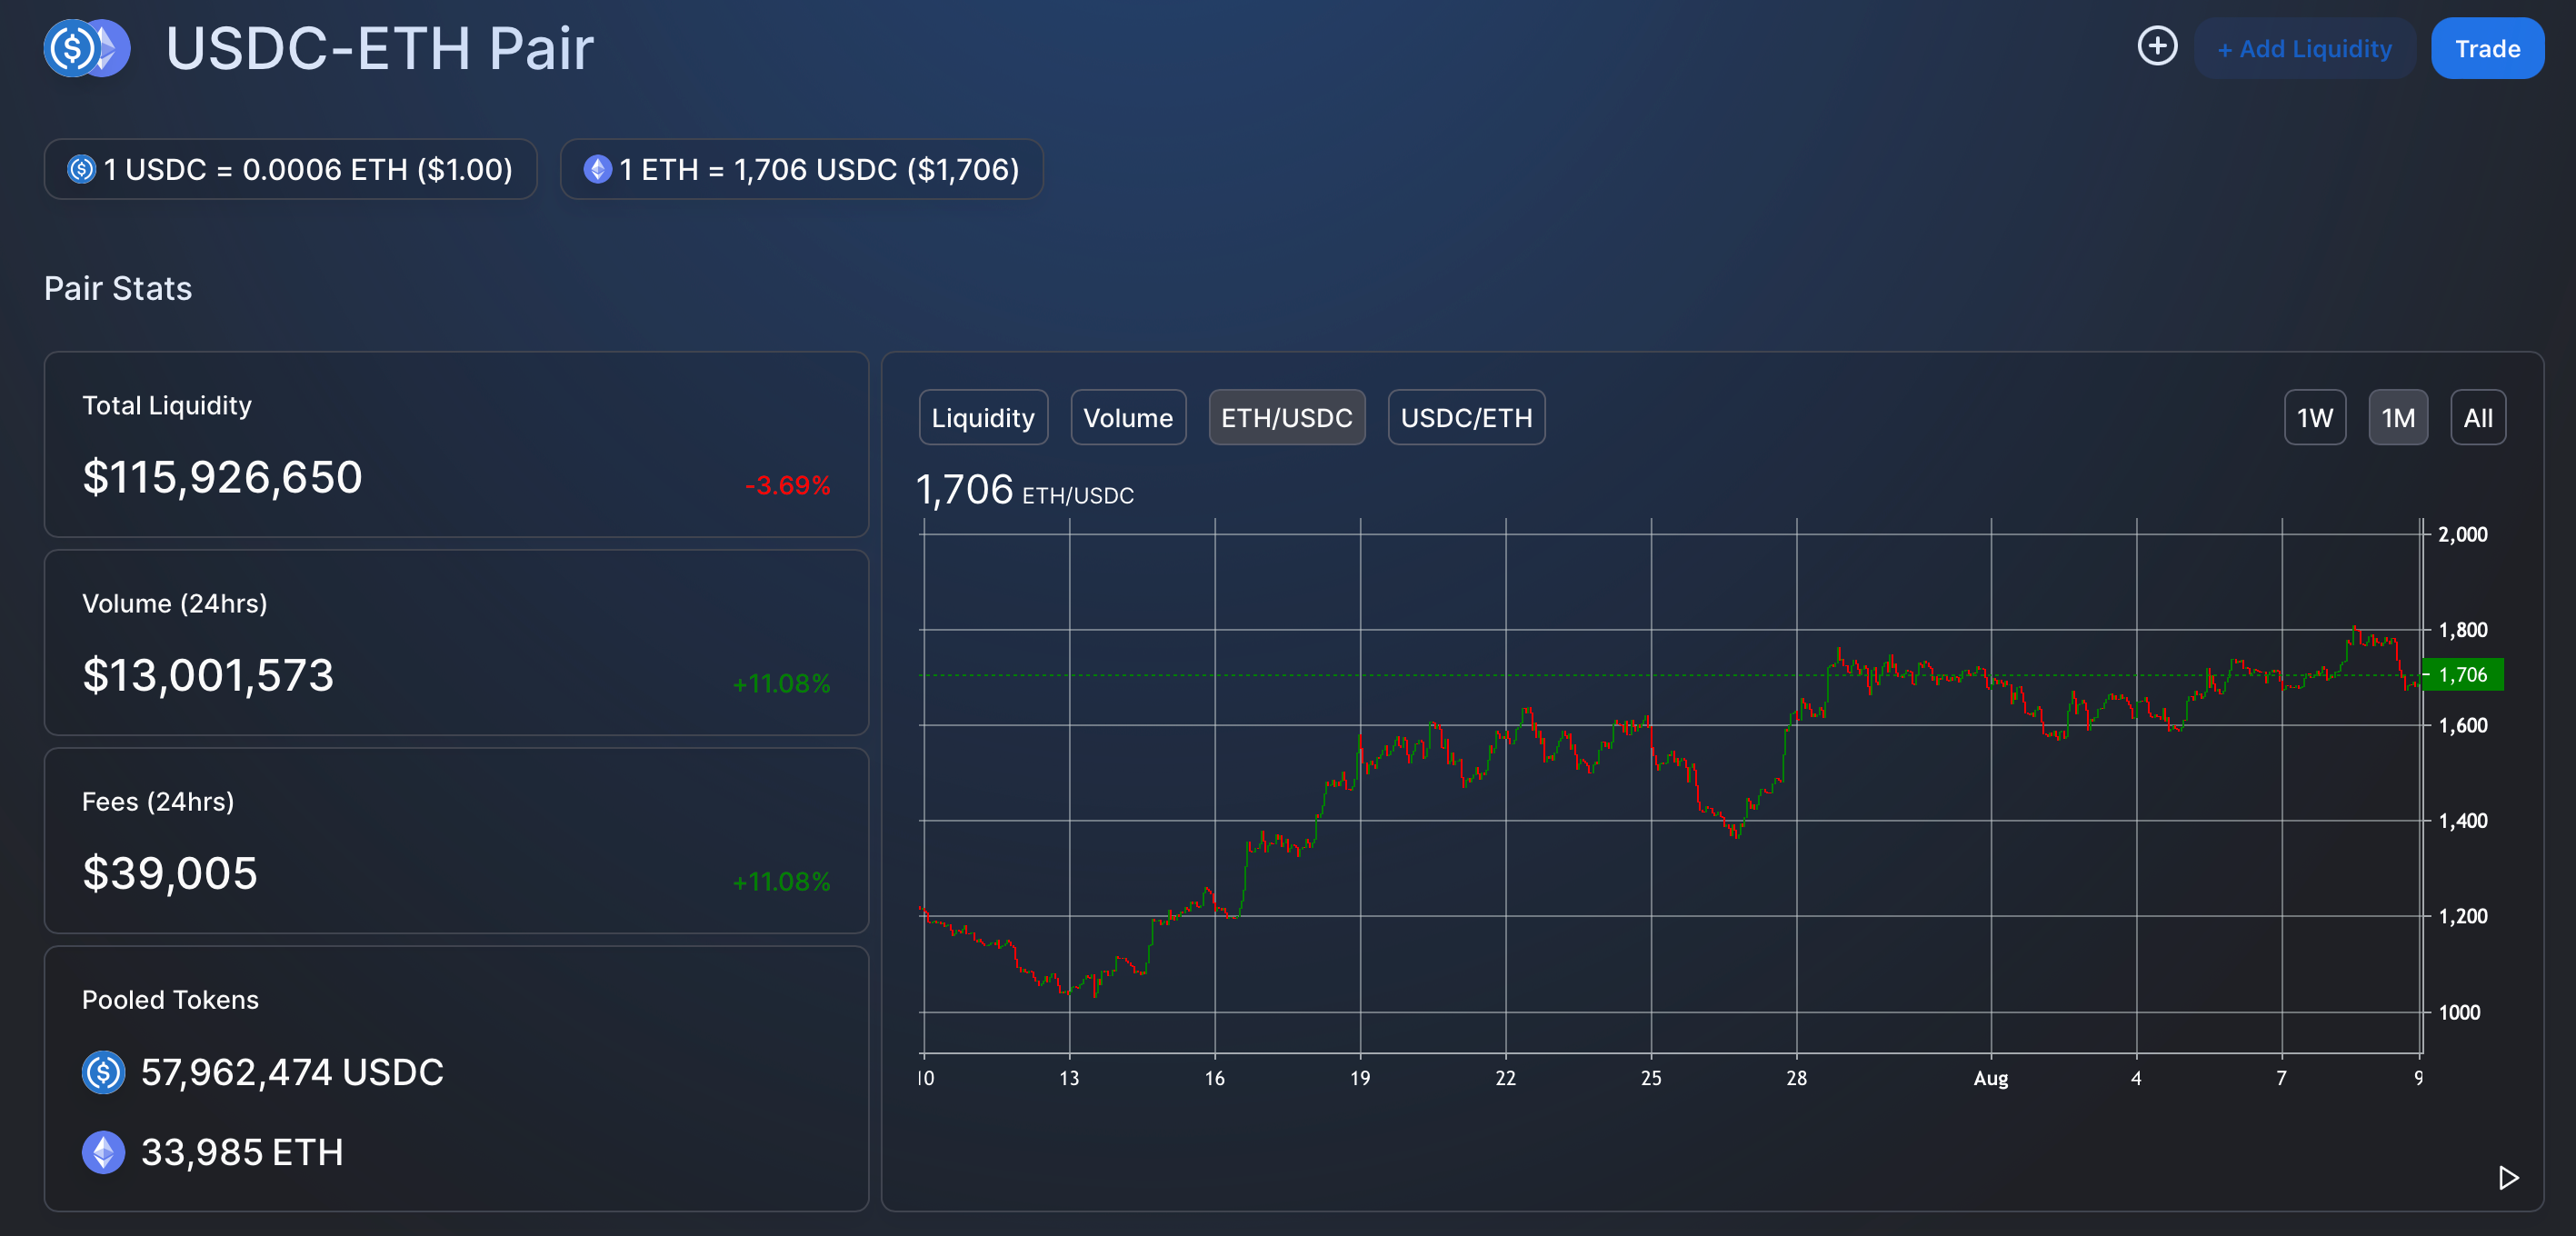
Figure 2.3.1: The USDC-ETH Pair Dashboard from Uniswap V2 website
Overview of the crypto market
Before we dive into the technical aspects of crypto arbitrage between a CEX and a DEX, let’s first take a look at the pair we have chosen to use. Understanding pair statistics and patterns are essential since the total value locked (TVL), trading volume, and the number of liquidity providers can hugely affect arbitrage trading profits since providers share 0.3% of every swap transaction.
We selected the USDC-ETH pool on Uniswap V2, which has a TVL of around $116M. The ETH price is 1,706 USDC at the time of writing, and the pool had a trading volume of about $13M USD in the past twenty-four hours. The TVL/Volume for the past year looks stable compared to other pairs, indicating that the pool is at a lower risk pool to trade on.
Arbitrage trading strategy design
Using all of the factors discussed above, we are now going to build a simple trading strategy. Building an arbitrage trading bot will allow automatic initiation of crypto arbitrage if the buy signal is detected. I.e., the market prices between both a DEX and a CEX deviate above a certain threshold, and he gas fees are within a profitable range. To build a bot, you have to research the right buy and sell signals, the optimal time window for arbitrage, the potential slippage, and fees.
Using the Amberdata API, we built our arbitrage trading design using these four factors. Just like in our example mechanism, we started with 100k in a DEX wallet and 100k on a CEX. Depending on which exchange has the lower price, we may have to use a lending protocol or swap our assets, which would incur fees.
Components of crypto arbitrage
In order to code your arbitrage trading bot, you must first find the ideal buying and selling signals. The ideal signals will be when the price difference between the CEX and DEX is large enough to cover the gas fee and potential slippage and sell when there is no price difference.
Additionally, you need to find the trading time windows that will maximize your arbitrage opportunity without closing before your transaction has gone through. A trading time window refers to the amount of time it takes for the price difference on a CEX and a DEX to merge. For example, if you see a 2% price difference but then it disappears within a couple of seconds, this indicates that arbitrage is unlikely as other traders have already capitalized on the differential.
This is why it is so important to research prime time windows for crypto arbitrage, especially because CEXs and DEXs differ so much in operations. Because CEXs operate like an order book, other traders' asks and bids are already in the system, allowing you to sell immediately if there is bad slippage. On a DEX, however, transactions initiated need to be validated and confirmed by the corresponding blockchain network, even if you are willing to sell your assets at a lower rate.
Further, understanding transaction fees when using a DEX is critical. If you obtain a loan from a lending protocol and swap on a pool, both of these actions have gas fees and waiting times. Going back to our previous example, we borrowed ETH on Aave to receive wrapped ether (WETH), and then sold it on the Uniswap V2 USDC-WETH pool. Both of these transactions had waiting times and fees.
In order to build our arbitrage trading bot, we backtested the past arbitrage data from Feb. 1 to May 1, 2022, to understand how many arbitrage opportunities there are and how long they existed. As shown in Figure 2.4.1, there are different opportunity time windows for the percentage difference in price between a CEX and a DEX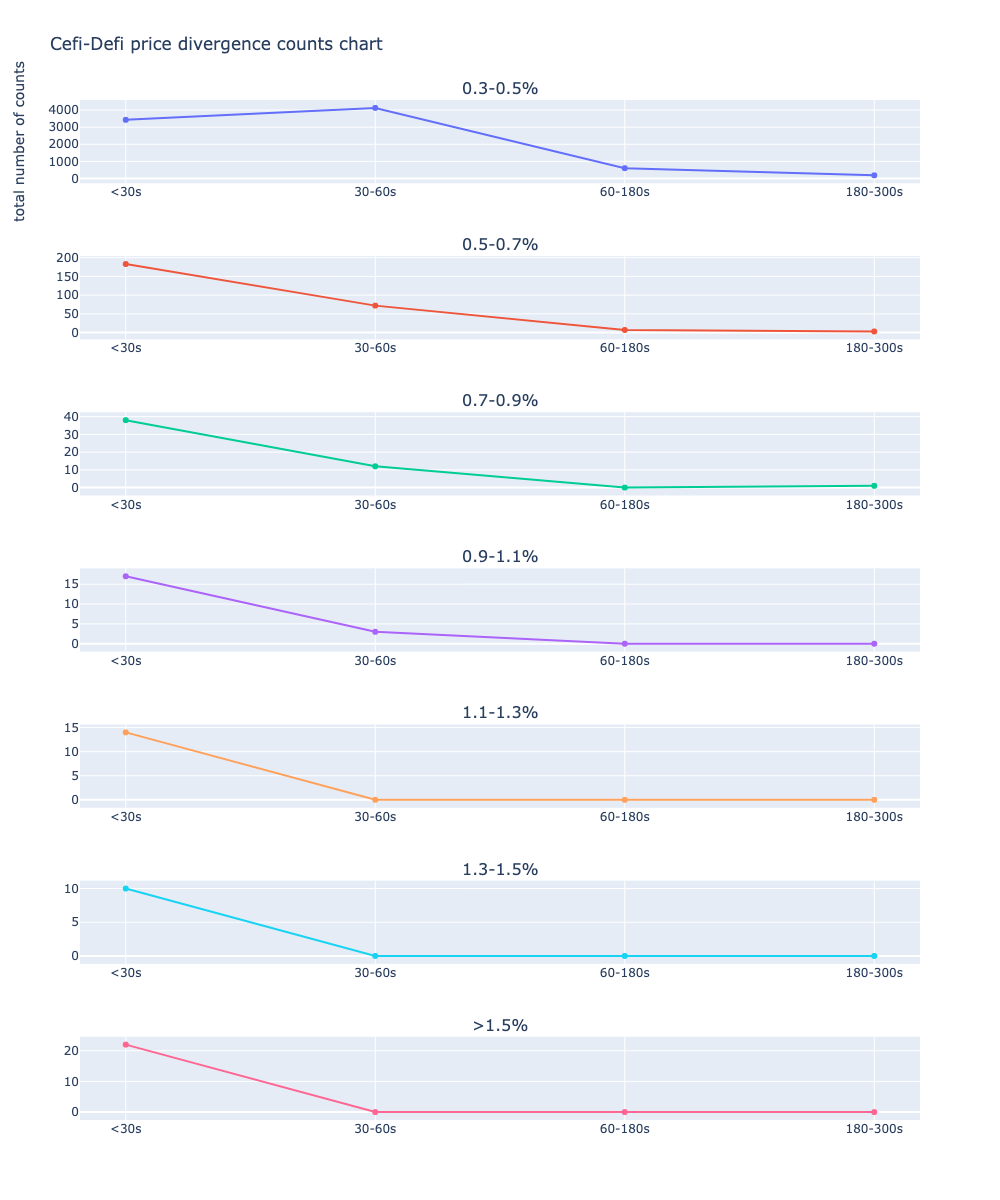 Figures 2.5.1-2.5.7: Number of arbitrages executed during time intervals, separated by the percentage of price differentials.
As shown in the graphs, when the price divergence between a CEX and a DEX is from 0.3-0.4%, the number of arbitrages is very high across all time periods. However, when compared with other price differentials, the chance of earning profit after deducting gas fees and slippage is lowered, making it harder for bots and traders to successfully execute crypto arbitrage trades.
As the price divergence increases to 0.5-0.7%, arbitrage occurrences become smaller, but still comparatively higher than the other percentages. One interpretation of this is that when the price difference passes 0.5% it requires much more sophisticated methods to detect signals as early as possible to conduct the trade and earn a profit. The larger the difference in price is, the quicker advanced traders and companies will swoop in to capitalize, closing the gap in exchanges much faster than if the difference was lower.
As the price differentials between a CEX and a DEX become wider, the total number of arbitrage occurrences gets smaller, and if you cannot conduct the trade within 60 seconds, there is little to no chance of capitalizing on the profit. Setting your threshold to anything below 0.9% may be too optimistic when considering the potential slippage and gas fees, so a threshold above 1.1% may be a safer bet.
Slippage in crypto arbitrage trading
Earlier, we gave an overview of the impact of slippage in crypto arbitrage. Here, we’ll take a explore this further, using Uniswap V2 in our example.
DEX slippage
When arbitraging using a DEX, slippage is a major factor to consider. The higher the TVL of a pool, the less slippage there will be, which means that you are less likely to sacrifice a profit.
As mentioned before, each exchange has its own methods for calculating slippage. Before diving into this, however, we first need to understand how liquidity works on Uniswap V2.
Suppose a pool contains 10 ETH (x) and 10,000 USDC (y). To calculate liquidity (k), we use the constant product formula (x * y = k) to show that k= 10 * 10,000 = 100,000. This means there are 1000 USDC per ETH.
If a user decides to trade 1 ETH in exchange for 1000 USDC, the pool reserve on the ETH side becomes (10+1) = 11. Since Uniswap charges 0.3% for every trade, the ETH count would actually be 11 - (1 *0.003) = 10.997. The USDC reserve would become (10000 - 1000) = 9000, so the k would now equal 98973.
As long as we keep recording the liquidity (k) and each token’s price every time a trade happens, we are able to precisely calculate price slippage and evaluate its impact on our backtesting strategy.
Uniswap V2 slippage mathematical models
Using the Uniswap V2 equation, we calculated slippage and performed a stress test to estimate how many assets we should deploy on the WETH-USDC pool and what our slippage expectations should be.
Given X * Y = K, where x and y are asset pair reserves (from our example, ETH and USDC), and k is the pool liquidity.
K is a constant, so although during a swap x and y may change, k remains the same but may grow slowly since part of the swap fee will be added automatically to the liquidity provider on Uniswap V2.
From this, we can use this formula, where r = 1 - swap fee ( 1 - 0.3%) = 0.997, and △X is the amount we give in exchange for △y, the amount we get.
( x + r△X) * ( y - r△Y) = x * y
The product of asset pair reserves after a swap must be equal to the product of reserves before the swap, which is the definition of the constant product formula.
After some basic algebraic operations, we can use this to calculate the amount we get after a swap of token x to token y (ex. ETH to USDC):
△Y = ( y * r△Y) / ( x + r△X)
Here is how we coded our trading bot using the Uniswap V2 slippage equation. For more detail on using the Uniswap V2 equation to calculate slippage, please check this detailed walk-through.
###############################################
# uniswap v2 swap amount equation function
###############################################

#swap_amount_eth_to_usdc( eth_amountIn = 2,  usdc_reserve = 102819284 , eth_reserve = 27978, fee_tier = 0.003)

def swap_amount_eth_to_usdc( eth_amountIn,  usdc_reserve , eth_reserve , fee_tier = 0.003):

    eth_amountInWithFee = eth_amountIn * ( 1 - fee_tier)

    numerator = eth_amountInWithFee * usdc_reserve
    denominator = eth_reserve + eth_amountInWithFee

    usdc_amount_out = numerator * 1.00 / denominator

    return usdc_amount_out


def swap_amount_usdc_to_eth( usdc_amountIn, usdc_reserve , eth_reserve, fee_tier = 0.003):

    usdc_amountInWithFee = usdc_amountIn * ( 1 - fee_tier)

    numerator = usdc_amountInWithFee * eth_reserve
    denominator = usdc_reserve + usdc_amountInWithFee

    eth_amount_out = numerator * 1.00 / denominator

    return eth_amount_out
Uniswap slippage stress test
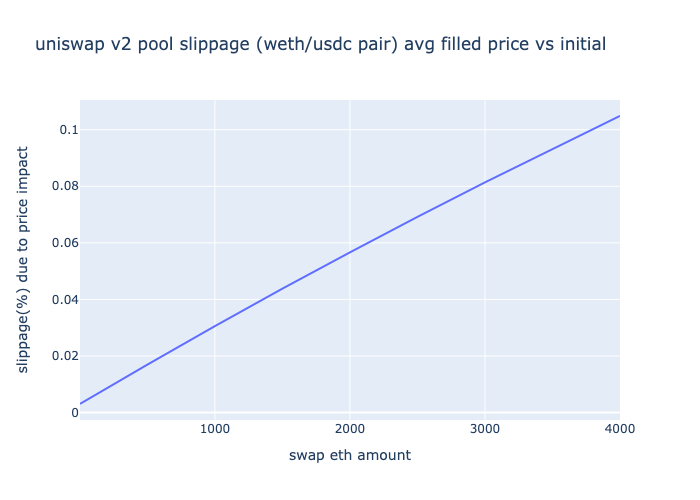
Next, you must perform a Uniswap slippage stress test to understand the price impact on different capital sizes. Slippage stress here refers to the price difference between the original pool price and the price the trade is settled for as a swap amount gets larger.
In order to do this, we simulated a swap of up to 4000 ETH to see the impact on pool slippage. We used the Amberdata API to obtain liquidity data and the equations above to calculate slippage. The graph illustrates that when you swap up to 4000 ETH, you would lose a little over 10% per ETH for the transaction.
Crypto arbitrage trading strategy design
Now that we have properly researched the factors necessary to code our arbitrage trading strategy, we can build our backtest framework. When our bot detects a price differential at or above the parameters we set (ex. 1.2%), it will initiate a trade to execute arbitrage. Using the factors previously explored, the bot will include the Uniswap V2 equation to calculate slippage on a DEX, a slippage rate for a CEX (we are backtesting with 0.1%), and the gas fee cost (backtest with past fees or use a gas fee prediction equation).
When we backtest with our arbitrage trading bot, we are assuming that once the bot detects the price difference, it will immediately calculate the current slippage and gas fees, and take profit when the price converges. However, in a real-world trading scenario, your bot will need to compete with others and be the first to both detect signals and get your transaction validated. This may cause higher slippage and gas fees. Thus, this simulation is for educational purposes and would require considerations for a more accurate analysis of cost.
Based on the assumptions mentioned above, we back-tested our strategy for a month to see how it performed. Please refer to our Github here.
Exchange: Uniswap V2
Selected Pair Address: 0xb4e16d0168e52d35cacd2c6185b44281ec28c9dc (USDC-ETH 0.3%)
Test Period: May 15th 00:00 - June 12th 00:00 2022
Post arbitrage trade analysis
Below is a list of all arbitrage trades placed during our backtest. The price diff (%) column was used as the signal to initiate a trade. We set our trade signal at 1.20% and our bot only placed arbitrage trades when the price differential was above this. The average filled CEX price and average filled DEX price was the price of the trade after slippage was calculated.
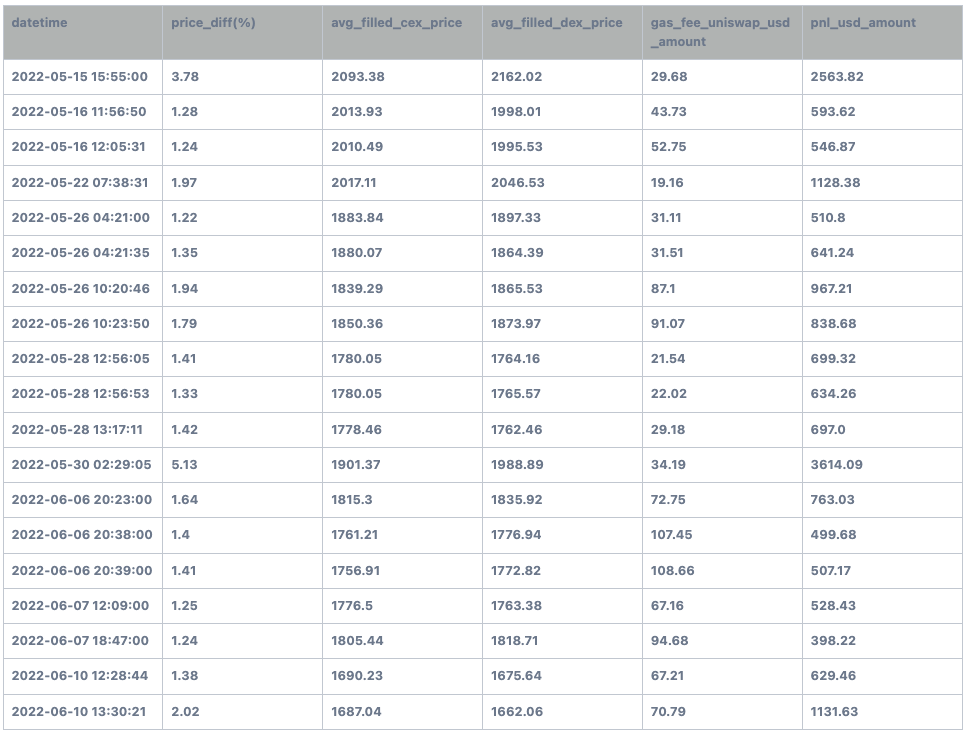
Figure 4.1.1: Backtested arbitrage trades
Below are two bar charts showing the total Proft or Loss (PnL) per trade and their corresponding Uniswap fees and gas fees (USD).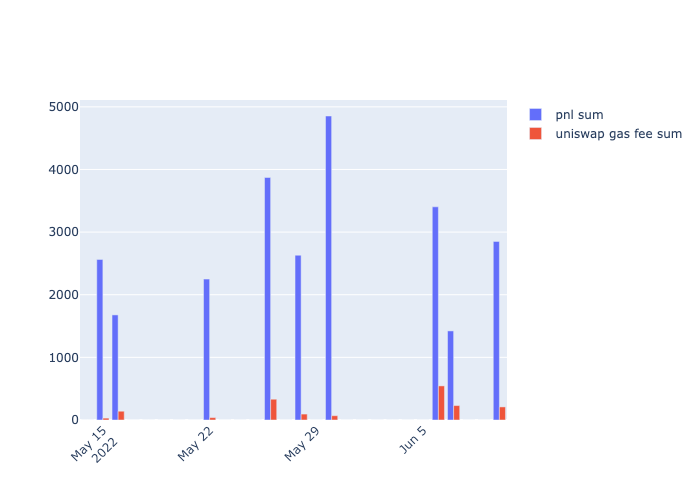
Figure 4.1.2: The PnL sum compared to the Uniswap V2 gas fee sum in USD.
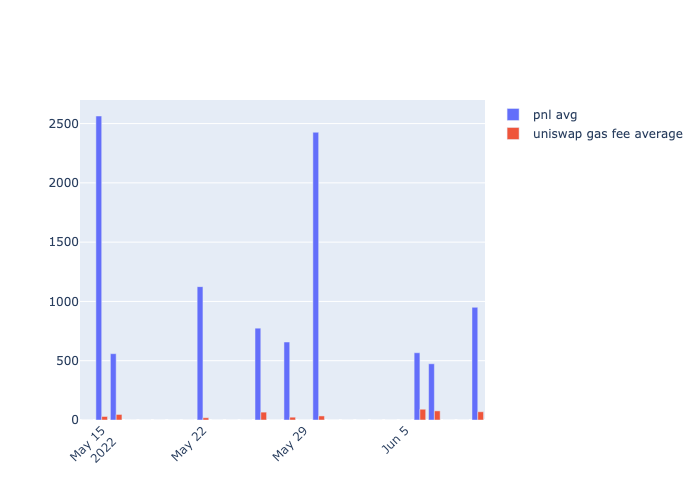 Figure 4.1.3: The PnL average compared to the Uniswap V2 gas fee average in USD.
There are a few takeaways from the table and graphs. As you can see from the 2022-05-30 02:29:05 trade, our most profitable trade did not have a high gas fee nor did the second highest one (2022-05-15 15:55:00). Looking at the rest of the arbitrage trades, we can find that a higher PnL does not always come with a higher gas fee. As long as the market is moving within a reasonable range, traders attempting crypto arbitrage shouldn’t have to worry too much about paying large sums for gas.
Out of 28 days, only 9 days submitted arbitrage trades. The holding period was no more than five minutes per trade, indicating good efficiency as you could potentially incorporate another trading strategy to make the best use of your capital. Additionally, most of our trades occurred when the market was falling fast. Looking at May 26, the price of ETH fell 15% in a very short period of time, and our bot was able to place four trades in just a few hours. June 6 was similar as well—our bot placed three trades in just ten minutes! Clearly, volatility is an arbitrageur’s friend.
Amberdata crypto arbitrage trading performance dashboard
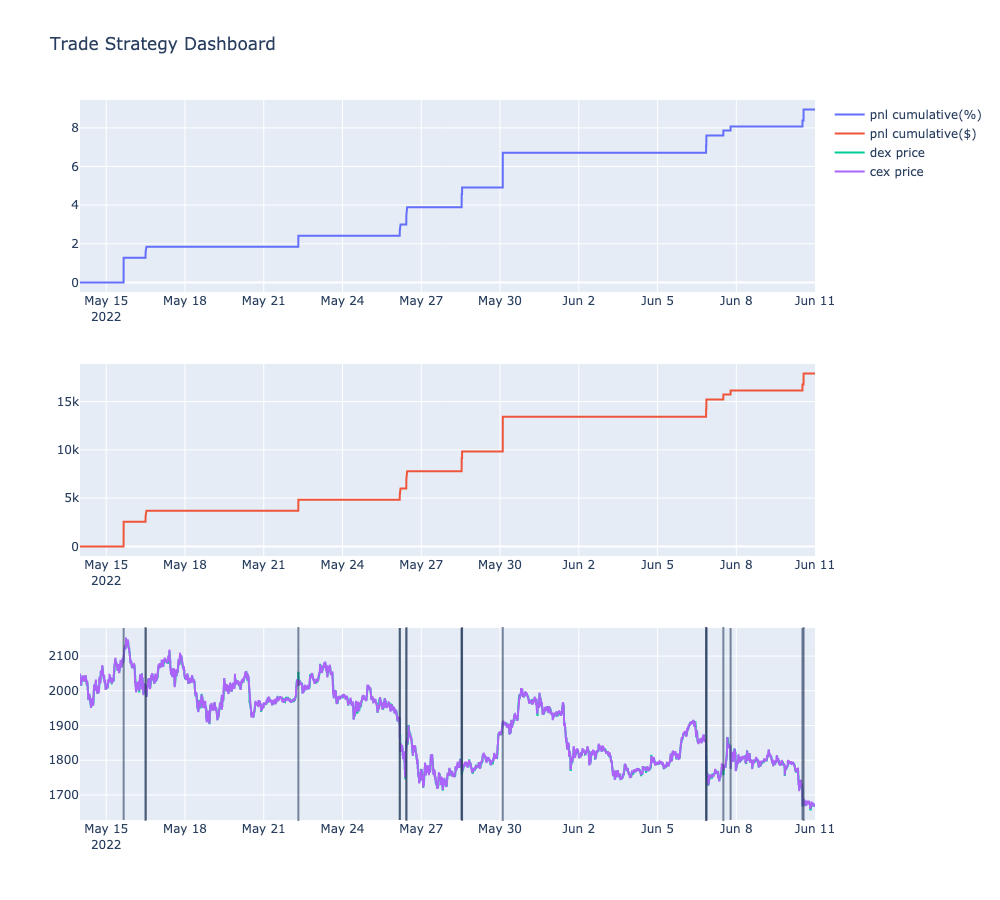 Figure 4.2.1-4.2.3: 1. The profit percentage over time; 2. The cumulative profit over time; and 3. The DEX price of the pair we arbitraged (USDC-ETH) on Uniswap V2, and the CEX price of ETH. Note: The DEX and CEX lines are extremely close together, and the gray lines indicate times when executed arbitrage.
Overall arbitrage trading statistics
Looking at the dashboard, we can see that the total PnL was an 8.5% return on the two hundred thousand ($200,000) USDC deployed. During the month selected, our arbitrage trading bot placed a total number of 19 trades over 28 days. The most profitable trade was on May 30, 2022, when the price difference between the CEX and the DEX was 5.1%. The bot made about 1.8% in total, but in reality, our profit would have likely been smaller as we would be competing heavily with other bots. Additionally, as your capital size grows, slippage (especially on a DEX) would affect potential gains heavily.
The average profit per trade was about $941, which is 0.4% compared to our capital size. Our Sharpe Ratio was 10.14, which means our method was a low-risk, high-profit strategy. However, the Sharpe Ratio does not reflect the liquidation risk when borrowing both on CEX and DEX or the potential risk of gas fee competition to get your trade validated.
We also included the Sortino ratio and the System Quality Number in our code, but since our trades were specifically arbitrage and did not lose any money we will not show it here.
Summary and Conclusion
This is the first essay in our research series leveraging the Amberdata API to explore the DeFi ecosystem.in
To build a successful crypto arbitrage strategy, we explored several different factors and considerations. Slippage on a centralized exchange requires analyzing order book depth and the liquidity available at certain price levels, while DEX slippage requires a constant product formula to ascertain the liquidity (k) of a pool.
In order to avoid losing money to gas and swap fees, it’s also important to research the optimal time windows for crypto arbitrage and the price differentials.
Once you have all of this information, you can set your arbitrage trading threshold. If you continue to monitor these metrics and lending protocol factors, you will be able to build a successful arbitrage trading strategy.
Our backtested trading strategy placed 19 trades over 28 days and earned an 8.5% return on capital in one month. Most of our trades occurred when the market was unstable, and multiple trades can be placed within the same day or even the same hour when volatility is high. We also discovered that the gas fee is not necessarily high when there is a reasonably wide price gap.
Our strategy assumed that our bot could spot the price deviation early and calculate slippage and gas fees instantaneously. In real-world scenarios, however, you will be competing with others to get your transaction validated as soon as possible, which may cause higher slippage and gas fees.
Thanks to the permissionless design and multi-chain ecosystem, the ever-changing DeFi space is exciting and full of potential. While frustrating, market fragmentation and inefficiencies open up the door for arbitrage trading and allow advanced traders to capitalize on the differences in centralized and decentralized exchange mechanisms. Arbitrage on a CEX and DEX only touches the tip of the iceberg - it is possible to take advantage of cross-chains and other protocols.
Our full trading strategy and backtested code can be found here. We hope this crypto arbitrage trading tutorial was informative, and keep an eye out for our next essay on liquidity provider strategy.
To learn how Amberdata's Crypto Market Data API can help your organization implement sophisticated crypto arbitrage trading strategies, request a demo.
APPENDIX
1. Strategy Code
- Github: check here
2. DEX price info:
- API: check here
- Exchange: Uniswap V2
- Selected Pair Address: 0xb4e16d0168e52d35cacd2c6185b44281ec28c9dc (USDC-ETH 0.3%)
3. CEX price info:
- API: check here
4. Historical Gas fee tracker
- API: check here
Reference:
https://betterprogramming.pub/uniswap-v2-in-depth-98075c826254
DISCLAIMER: The information provided in this research is for educational purposes only and is not investment or financial advice. Please do your own research before making any investment decisions. None of the information in this report constitutes, or should be relied on as, a suggestion, offer, or other solicitation to engage in, or refrain from engaging in, any purchase, sale, or any other any investment-related activity. Cryptocurrency investments are volatile and high risk in nature. Don't invest more than what you can afford to lose.
