Share this blog:

Introduction to crypto order books
Order books are a familiar concept for those who have trading experience. However, they are often overlooked as a metric used for forecasting, more often used as a generic metric for gauging market prices between buyers and sellers. Hidden in the depths of the crypto order book, figuratively and literally speaking, are many buyers and sellers willing to trade an asset at a defined price via a “limit order”.
Limit orders are resting orders placed on an exchange to buy and sell an asset at a selected price. The orders rest on an exchange and remain pending orders until a market participant on the opposite side of the transaction fills the order at the agreed-upon price.
Beyond the current market price, traders can use order book data, such as limit order data, to determine the supply and demand for a particular asset. Gauging market depth allows market participants to hypothesize whether an asset, short-term or long-term, is likely to move in a specific direction based on willing buyer and seller activity.
Regarding the data side of the order book, it is possible to extrapolate the data as a time series to view historical limit order changes. Extrapolating this data and converting it to a heatmap allows us to view the price and size for select cryptocurrency pairs across any exchange.
Crypt order book heatmap explanation
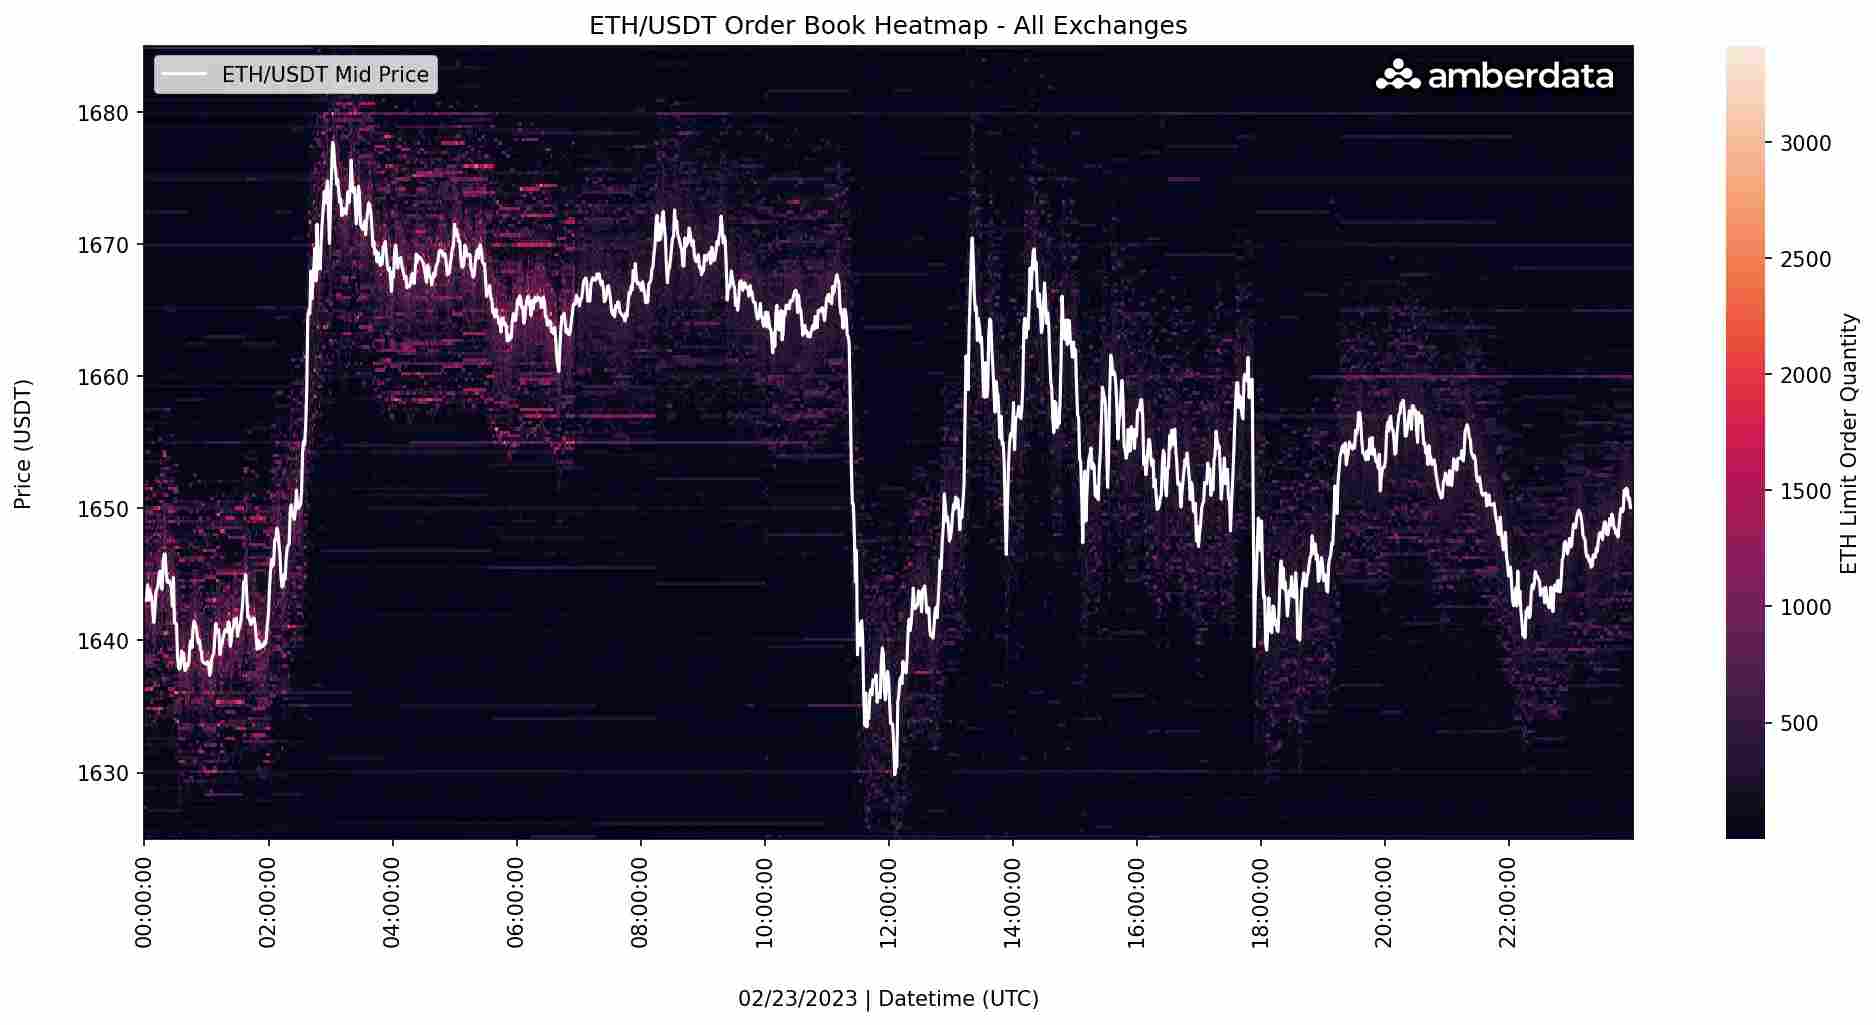
In this example, we’re looking at the spot ETH/USDT Order Book Heatmap for a single day across all centralized exchanges. Even though the heatmap looks complicated, it is quite simple.
The y-axis depicts the price of ETH/USDT, whereas the x-axis indicates the passage of time. The mid-price for ETH/USDT on Binance is represented by the white line, whereas the color coding represents the size for a given order on a 25-basis point interval. Lighter colors indicate a higher volume of orders placed at a given price, while darker colors indicate a lower volume of orders. The order book heatmap can be used as a visual to gauge supply and demand over time.
Similar to support and resistance, the different order book “levels” can be used as a metric to determine how the mid-price will change in the future. For example, in the event of a substantial volume of sell orders being present in the order book at a particular price across all centralized exchanges, it is reasonable to assume that there will be a significant amount of downward pressure on the price. As a result, the mid-price is expected to remain below the level of the resting sell limit orders during that time.
While the heatmap provides a visual representation of the order book, it’s important to consider that the order book heatmap also provides a decent gauge to market liquidity. The liquidity of the order book is determined by the cumulative quantity of orders available across all prices.
The order book heatmap across all centralized exchanges provides a comprehensive understanding of the prices at which cryptocurrency pairs are bought or sold. This approach of aggregating the order books from all centralized exchanges offers a similar view as in traditional financial markets, where a unified order book displays the levels of orders from all participating centralized exchanges.
Exchange comparison between order book heatmaps
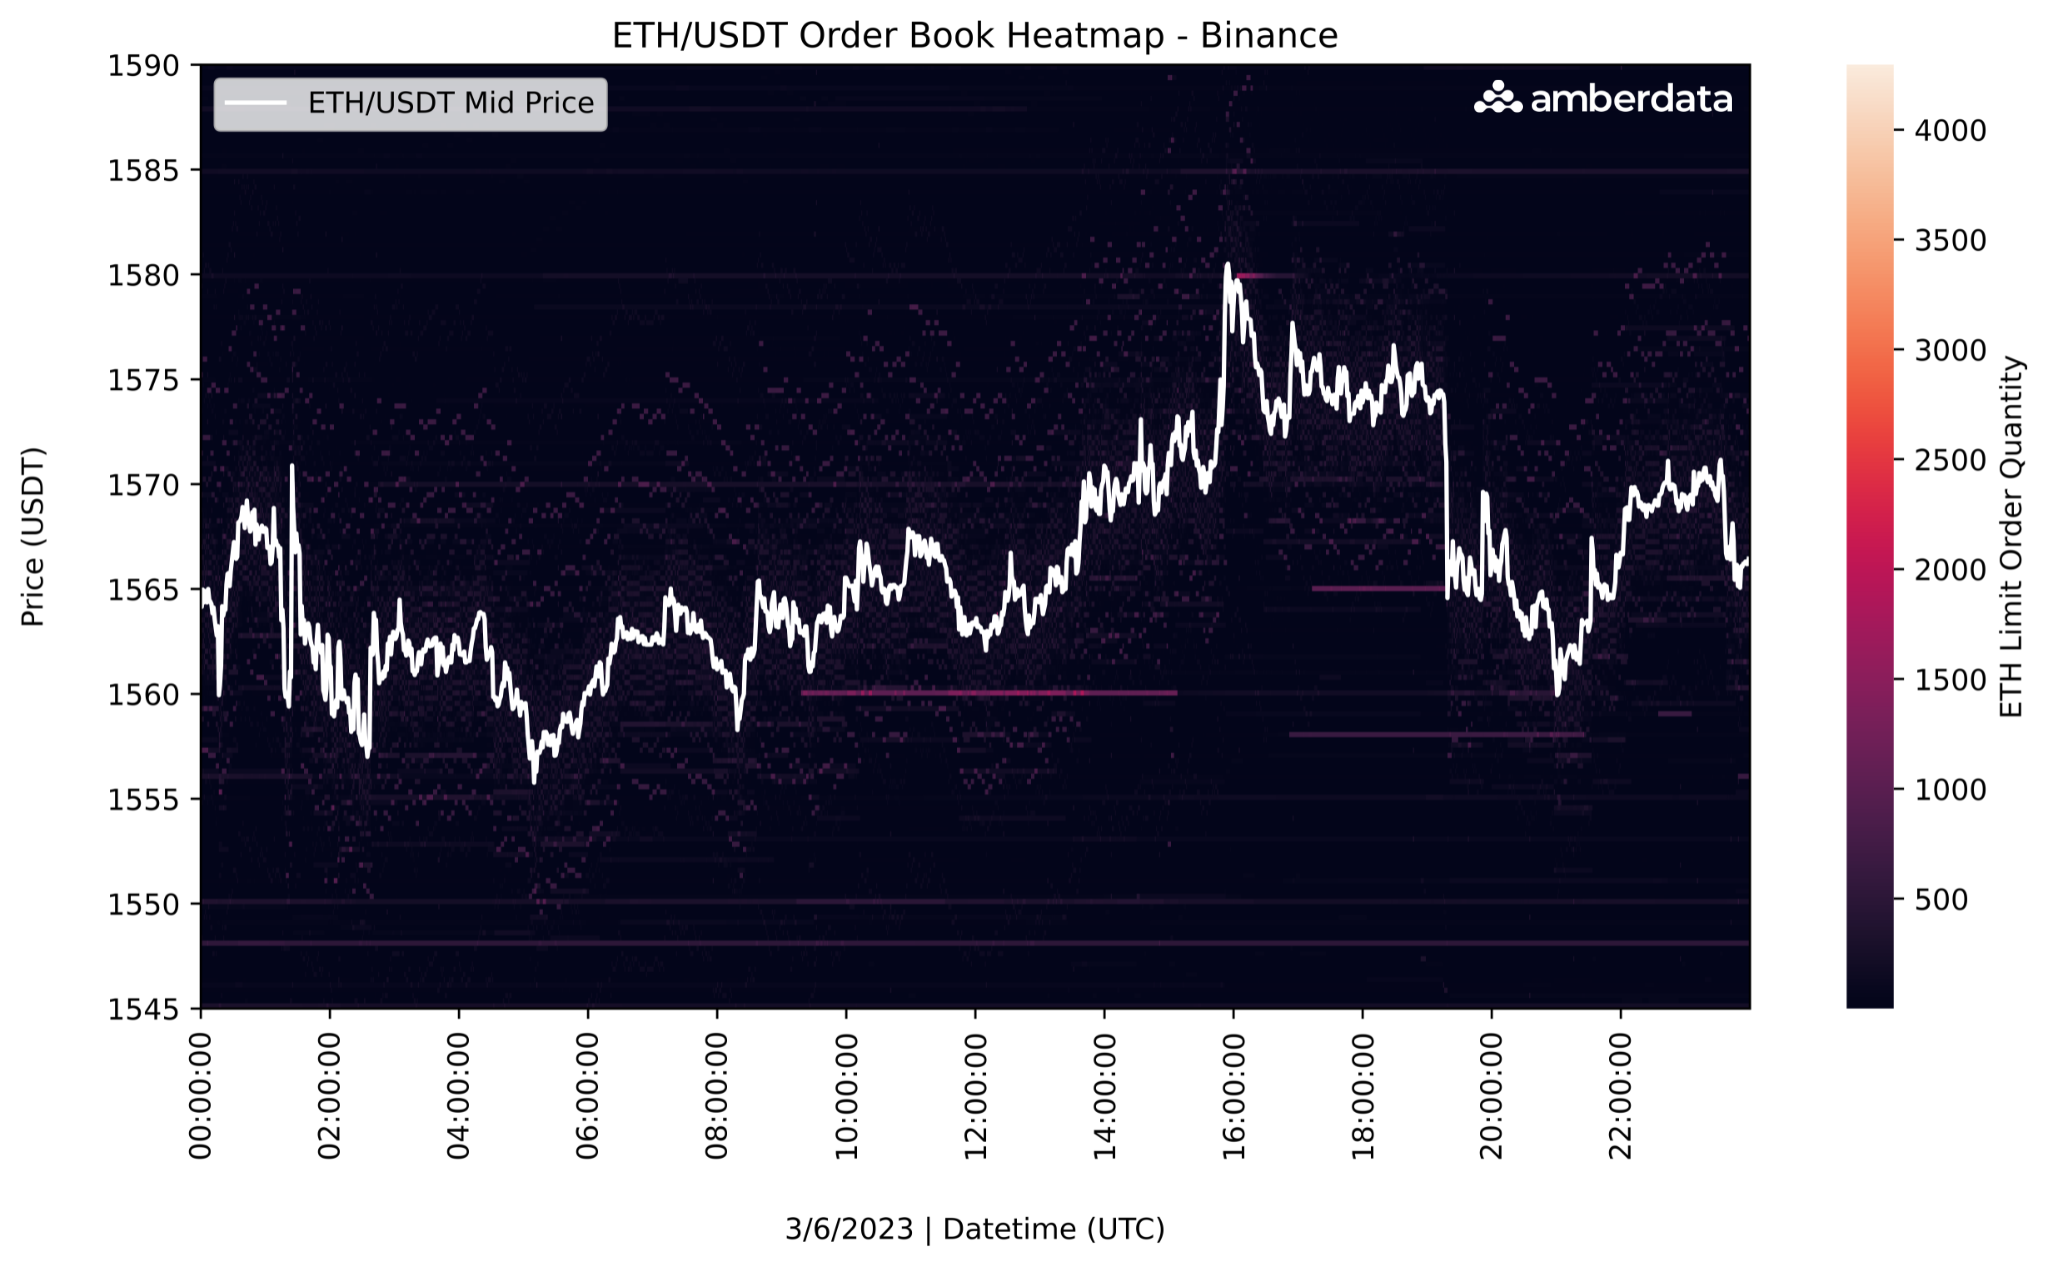
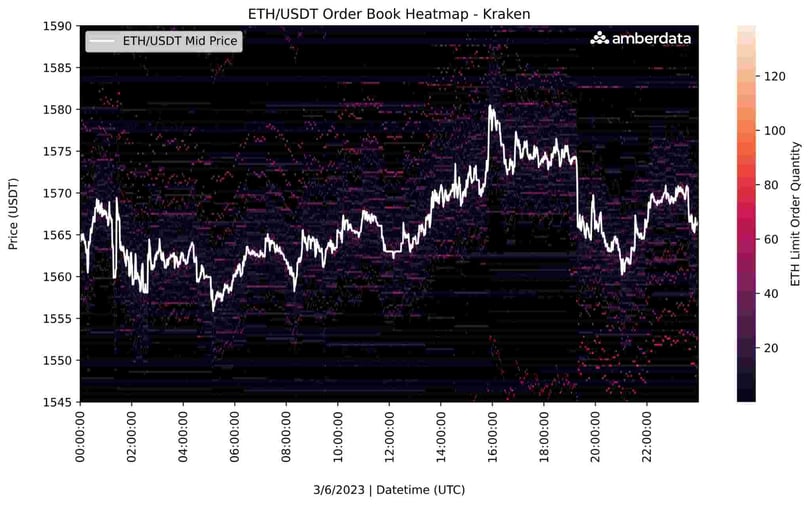
When comparing order book heatmaps from different centralized exchanges on an individual basis, it’s important to consider several key factors that may impact the quality of the information. First and foremost, liquidity is very important when gauging an order book heatmap. The level of liquidity on a centralized exchange could drastically impact how the information is received, given that the order book might not offer complete order book depths (percent distance from mid-price).
For example, in the figures above, clearly, Binance exchange is more liquid, given that it generally has a higher quantity of orders placed in the order book. Whereas, Kraken is less liquid with a lower quantity of orders placed in the order book.
It's worth mentioning that not all traders are necessarily engaging in unhedged buying or selling of the underlying cryptocurrency. The market participants who have resting limit orders may serve as market makers or might place orders to hedge their positions, which may not greatly influence market depth. As an example, a derivatives trader who has a net short position may use a limit buy order placed at a far-off price in the centralized exchange's order book to hedge their position.
Introducing trade order flow
Trade order flow, like an order book, indicates the transactions made between buyers and sellers on an exchange at a specific price. However, rather than representing resting limit orders on an exchange, trade order flow refers to the executed prices in which a cryptocurrency was exchanged (a realized purchase or sale for a specific price).
For example, the "last traded price" or "market price" is a recorded data point that represents the price at which a cryptocurrency was traded. This information helps to assess the trade order flow, as it logs whether the transaction was on the buy or sell side, as well as the amount of the currency that was traded.
Trade order flow can provide insights into market sentiment and can help market participants make informed decisions. Additionally, players can use order flow to identify potential trends and price movements. Order flow can be compared to a puzzle piece, since it provides a valuable piece of information, but doesn’t show the entire picture. In order to visualize the significance of the individual puzzle piece, the order flow data must be extrapolated into a more descriptive and granular dataset to view the majority of the puzzle.
Introducing cumulative volume delta
Cumulative Volume Delta (CVD) offers a more comprehensive view of order flow sentiment compared to trade order flows alone. CVD provides a cumulative view of the net buying and selling pressure of the market, which is not easily obtainable from lone trade order book data.
CVD helps to determine the dominance of buyers or sellers in the market by analyzing whether the nominal value is positive or the normalized percentage is high. This concept will be explained in more detail in the next section.
To solve more pieces of the order flow puzzle, CVD can be separated into categories based on order size. The different order size categories typically indicate the type of market participant involved in buying or selling an underlying currency, such as retail or institutional transactions. The purpose of differing retail from institutions in CVD offers unique insights on retail and institutional market sentiment. For instance, if retail CVD is negative and institutional CVD is also negative, overall market order flow sentiment is likely negative.
Cumulative volume delta and normalized cumulative volume delta percentage calculation
CVD measures the cumulative delta between the volume traded by buyers and the volume traded by sellers at each price level. For instance, for a given time interval, if the buy volume was +1,000 and the sell volume was -500, then the volume delta for that period would be positive, indicating a period of aggressive buyers. Should the values be reversed, the volume delta would be negative, indicating aggressive sellers. To obtain the cumulative volume delta, the sum of all volume delta values up to the current period is calculated.
Below are the formulas for calculating CVD and normalized CVD percentage. CVD is calculated by summing up the difference between the volume of all buys (Vbi) and sells (Vsi) for each period (i) up to the current period (n).
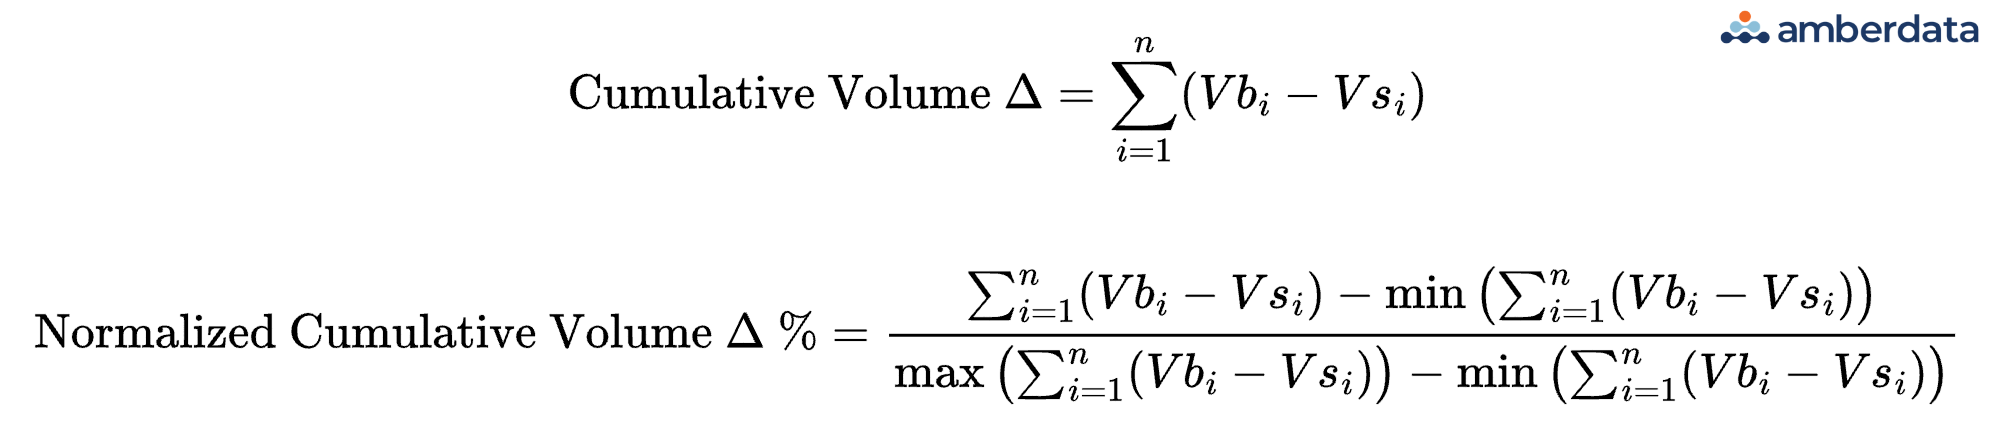
Normalized CVD is calculated by taking the sum of all the CVD and then subtracting the minimum value of the CVD. This result is then divided by the range (difference between the maximum and minimum values) of the CVD. The result is expressed as a percentage. The normalized CVD percentage is used to provide a standardized view of market sentiment. By converting the CVD into a percentage, it makes it easier to compare market sentiment for different order book sizes across exchanges.
Cumulative volume delta analysis
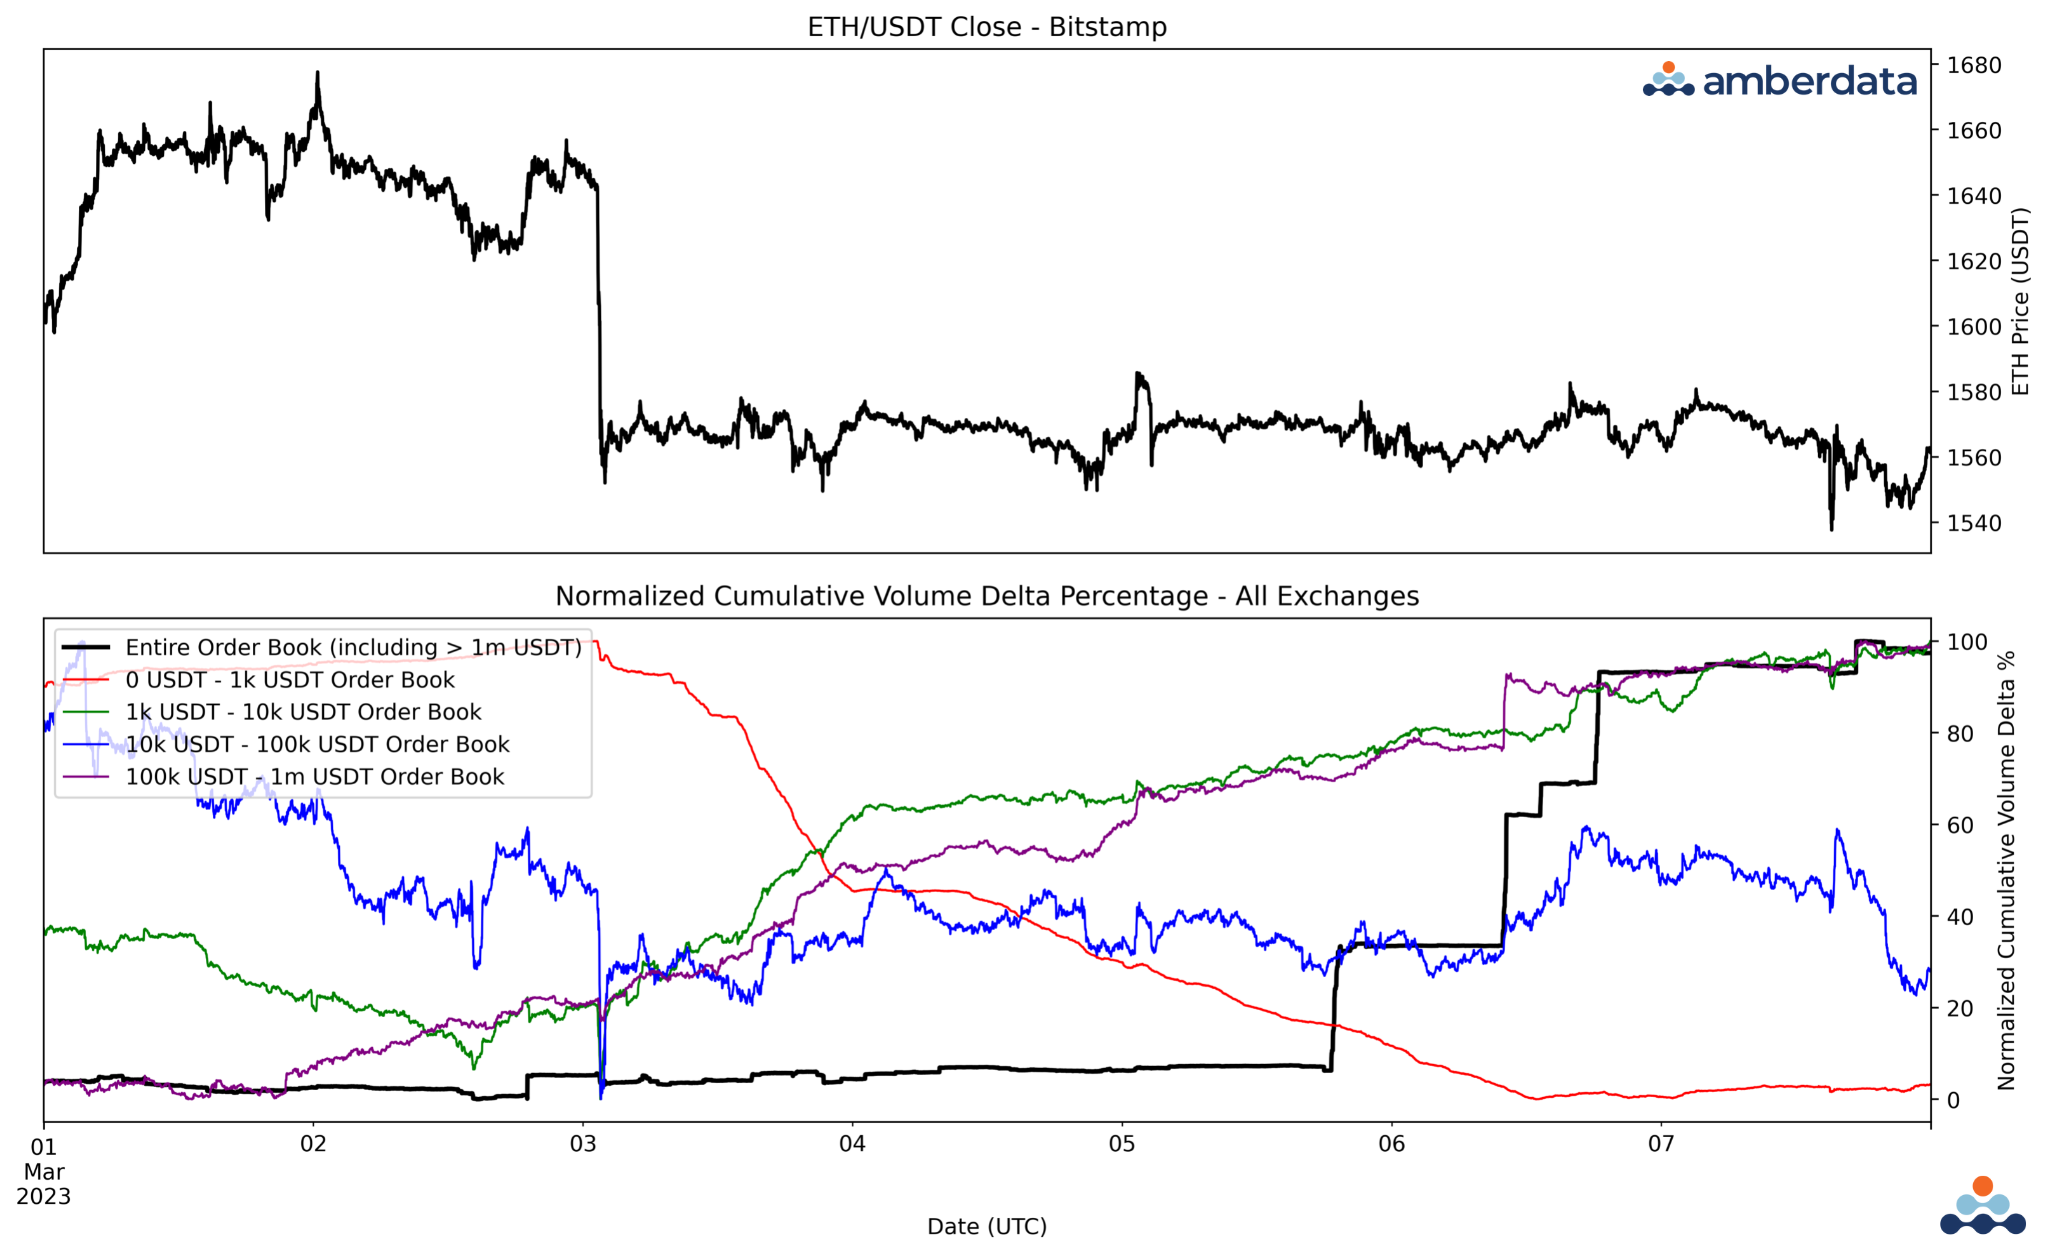
In the upcoming examples, normalized CVD and CVD are aggregated across all centralized exchanges and plotted with spot ETH/USDT on 1-minute frequencies. The time series begins on March 1, 2023, and ends on March 7, 2023, in UTC time. The first example below depicts the ETH/USDT 1-minute closing price on Bitstamp, with ETH price in USDT on the y-axis and time on the x-axis. On the subplot below the ETH/USDT closing price, normalized CVD is plotted on the y-axis against time on the x-axis. On the normalized CVD percentage plot, each distinct line with a different color represents the normalized CVD percentage of different order sizes. The smaller the order size, the higher the likelihood that the normalized CVD is retail order flow. Whereas, the larger the order size, the higher the likelihood that the normalized CVD is institutional order flow.
 v
v
In this normalized CVD plot, there is a significant amount of data to analyze. A key observation is that the retail order flow (represented by the 0 - 1k USDT order flow line) has consistently been decreasing since the downturn on March 3rd. On the other hand, the institutional order flow (represented by the 10k USDT and above order flow lines) has been increasing. Based on the recent trend of the ETH/USDT 1-minute closing price on Bitstamp, it appears that many institutional players are taking advantage of the recent dip and purchasing ETH/USDT, while retail market participants are remaining stagnant and showing a negative sentiment. However, given that the normalized CVD adjusts CVD on a relative percentage basis, it doesn’t paint the full picture of the magnitude of retail vs. institutional order flow. Rather than plotting normalized CVD, the next example plots CVD on a nominal basis.
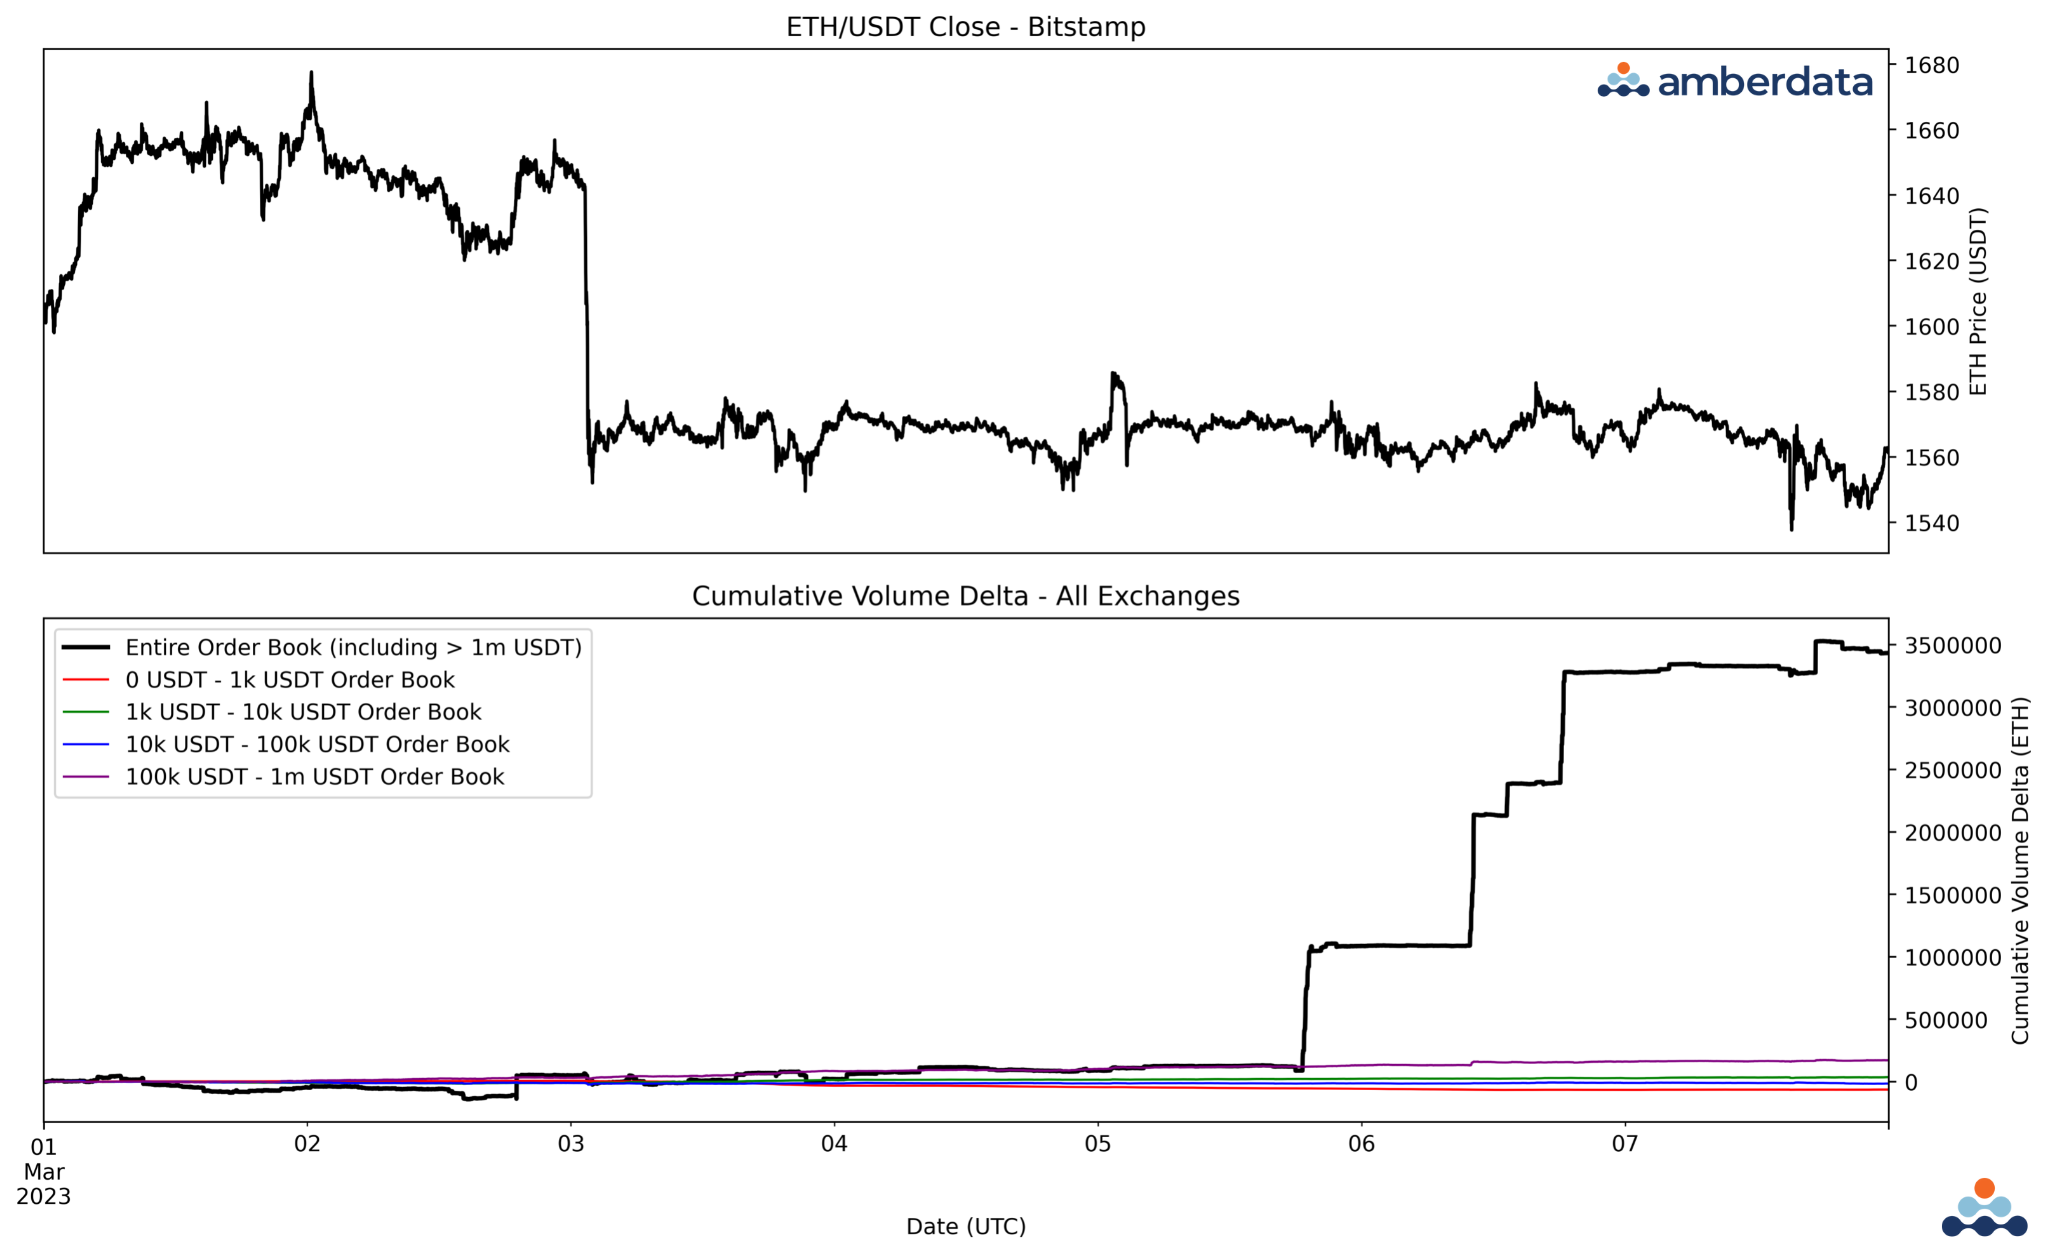
In this nominal CVD plot, the entire order book flow is extremely positive, with institutional orders powering against cumulative orders in the order book. Likely, each of the lumps in CVD flow are positions traded in the millions of dollars. Unlike the previous plot, where normalized CVD was plotted instead of nominal CVD, the significance of the entire order flow activity would’ve been dismissed. The presence of a substantial amount of positive order flow activity, estimated to be around $500 million, suggests that many institutional market participants are taking advantage of the current ETH/USDT prices and buying, while the behavior of retail traders remains uncertain. Additionally, it’s important to note that the positive order flow could be resting limit orders with partial fills. As a result, these figures could appear more significant in CVD than in reality.
Cumulative volume delta and order book data for market analysis
Order book and trade order flow provide valuable insights into liquidity, market sentiment, and trends. Order book heatmaps provide a visual representation of the supply and demand for an underlying cryptocurrency, while trade order flow provides detailed information on retail and institutional buyers and sellers. It’s important to consider liquidity when comparing order book heatmaps from different centralized exchanges, given that each exchange might offer less significant insights if the exchange is less liquid. Additionally, cumulative volume delta (CVD) offers a more comprehensive view of order flow sentiment compared to lone order flow. Market participants can use both order book heatmaps and CVD data to better gauge market sentiment and directional analysis to make more informed decisions.
To download the report, click here.
