Share this blog:
.png)
Our comprehensive weekly coverage of price action and volatility, trading volumes and market structure (orderbook depth/spreads), derivatives markets (open interest, funding rates, long/short positioning, term structure/basis), institutional flows (Bitcoin ETFs, stablecoin supply across chains), and DeFi credit markets (lending protocol TVL, utilization, liquidations).
News
- Bitcoin Suffers Worst Day Since November Peak: BTC fell 6–8% on Monday to briefly under $84k, capping a 17% November drawdown and leaving prices 30%+ below October's all-time high. Selling was driven by broad risk-off sentiment, Japan rate-hike fears, and heavy long liquidations—the largest single-day drop in nearly a month before a modest Tuesday relief bounce.
- Strategy Slashes Guidance, Creates Cash Reserve: MicroStrategy-style Bitcoin treasury company Strategy cut its 2025 forecast from $24B projected profit to a wide range centered around breakeven, warning of potential multi-billion-dollar losses if BTC doesn't recover. Separately, the firm raised $1.44B in cash to fund 12–24 months of dividends and signaled it might sell BTC if market NAV drops far enough—a notable shift from pure HODL strategy.
- Vanguard Opens Door to Crypto ETFs: After years of resistance, Vanguard will now allow clients to trade spot crypto ETFs from rivals including BlackRock, Fidelity, and Bitwise. The policy shift gives Vanguard's $10–11T client base regulated crypto access without launching proprietary funds—a significant expansion of institutional distribution channels.
- BlackRock: Bitcoin ETFs Now Most Profitable Product: A BlackRock executive revealed that iShares Bitcoin products have become the firm's top money-maker, underscoring the economic importance of BTC ETFs to major asset managers even as flows have turned choppy. The disclosure highlights how deeply embedded crypto has become in traditional finance.
- China Reiterates Crypto Crackdown, Flags Stablecoin Risks: The People's Bank of China renewed its vow to crack down on illegal crypto activities, highlighting AML/KYC gaps and systemic concerns around stablecoins. The hard line continues even as mining has quietly resurged domestically and Hong Kong rolls out a separate, more permissive regulatory regime.
- UK Confirms 2026 Crypto Tax Reporting Framework: Following the UK Budget, HMRC and Treasury confirmed that from January 1, 2026, exchanges must report detailed customer and transaction data under the OECD's Crypto-Asset Reporting Framework. The mandate tightens compliance requirements for UK-linked traders and aligns with global regulatory convergence efforts.
Market Analytics
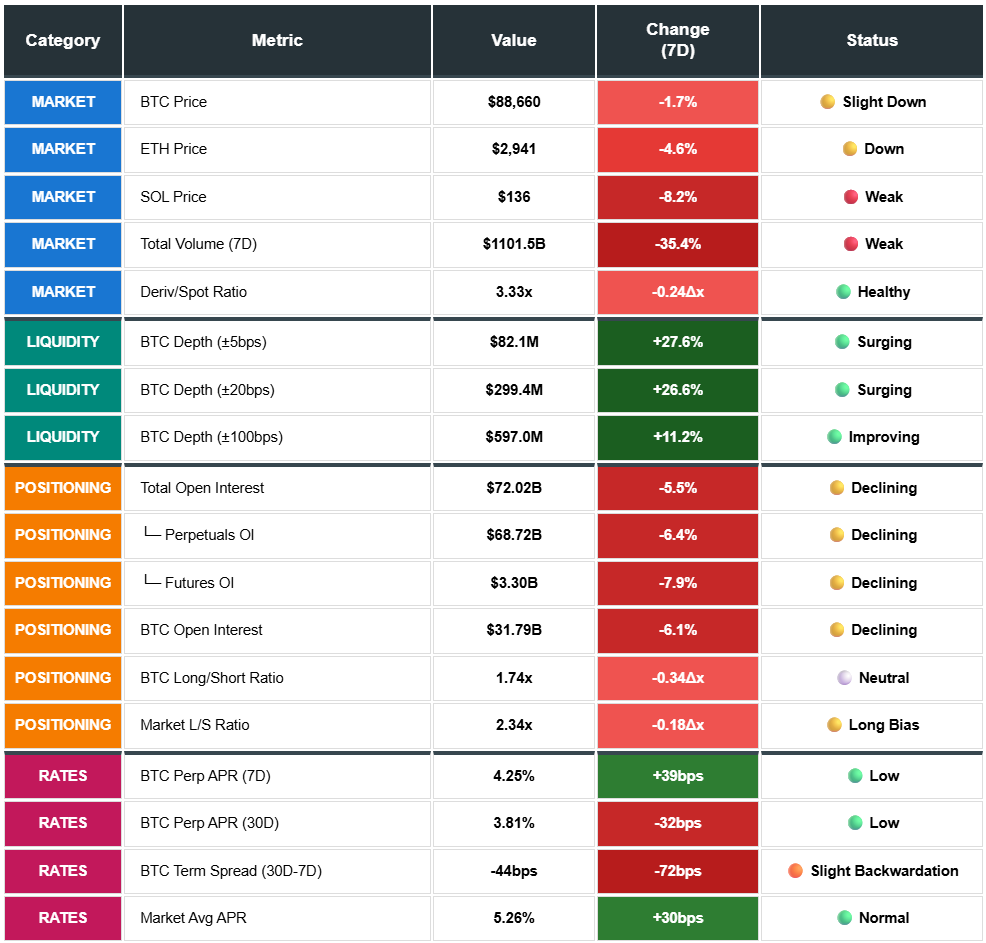
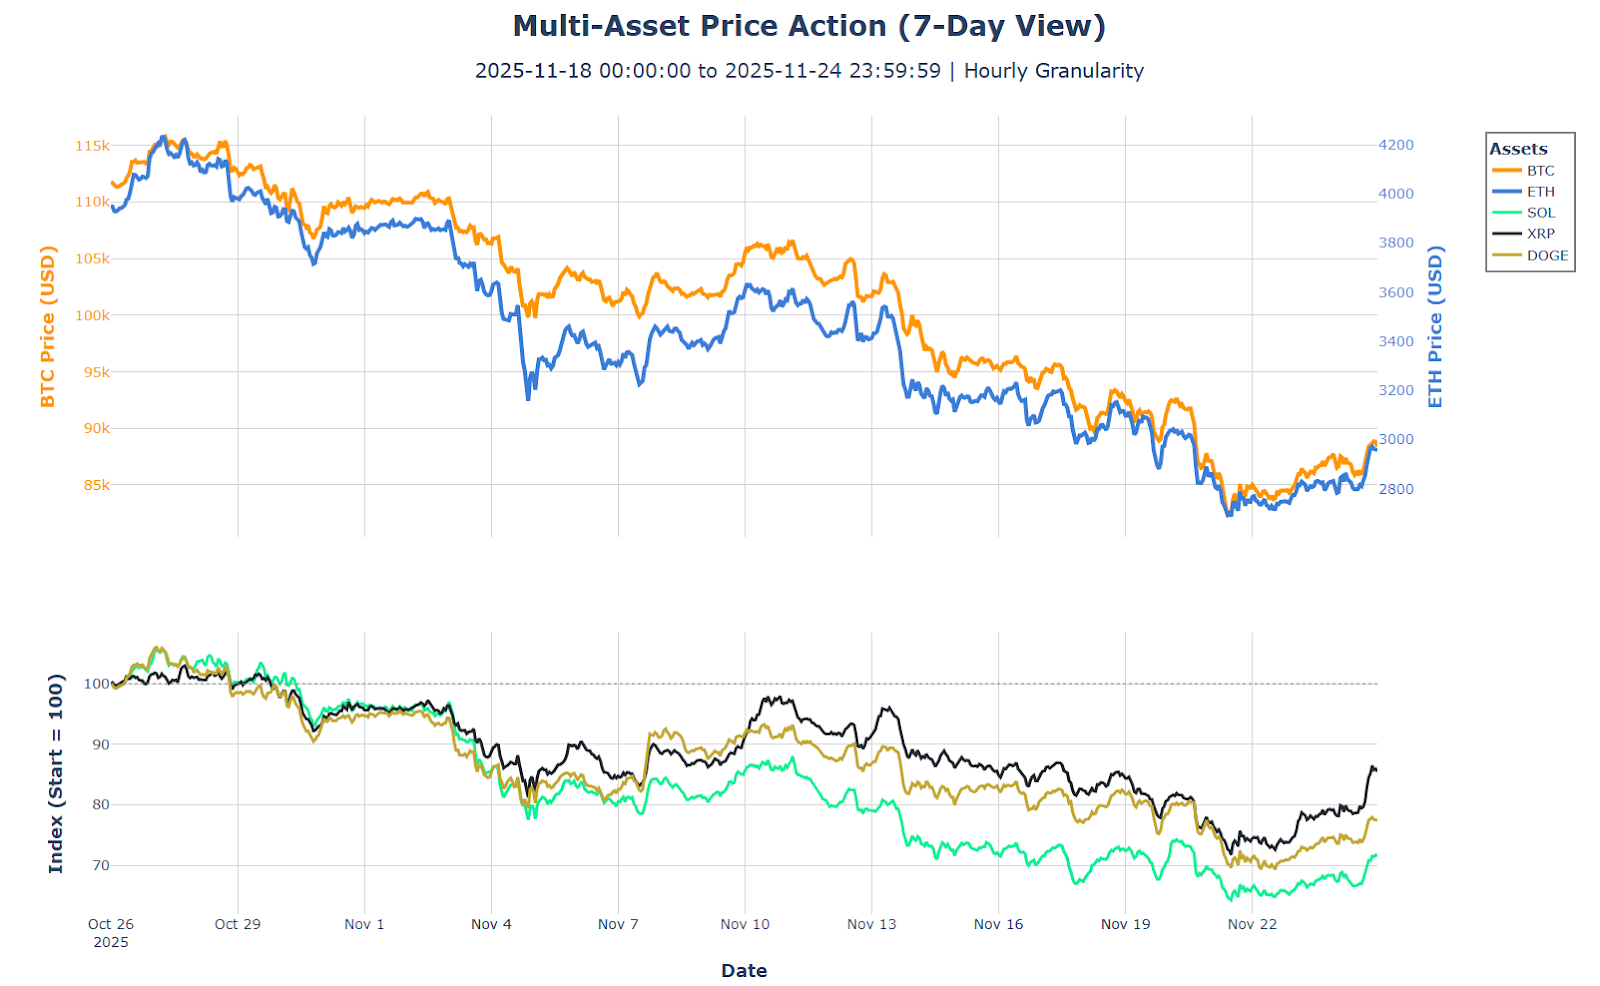
Late-Stage Deleveraging with Early Stabilization Signals: Digital assets extended weakness with BTC declining 1.7% to $86.2k, ETH -4.6% to $2,798, and altcoins amplifying losses (SOL -8.2%, XRP -9.3%, UNI -10.6%). Total volume collapsed 35.4% to $1.10T—largest weekly decline in months—as derivatives/spot ratio compressed to 3.33x. Open interest fell $4.16B (-5.5%) to $72.0B, slowest weekly decline in three weeks. Volatility normalizing from extremes: BTC 48.4% (vs 65.9% prior), ETH 67.8% (vs 89.5%). Price weakness moderating while leverage unwind continues at measured pace.
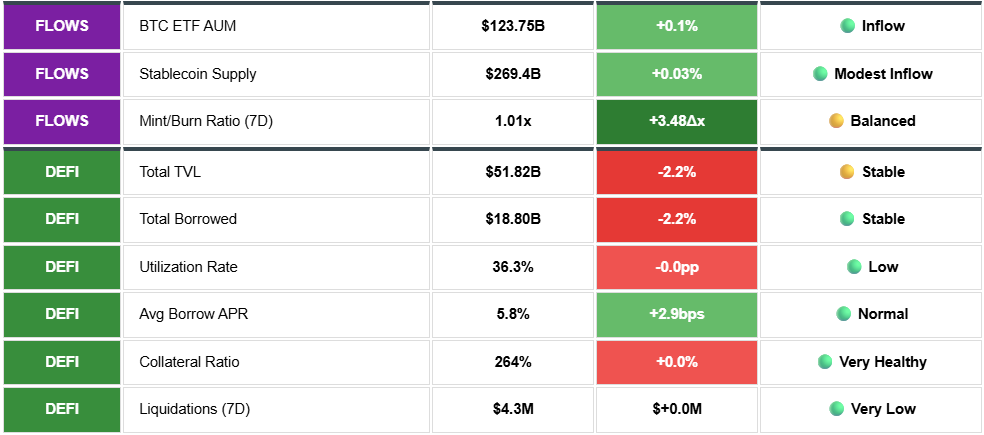
Institutional Flows Inflecting Positive: Bitcoin ETFs recorded first weekly inflow in a month at +$63.0M with Fidelity leading (+$254.5M) while BlackRock outflows decelerated 86% to -$149.5M. Stablecoins reversed to +$90.3M mints from -$315M burns, with institutional stables (USDS +$375M, PYUSD +$156M, USDC +$45M) leading while USDe continued -$273M deleveraging. Combined capital flows turning positive for first time since early November—coordinated signal across ETF, stablecoin, and DeFi channels suggesting institutional re-engagement beginning.
Funding Capitulation, Positioning Divergence: Market-wide funding collapsed to -0.22% (-29.9% annualized)—first negative reading this cycle indicating shorts paying longs across aggregate. BTC/ETH remain positive but compressed (0.15%, 0.22%). BTC long/short ratio normalized to 1.74x (below 2.0x for the first time in weeks), while SOL crowding intensified to 3.76x (+0.28) and XRP surged to 2.85x (+0.36). Majors deleveraged and balanced; alts remain dangerously crowded with cascade risk if support breaks.
Liquidity Resilient, Credit Stabilized: BTC orderbook depth surged +27.6% at tight levels to $82.1M (±5bps) with spreads holding 0.01-0.02 bps—institutional-grade execution maintained through volatility. DeFi liquidations collapsed 97% to $4.0M from $139.3M prior as credit stress resolved. TVL contraction moderating (-2.2% weekly vs -17.4% 30-day), utilization stable at 36.3% with $33B available capacity. Market infrastructure is healthy despite positioning stress in select alts.
Forward Outlook: Multiple stabilization signals emerging simultaneously—ETF inflows reversing, stablecoin minting resuming, liquidations normalizing, volatility compressing, BTC positioning balanced. However, altcoin crowding (SOL 3.76x, XRP 2.85x, BNB 3.33x) creates asymmetric downside risk. Watch for: (1) sustained ETF inflows above $50M/day, (2) SOL long/short declining below 3.0x as a capitulation signal, (3) BTC funding remaining positive as floor confirmation. Current state: late-stage deleveraging with early accumulation signals in majors, but alt vulnerability persists.
PRICES, VOLATILITY AND VOLUMES
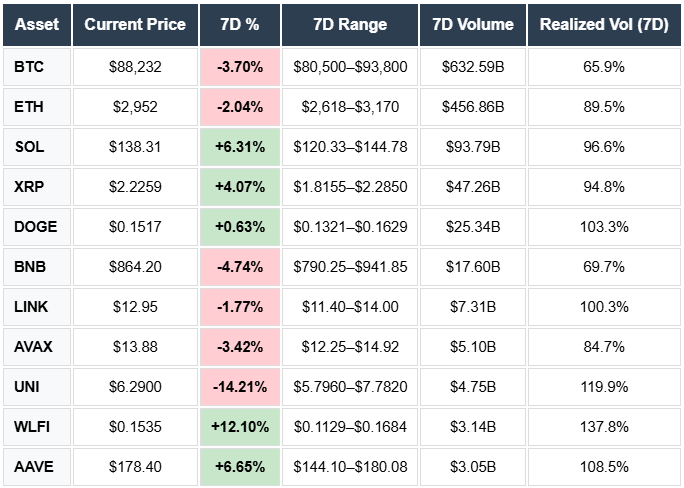
Continued Weakness with Alt Underperformance: BTC declined 1.7% to $86.2k while ETH fell 4.6% to $2,798—ETH underperforming for second consecutive week. Altcoins amplified losses: UNI -10.6%, DOGE -10.2%, XRP -9.3%, SOL -8.2%. SOL's reversal from prior week's +6.3% gain signals failed bounce. Only WLFI (-1.6%) and AAVE (-3.7%) showed relative resilience.
Volume Collapse: Total volumes plunged 35.4% week-over-week to $1.10T ($254B spot, $847B derivatives). Derivatives/spot ratio compressed to 3.33x from 3.81x prior—lower leverage appetite as traders reduce risk exposure. Largest weekly volume decline in recent months signals positioning retreat rather than active trading.
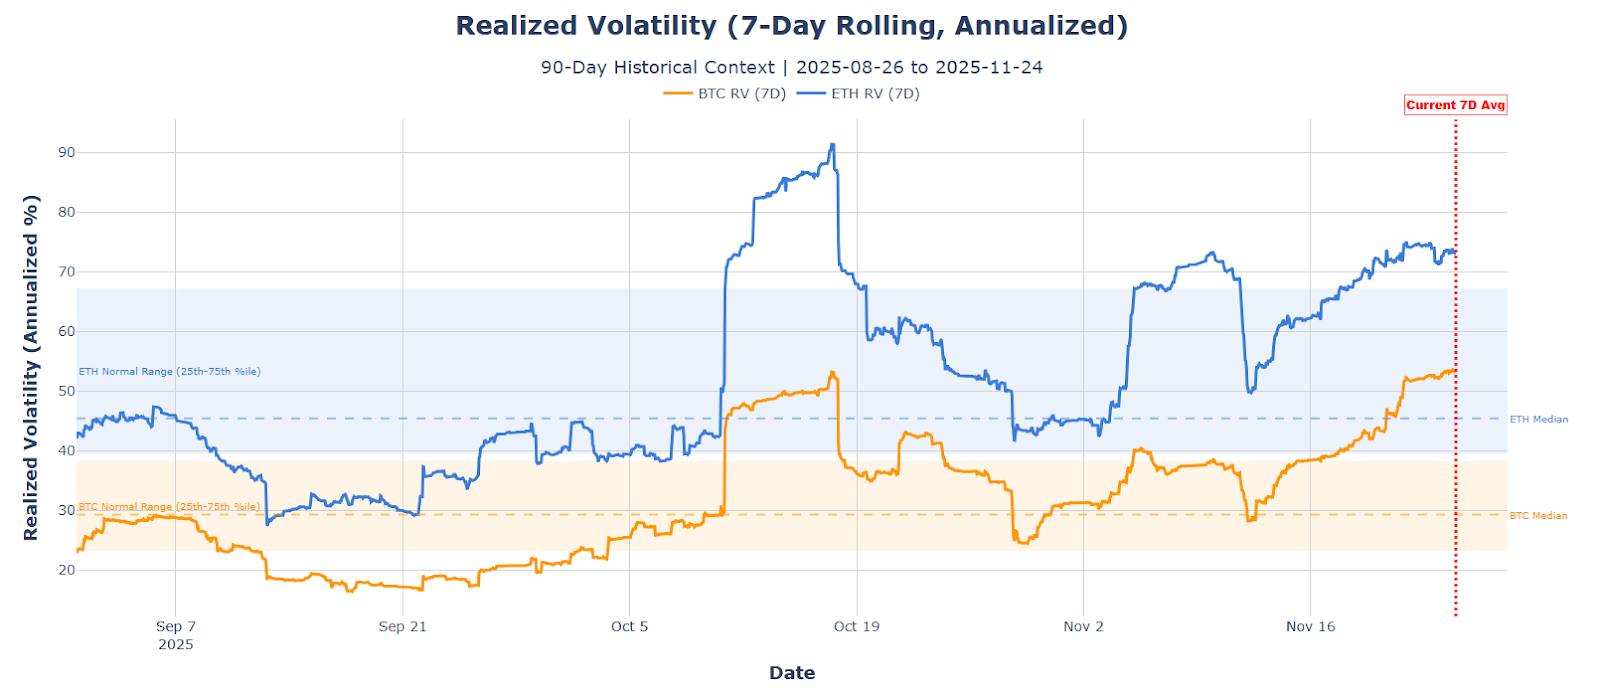
Volatility Normalizing: BTC realized vol at 48.4% (down from 65.9% prior week), now at 75th percentile vs median 34.5%. ETH vol compressed to 67.8% (vs 89.5% prior), sitting at 75th percentile boundary. Both declining from extreme levels toward historical norms—volatility spike digesting.
Altcoin Vol Remains Elevated: WLFI 110.8%, UNI 90.9%, AAVE 86.5%, LINK 73.0%, SOL 70.8%—alts running 1.5-2x BTC's volatility despite price declines. High vol with negative returns indicates distribution rather than accumulation.
Current Levels: BTC traded $83.8k-$93.1k range (11% width), ETH $2.7k-$3.1k (14% width). Tightening ranges from prior week's extremes suggest consolidation forming. Volume contraction with declining volatility typically precedes either breakout or continued grind lower—watch for volume recovery as directional signal.
OPEN INTEREST
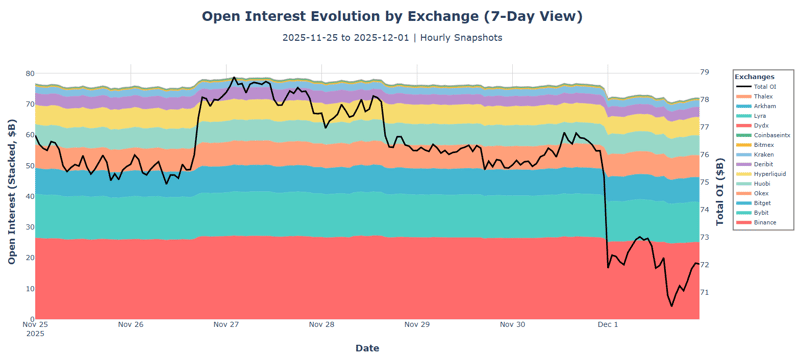
Deleveraging Pace Moderating: Total OI fell $4.16B (-5.5%) to $72.0B—slowest weekly decline in three weeks (vs -7.1% prior, -5.0% before). BTC shed $2.06B (-6.1%) to $31.8B while ETH lost only $480M (-2.5%) to $18.5B. ETH's relative resilience reverses prior patterns of underperformance. Combined BTC+ETH at 69.8% of total OI, stable week-over-week.
Alt Unwind Accelerates in Select Names: ZEC collapsed -28.9% (largest decline), SUI -20.1%, BCH -11.9%, XRP -11.6%—concentrated deleveraging in mid-cap alts. XRP's sharp OI drop reverses prior week's +4.2% gain as ETF launch enthusiasm fades. SOL is more orderly at -4.9%. CHEEMS flat at $1.73B (2.4% share)—meme positioning holding despite broader weakness.
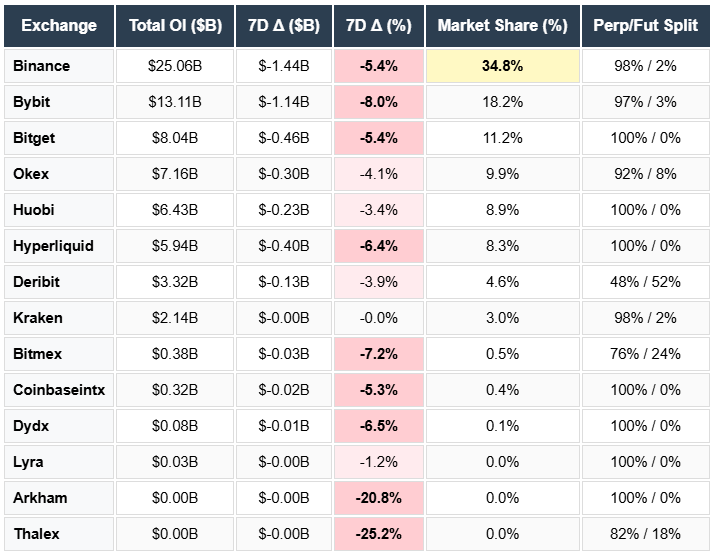
Venue Flow Uniform: All major exchanges declined: Bybit -8.0% (largest), Bitmex -7.2%, BNB -6.8%, Hyperliquid -6.4%, Binance -5.4%. Kraken is the only stable venue (flat). Deribit reversed prior +11.3% surge with -3.9% outflows—hedging demand fading as volatility normalizes. Hyperliquid's continued -6.4% decline extends multi-week exodus from native venues. Binance maintained 34.8% market share.
Structure Unchanged: Perpetuals at 95.4% vs futures 4.6%—retail-heavy positioning persists. BTC shows marginally better structure (92%/8%) while alts remain 100% perpetual-dominated. High funding sensitivity and cascade risk unchanged despite lower absolute positioning.
Forward Signal: OI decline tracking price action (-5.5% OI vs -1.7% BTC) indicates leverage reduction outpacing spot weakness—healthy deleveraging. Watch for OI stabilization below $70B as a clearing completion signal. ETH's relative strength in OI (-2.5% vs -6.1% BTC) may signal positioning rotation. Current state: late-stage deleveraging with pace moderating but not yet complete.
FUNDING RATES
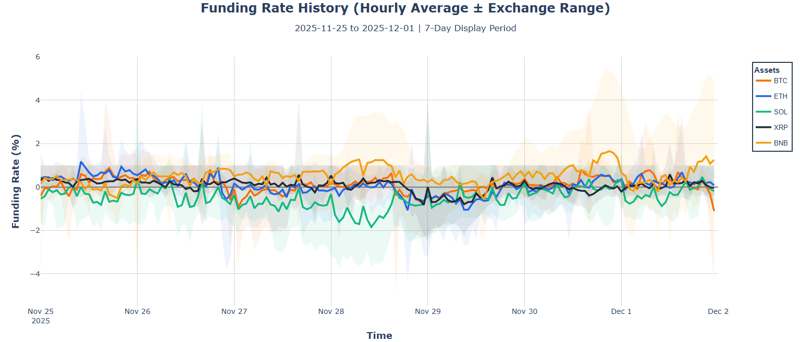
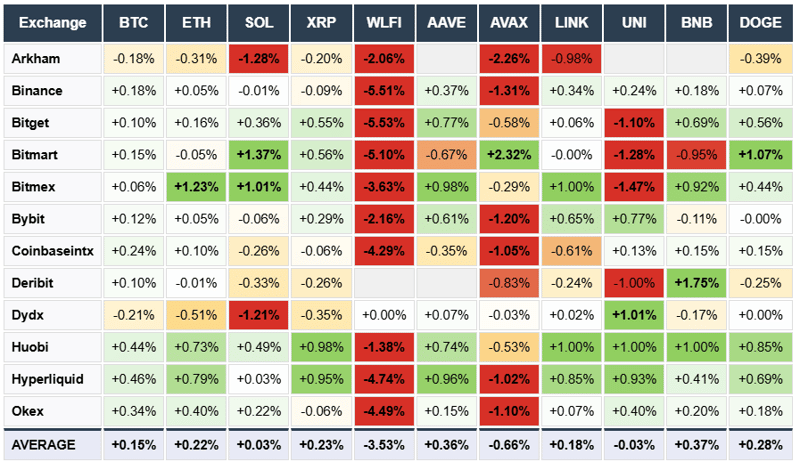
Market Average Flips Negative: Market-wide funding collapsed to -0.22% (-29.9% annualized)—first negative reading in this report series. Shorts now paying longs across aggregate positioning. BTC and ETH remain positive but compressed: BTC 0.15% (20.6% annualized), ETH 0.22% (29.9% annualized), SOL near-zero at 0.03%. Significant shift from prior week's positive carry environment.
Intraweek Volatility Extreme: Funding swung wildly—BTC ranged -1.10% to +0.88% (199bps), ETH -1.07% to +1.18% (225bps), SOL hit -1.84% to +0.47% (231bps). BNB saw the largest swing at -0.53% to +1.66% (219bps). The week ended with BTC hitting -1.10% low on Dec 1—most bearish hourly print of the period. Rapid oscillations indicate unstable positioning with algo-driven mean reversion dominating.
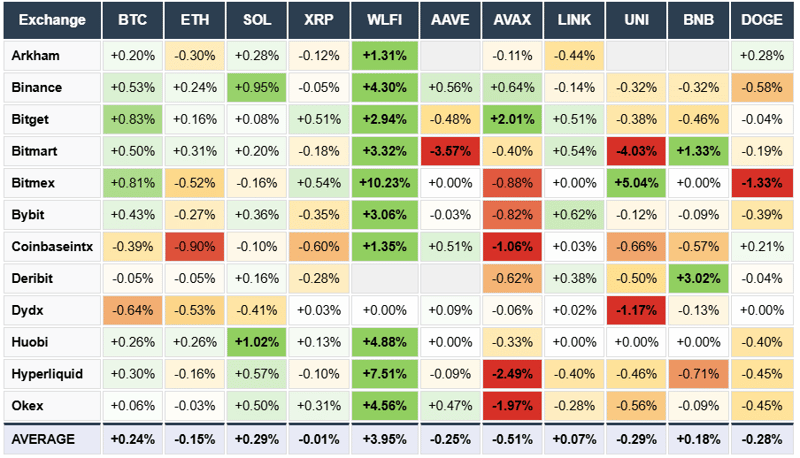
WLFI Deeply Short: WLFI funding averaged -3.53%—extreme short positioning with Binance at -5.51%, Bitget -5.53%. Week-over-week change of +3.95% (less negative) suggests partial short covering but positioning remains heavily bearish. AVAX also negative at -0.66% average. In contrast to the broader market, Huobi ran hot on multiple assets (+0.44% BTC, +0.73% ETH, +0.98% XRP).
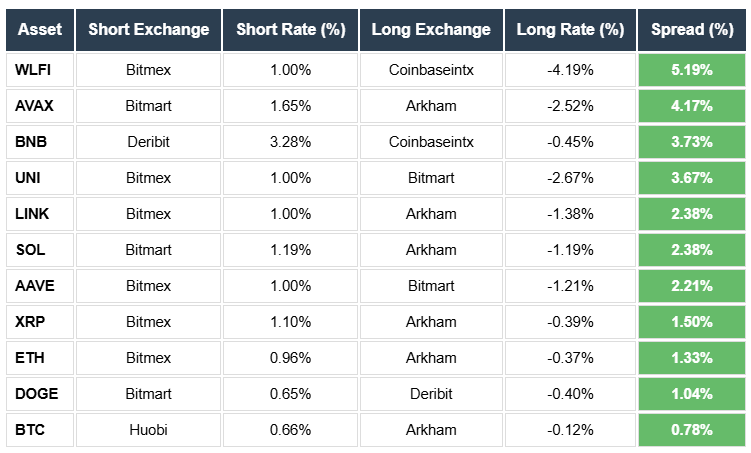
Arbitrage Spreads Wide: WLFI 5.19% spread (Bitmex +1.00% vs Coinbaseintx -4.19%), AVAX 4.17% spread, BNB 3.73% spread. Persistent venue divergence indicates capital constraints and asymmetric positioning. BTC showed 4.47% latest spread despite majors typically arbitraged tight—market makers demanding premium during volatility.
Forward Signal: Negative market-wide funding is a classic capitulation signal—shorts dominating for first time this cycle. However, BTC/ETH remaining positive suggests majors haven't fully capitulated. Watch for sustained negative BTC funding as confirmation of sentiment shift. Current structure favors mean reversion trades but directional conviction is absent.
Funding Rates
Week on Week
Funding Rate Arbitrage Opportunity
ORDERBOOK DEPTH
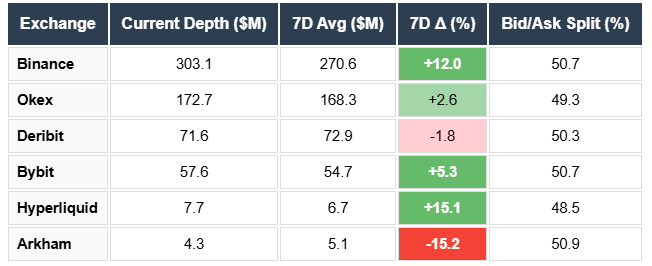
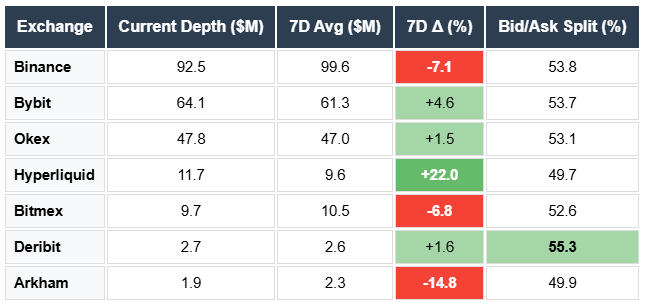
BTC Liquidity Surging: BTC depth at $617M (±200bps) up 3.0% week-over-week, $597M at ±100bps (+6.9% vs average). Binance led expansion with $303M (+12.0%), Hyperliquid +15.1% despite OI exodus. Flight to quality continues—market makers adding BTC liquidity during weakness while maintaining tight quotes. Depth range $529M-$597M (12.1% volatility) shows active rebalancing but strong underlying support.
ETH/SOL Stable: ETH depth essentially flat at $491M (+1.4%), SOL unchanged at $230M (+0.1%). Bybit gained across both (+6.9% ETH, +4.6% SOL) while Binance contracted (-3.7% ETH, -7.1% SOL). Hyperliquid continued depth expansion (+16.7% ETH, +22.0% SOL)—paradox of rising liquidity provision despite falling OI suggests market makers positioning for volatility capture rather than directional exposure.
Venue Divergence: Arkham depth collapsed across all assets: BTC -15.2%, ETH -15.9%, SOL -14.8%—consistent withdrawal from smaller venue. Binance maintains dominance with 49% of BTC depth ($303M), 46% of ETH ($226M), 40% of SOL ($93M). Deribit stable as hedging venue. Concentration in top-tier infrastructure persisting.
Balanced Positioning: All assets showing neutral bid/ask splits—BTC 50.1%, ETH 51.4%, SOL 52.6%. SOL's slight bid bias (52.6%) indicates dip-buying interest despite -8.2% weekly price decline. No directional pressure building in orderbooks despite volatile funding rates. Market makers positioned symmetrically, suggesting range-bound expectations.
Forward Signal: BTC depth expansion during price weakness is a bullish microstructure signal—institutional absorption or accumulation interest building. ETH/SOL flat depth with declining OI suggests deleveraging is complete in spot markets. Current structure supports size execution without excessive slippage. Watch for depth contraction as warning of renewed volatility.
BTC Depth
ETH Depth

SOL Depth
ORDERBOOK SPREADS
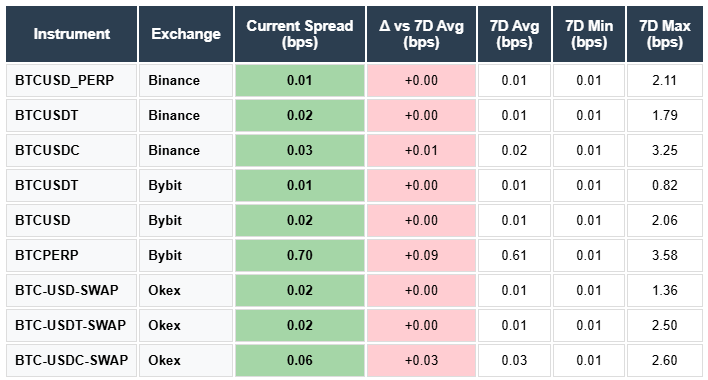
BTC Institutional-Grade Execution: BTC spreads averaging 0.10 bps with core pairs at 0.01-0.02 bps (Binance, Bybit, Okex)—tightest levels maintained despite volatility. BTCUSDT on Bybit at 0.01 bps represents optimal execution. Only Bybit PERP wider at 0.70 bps reflecting retail product structure. Week-over-week change minimal at +0.02 bps—market makers maintaining tight quotes through price weakness.
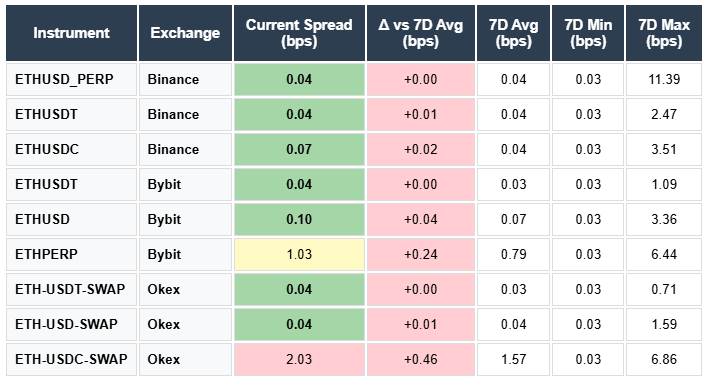
ETH Core Tight, Tails Wide: ETH averaging 0.38 bps with significant dispersion. Core USDT pairs at 0.04 bps (Binance, Bybit, Okex) match BTC quality. However, ETH-USDC-SWAP on Okex spiked to 2.03 bps (+0.46 vs avg)—USDC liquidity fragmenting. Bybit ETHPERP at 1.03 bps (+0.24 wider). 7D max of 11.39 bps on Binance USD PERP shows flash widening during stress—absorbed quickly but reveals fragility in non-USDT pairs.
SOL Spread Premium Persists: SOL averaging 1.05 bps—10x BTC's spread reflecting structural liquidity disadvantage. Core pairs at 0.79 bps (Binance, Okex) represent best execution but still materially wider than majors. Bybit USD pairs at 1.77-1.86 bps create execution cost for size traders. 7D max of 6.63 bps (Bybit USD) shows significant blowout potential during volatility.
Stability Despite Volatility: All assets showing minimal spread widening (+0.02 to +0.15 bps vs 7D average) despite 48-71% realized volatility. Market makers absorbed price swings without pulling quotes—healthy microstructure signal. USDC pairs consistently widest across all assets indicating lower stablecoin liquidity versus USDT.
Execution Hierarchy Clear: BTC < ETH < SOL spread ordering unchanged. $50M+ BTC orders executable with minimal slippage on Binance/Bybit. ETH size requires routing to USDT pairs. SOL execution costs 5-10x majors—important consideration for portfolio rebalancing during volatility.
BTC Spreads
ETH Spreads
SOL Spreads

LONG/SHORT RATIOS
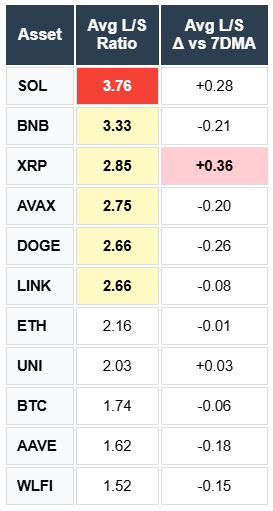
BTC Positioning Normalizing: BTC ratio at 1.74x (-0.06 vs 7DMA)—most balanced among all assets and continuing decline from 2.08x prior week. Binance at 1.62x, Bybit at 1.88x show uniform compression. BTC now in healthy territory below 2.0x threshold for the first time in weeks. Deleveraging complete in majors with balanced two-sided positioning returning.
SOL Crowding Intensifies: SOL hit 3.76x (+0.28)—most crowded position and increasing during -8.2% weekly decline. Binance surged to 3.79x (+0.45), highest reading of period. Classic retail behavior: adding longs into weakness rather than cutting. Creates severe asymmetric downside risk—any support break triggers cascading liquidations with minimal short covering to cushion.
XRP Countertrend Positioning: XRP ratio jumped to 2.85x (+0.36) with Bybit exploding to 3.59x (+0.95 vs 7DMA)—largest single venue increase. Fresh longs piling in despite -9.3% price decline and ETF launch failing to sustain momentum. Dangerous late-cycle positioning increases squeeze risk if support breaks.
Broader Deleveraging in Alts: BNB -0.21 to 3.33x, DOGE -0.26 to 2.66x, AVAX -0.20 to 2.75x, AAVE -0.18 to 1.62x—most alts showing position reduction. WLFI compressed to 1.52x (-0.15), most balanced alt reflecting heavy short positioning seen in negative funding. UNI essentially neutral at 2.03x after prior week's -14.2% price collapse cleared extremes.
Forward Signal: BTC below 2.0x signals healthy positioning—majors deleveraged. However, SOL/XRP/BNB still 2.8-3.8x creates cascade risk in alts. Watch for SOL ratio declining below 3.0x as a capitulation signal. Current divergence—majors balanced while alts crowded—suggests rotational risk rather than broad systemic stress. Altcoin longs remain vulnerable to any renewed selling pressure.
TERM STRUCTURE / BASIS
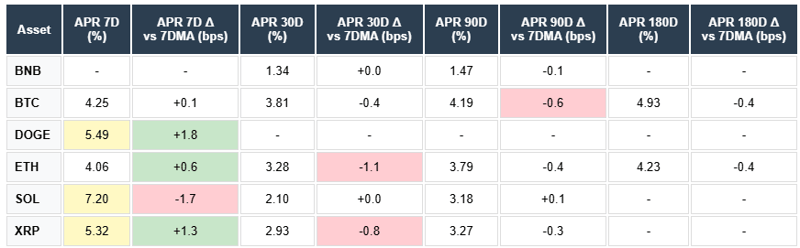
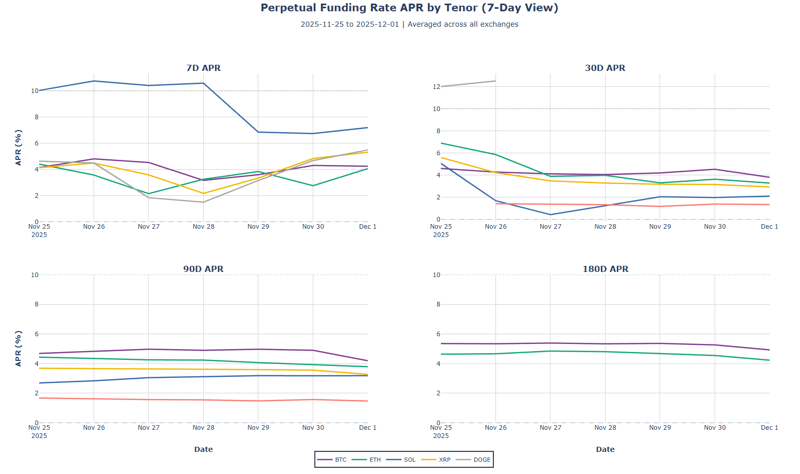
BTC Curve Stable Contango: BTC 7D APR at 4.25% (+0.1bps vs 7DMA) with curve gently upward sloping—30D 3.81%, 90D 4.19%, 180D 4.93%. Modest +68bps slope from 7D to 180D indicates stable carry expectations. No near-term stress or backwardation despite negative hourly funding prints. Longs paying a reasonable premium for duration exposure—orderly market structure.
SOL Inversion Extreme: SOL 7D APR spiked to 7.20% while 30D collapsed to 2.10%—510bps inversion signals acute near-term positioning stress. Front-end premium reflects short covering or supply shortage while longer-dated contracts price normalization. Inverted curve combined with 3.76x long/short ratio creates unstable equilibrium. 7D APR declining (-1.7bps) suggests pressure beginning to ease but structure remains abnormal.
XRP/DOGE Elevated Front-End: XRP 7D at 5.32% (+1.3bps) inverting to 30D 2.93%—239bps backwardation. DOGE 7D at 5.49% (+1.8bps) with no longer-dated contracts for reference. Both showing an increasing front-end basis as positioning intensifies despite price weakness. Rising short-term APR during selloffs typically indicates short squeeze building or forced covering.
ETH Compressed: ETH curve flat at 7D 4.06%, 30D 3.28%, 90D 3.79%, 180D 4.23%. Term structure normalized from prior week's stress. 30D declining (-1.1bps) indicates carry compression as leverage reduces. BNB lowest carry at 1.34% (30D)—minimal speculative premium reflecting lower volatility expectations.
Forward Signal: SOL's extreme inversion historically precedes either a sharp rally (squeeze) or extended weakness (hedging correct). BTC/ETH stable curves suggest majors insulated from alt positioning extremes. Watch for SOL curve normalization (7D < 30D) as volatility resolution signal. No assets in backwardation—shorts not aggressive enough to dominate. Current structure: contained stress in alts, stable majors.
BITCOIN ETF FLOWS
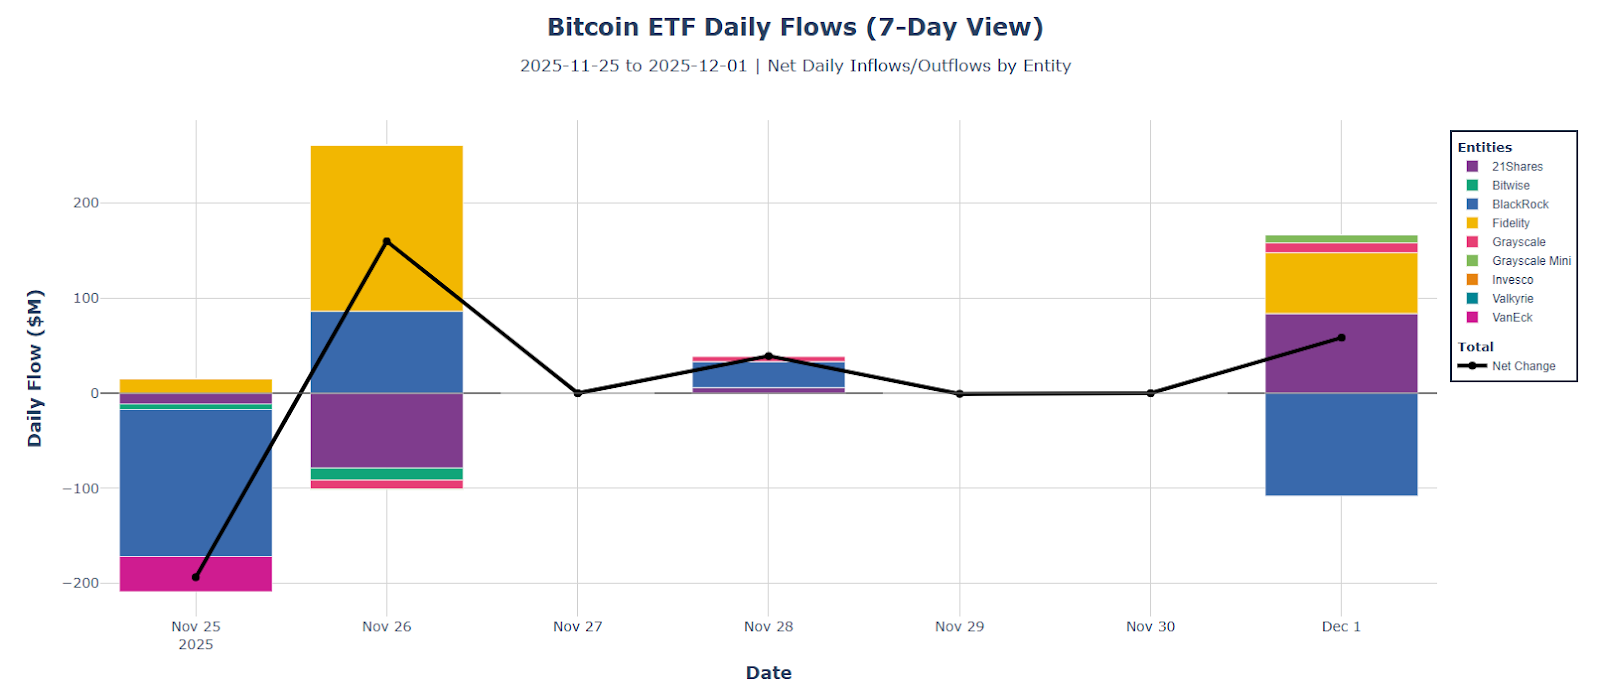
Outflows Accelerate: Bitcoin ETFs shed $1.31B (-1.0% of AUM) over 7 days with total AUM declining to $126.6B. Three negative days vs two positive suggests sustained selling pressure not isolated profit-taking. Monthly outflows reached $3.25B, indicating multi-week institutional distribution. A week-ending flow of +$44.0M provided minor relief but insufficient to reverse the trend.
BlackRock Dominates Outflows: BlackRock IBIT led exodus with $1.07B redemptions (82% of total outflows), reversing prior accumulation pattern. Grayscale classic shed $165.4M, 21Shares $81M, VanEck $39M. Only Fidelity saw material inflows (+$42.5M) partially offsetting but dwarfed by BlackRock selling. Grayscale Mini gained $9.8M - tax-loss harvesting from classic to mini structure.
Flow Pattern Breakdown: Largest single-day outflow November 21 at $683.5M, followed by $497.7M (Nov 19) and $222.8M (Nov 18). Two positive days (+$51.4M, +$44.0M) insufficient to offset negative momentum. Average daily outflow of $261.7M vs historical $50-100M during consolidation periods signals institutional risk-off sentiment.
Context and Implications: Outflows running below Bitcoin's ~$15M daily issuance rate ($105M weekly) means net institutional selling not just supply absorption. 30-day $3.25B outflow represents 2.5% of AUM - material but not panic-level (March 2024 saw 5%+ monthly). Watch for: (1) daily outflows decelerating below $100M as stabilization signal, (2) BlackRock flows reversing positive, (3) Fidelity inflows accelerating above $50M/day.

STABLECOIN FLOWS
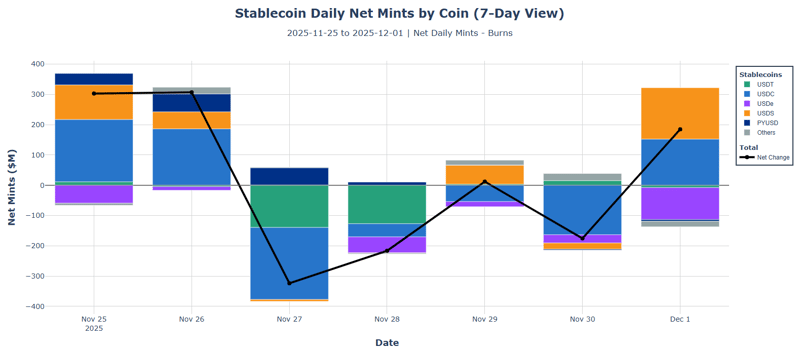
Capital Returns After Two-Week Exodus: Stablecoin supply expanded +$90.3M to $269.4B—reversal from prior week's -$315M burns. 30-day trend flipped positive to +$733.6M from -$866.6M. Four minting days versus three burning days with +$12.9M daily average. Fresh dry powder entering markets for the first time since early November, aligned with ETF inflow reversal.
USDS Dominates Inflows: USDS (Sky/Maker) surged +$375.0M (+6.5% weekly growth)—largest single-stablecoin inflow as DeFi yield strategies rotate. PYUSD continued TradFi momentum at +$156.1M (+30D $1.08B cumulative). USDC modest +$45.3M but 30-day trend robust at +$1.09B—institutional capital steadily returning. RLUSD (Ripple) added $14.6M, small but accelerating.
USDe Deleveraging Persists: USDe burned $273.0M (-3.6% of supply)—seventh consecutive week of outflows totaling -$2.21B over 30 days. Ethena synthetic dollar redemptions continue as carry trades unwind. Combined with USDT -$248.8M, yield-seeking and retail capital contracting while regulated/institutional stables (USDC, PYUSD, USDS) expand. Market composition shifting toward TradFi-aligned assets.
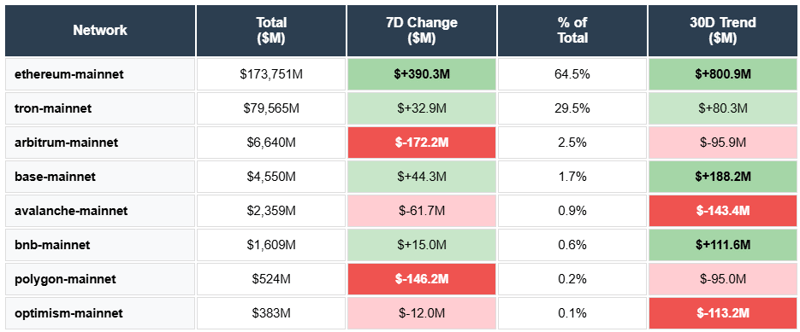
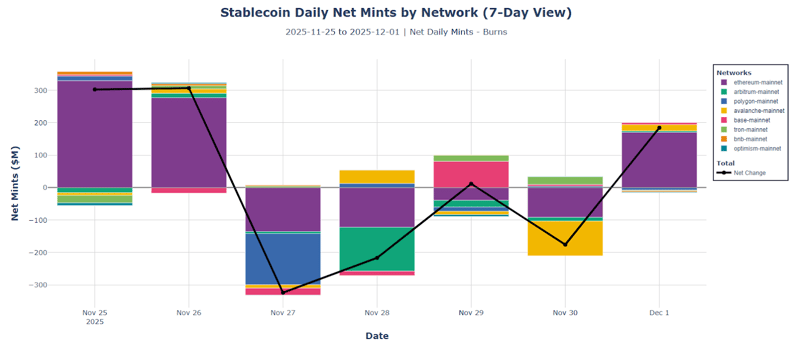
Network Flows Diverge: Ethereum mainnet reversed to +$390.3M from prior -$390.7M—institutional DeFi re-engaging. Base continued growth (+$44.3M), Tron stable (+$32.9M). However, Arbitrum bled -$172.2M, Polygon -$146.2M, Avalanche -$61.7M—L2/alt-L1 capital consolidating to mainnet and Base. L2 combined at 4.3% share, declining as activity concentrates.
Forward Signal: Positive weekly flow with institutional stables leading (USDC, PYUSD, USDS) is constructive. USDe unwind nearing completion (supply down 30%+ from peak). Watch for USDT minting resuming as retail confirmation. Current +$90M weekly pace modest but directionally supportive—provides marginal buying power rather than aggressive accumulation signal.

DEFI LENDING
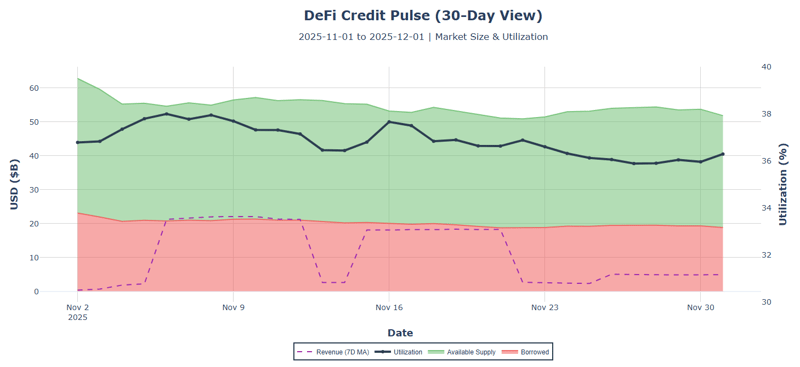
Liquidations Collapse to Normal: $4.0M liquidations over 7 days—97% reduction from prior week's $139.3M stress levels. Return to baseline indicates volatility-driven position clearing complete. Aave Ethereum saw only $3.8M versus $102.4M prior. Credit markets stabilized as price swings moderated (BTC vol 48.4% vs 65.9% prior).
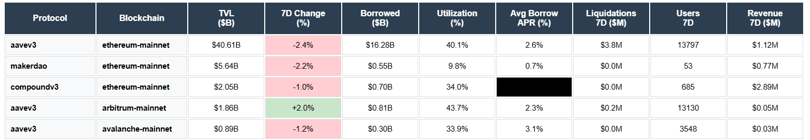
TVL Contraction Continues: TVL down -17.4% over 30 days to $51.0B, borrowed down -18.5% to $18.6B—parallel deleveraging maintained 36.5% utilization (stable from 36.3% prior). Weekly TVL change modest at -2.4% (Aave Ethereum), -2.2% (MakerDAO), -1.0% (Compound)—pace moderating. Arbitrum only gainer at +2.0%, capturing L2 rotation.
Ample Capacity, Weak Demand: $33.0B available lending capacity (64% of deposits idle). Utilization at 36.5% well below 45% stress threshold. Borrow APRs compressed: Aave 2.6%, MakerDAO 0.7%, Aave Arbitrum 2.3%. Cheap borrowing costs failing to stimulate demand—leverage appetite exhausted post-deleveraging. Only Compound v3 anomaly at 91.6% APR reflecting specialized vault dynamics.
Aave Dominance Unchanged: Aave v3 Ethereum at $40.6B represents 80% of top 5 TVL with 40.1% utilization. Single-protocol concentration persisting as smaller venues see proportionally larger outflows. Revenue at $4.86M weekly—normalized from $2.39M+ during liquidation spike but elevated versus typical $1-2M baseline.
Forward Signal: Liquidation normalization is key stability indicator—credit stress resolved. Watch for: (1) utilization rising above 40% as credit demand signal, (2) TVL stabilizing as capital flight ends, (3) borrow APRs increasing as leverage appetite returns. Current state: healthy credit market with ample capacity but weak demand. Deleveraging complete, awaiting catalyst for credit expansion.
Full-Market Research. Institutional Depth. Derivatives, ETFs, on-chain, DEXs, microstructure, risk signals—and more. Subscribe at the bottom of our page for research that covers every corner of crypto and visit the Amberdata Research Blog.
Access Amberdata Intelligence for institutional-grade digital asset intelligence powering actionable insights across blockchain and market data, or contact our team to discuss custom solutions for your risk management strategy.

Links & Resources
Amberdata Research Library
https://www.amberdata.io/research-library
Amberdata Intelligence Platform
Amberdata Docs
Contact Us
https://www.amberdata.io/contact-us
Recent from Amberdata
- The ETF Exodus Decoded: Basis Arbitrage, Not Capitulation
- Coincidence or Signal? Did WLFI Telegraph Crypto's $6.93B Meltdown
- How $3.21B Vanished in 60 Seconds: October 2025 Crypto Crash Explained Through 7 Charts
- Five Signals of FOMC Impact: How Interest Rate Decisions Reshape Crypto Market Microstructure
- Beyond the Spread - Understanding Market Impact and Execution
- The Rhythm of Liquidity - Temporal Patterns in Market Depth
- DeFi Activity, Stablecoins, and the Impact on Price Volatility: Part 1
- DeFi Activity, Stablecoins, and the Impact on Price Volatility: Part 2
- DeFi Activity, Stablecoins, and the Impact on Price Volatility: Part 3
- How Do On-Chain Metrics Explain Bitcoin Volatility? Part 1
- How Do On-Chain Metrics Explain Bitcoin Volatility? Part 2
- Amberdata 2024 Digital Asset Market Intelligence Report: Exchanges & Derivatives
- Crypto Pairs Trading: Part 1 — Foundations of Moving Beyond Correlation
- Crypto Pairs Trading: Part 2 — Verifying Mean Reversion with ADF and Hurst Tests
- Crypto Pairs Trading: Part 3 — Constructing Your Strategy with Logs, Hedge Ratios, and Z-Scores
- Crypto Pairs Trading: Part 4 — Empirical Results & Performance Analysis
Disclaimers
The information contained in this report is provided by Amberdata solely for educational and informational purposes. The contents of this report should not be construed as financial, investment, legal, tax, or any other form of professional advice. Amberdata does not provide personalized recommendations; any opinions or suggestions expressed in this report are for general informational purposes only.
Although Amberdata has made every effort to ensure the accuracy and completeness of the information provided, it cannot be held responsible for any errors, omissions, inaccuracies, or outdated information. Market conditions, regulations, and laws are subject to change, and readers should perform their own research and consult with a qualified professional before making any financial decisions or taking any actions based on the information provided in this report.
Past performance is not indicative of future results, and any investments discussed or mentioned in this report may not be suitable for all individuals or circumstances. Investing involves risks, and the value of investments can go up or down. Amberdata disclaims any liability for any loss or damage that may arise from the use of, or reliance on, the information contained in this report.
By accessing and using the information provided in this report, you agree to indemnify and hold harmless Amberdata, its affiliates, and their respective officers, directors, employees, and agents from and against any and all claims, losses, liabilities, damages, or expenses (including reasonable attorney’s fees) arising from your use of or reliance on the information contained herein.
Copyright © 2025 Amberdata. All rights reserved.