Share this blog:

Welcome to Amberdata's Crypto Snapshots, your one-stop source for in-depth crypto insights and deep dives into the dynamic world of digital assets. Our comprehensive coverage includes spot, futures, and swaps trading, as well as DeFi DEXs (decentralized exchanges) and DeFi borrow/lend platforms. We also provide detailed analysis of various blockchain networks, giving you a holistic view of the rapidly evolving digital assets landscape. Stay ahead of the curve with Amberdata's Crypto Snapshots and unlock a deeper understanding of the crypto economy!
The Merriam-Webster dictionary defines a sandwich (verb) as: “to make into or as if into a sandwich; especially: to insert or enclose between usually two things of another quality or character”. By this definition, tacos (noun) are certainly not sandwiches. Hot dogs (noun) are certainly not sandwiches. But the April 3, 2023 MEV-Boost Relay exploit can most certainly be considered a sandwich (verb) attack. Multiple MEV bots lost $25m on Ethereum network due to an exploit by a malicious proposer which baited bots with a specially crafted transaction and constructed a block which drained them. This shows us that information asymmetry (a common theme this edition) can even be found within private pools, even if it was only though an exploit
In a different example of a sandwich, Arbitrum faces strong criticism from the pro-decentralization community for recent actions with their DAO management scheme. Arbitrum pitched its’ DAO as a way to decentralize, however when a proposal made by the project to transfer 750M ARB (~$1 billion) to support the Arbitrum Foundation was voted down by the community they quickly followed up with two new proposals. Since some of the measures of the initial proposal (including already spending an allocation of 50.5M ARB) were already implemented despite the community’s opposition, these two new proposals place Arbitrum in the middle of an entirely different kind of sandwich.
Spot Market
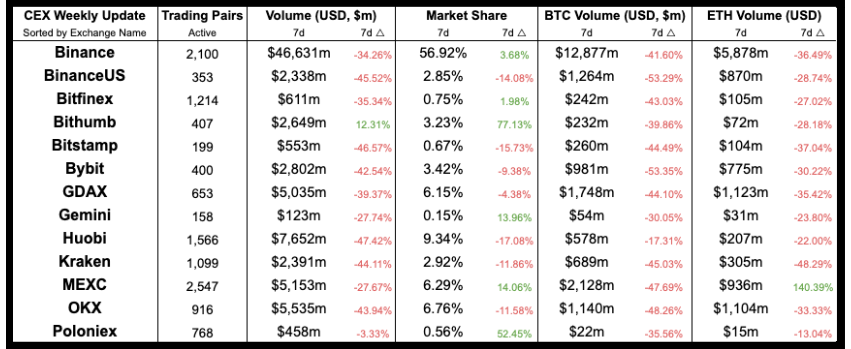 Centralized Exchange (CEX) comparison between this and last week
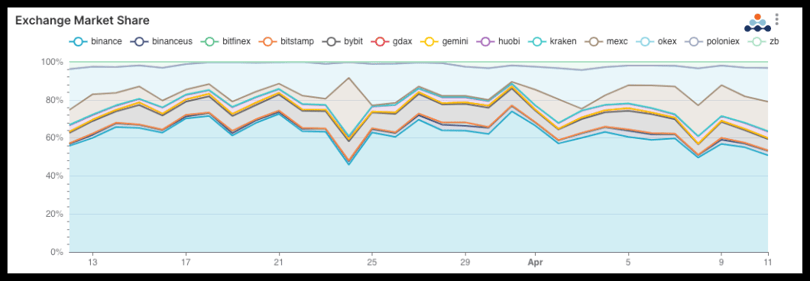 Centralized Exchange (CEX) market share
Binance’s trading volume market share appears to be in decline. Since the CFTC charges against Binance on March 27, 2023 Binance has dropped roughly 6 percentage points with MEXC being the main winner in this ongoing battle for market dominance. Binance still holds ~56% of the centralized exchange trading volume market, but the trend here could see some centralized exchanges taking advantage of the regulatory uncertainty as traders may start to jump to safe harbors or expect regulatory and compliance crackdowns from the CEX giant.
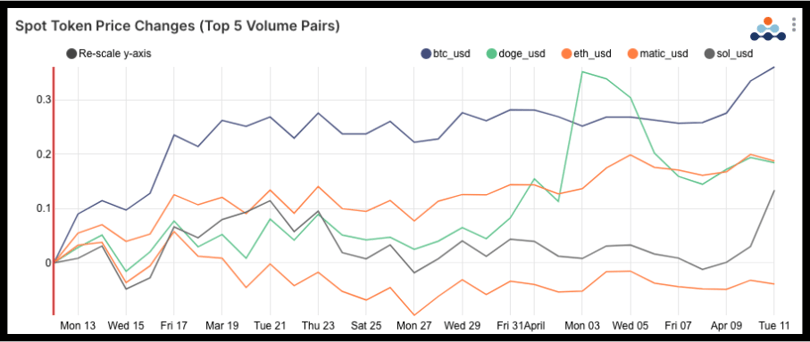 Top 5 CEX traded pairs price trends from the last 30 days.
DOGE has run rampant over the last 30 days after Elon Musk’s Twitter switched from the long iconic blue bird logo to the infamous dog logo representing Dogecoin (DOGE). Bitcoin (up 36% since March 12th) continues the run having temporarily crossing $30k this week. The rising Bitcoin boat hasn’t brought its wind to all projects, somewhat breaking it’s pattern of correlation for Polygon (MATIC) which could be facing some difficulties after the Ethereum Shapella upgrade, which is expected to improve the Ethereum networks’ scalability, as well as the declining number of large transactions seen on the network.
Futures & Swaps
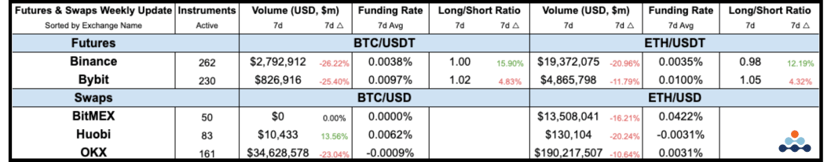 Futures and Swaps exchange comparisons between this and last week
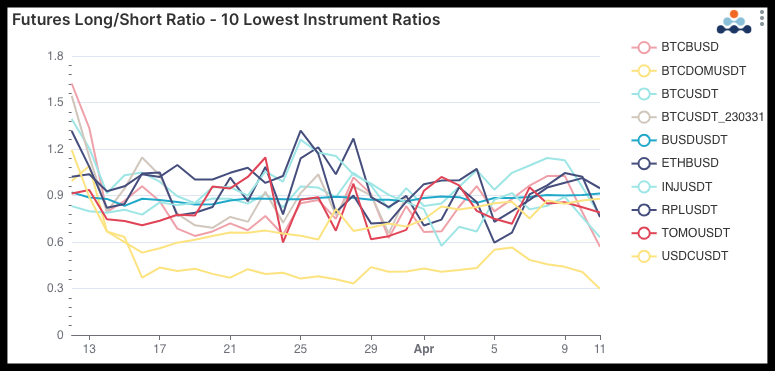 Futures long / short ratios for the 10 lowest ratio instruments
A major surprise in the digital assets futures market is the long short ratio for USDC / USDT which currently has a ratio of 0.8797. This metric is a ratio of the long positions vs short positions with a number below 1 indicating there are more short positions than long positions – a bearish sentiment signaling lower expectations. These two stablecoins represent much different philosophies with USDT maintaining its peg through a basket of assets (including cash, cash equivalents, secured loans, etc.), while USDC maintains its peg with cash. USDT has been valued slightly above $1 (going as high as $1.0012 in the last seven days), while USDC is still struggling with the fallout from the recent banking crises.
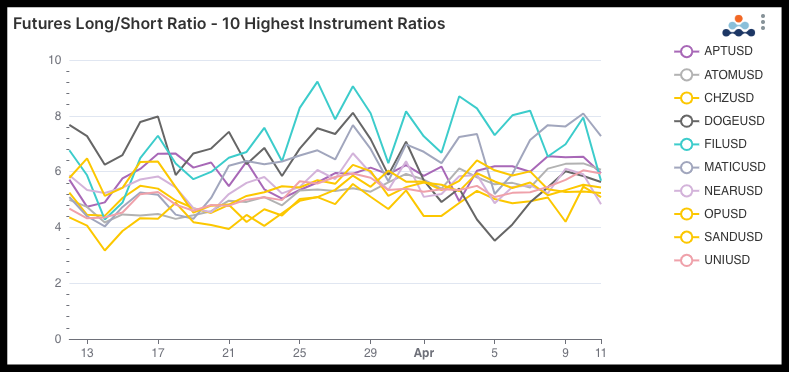 Futures long / short ratios for the 10 highest ratio instruments
For the top 10 highest instrument ratios, more surprises as MATIC (mentioned above) has a growing positive ratio over the last 30 days (from 5.09 to 7.27). Essentially, the futures market holds higher sentiment on MATIC than spot markets which signals bullish signs ahead.
DeFi DEXs
 Decentralized Exchange (DEX) comparisons between this and last week
DeFi Borrow / Lend
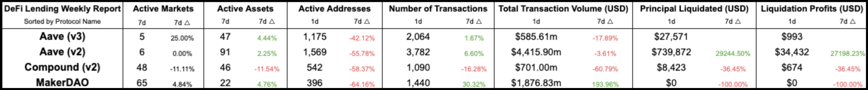 DeFi Lending protocol comparisons between this and last week
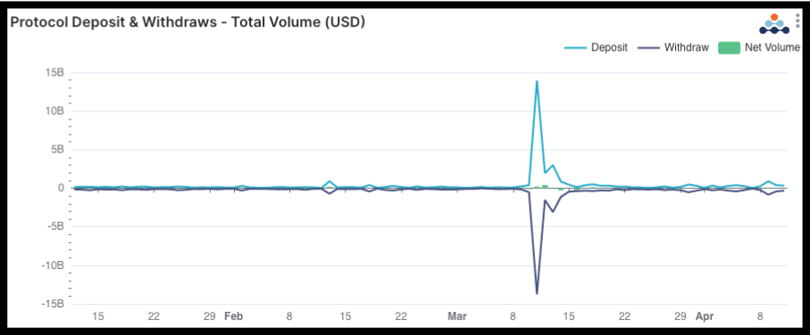 Aave v2 deposit and withdraw volume (USD) over the last quarter.
Aave v2, one of the most active DeFi lending protocols in the entire space, has been seeing bumps in activity since the end of March. As we discussed in the last edition of the Amberdata Crypto Snapshot, we’ve seen extremely high activity in the USDC and USDT pools last month primarily caused by the USDC de-pegging event. Since then activity seemed to cool until March 29th when activity started to build again. The main question is where and why activity has been popping back up.
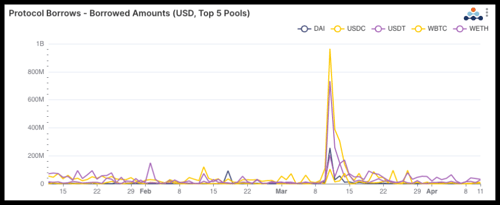
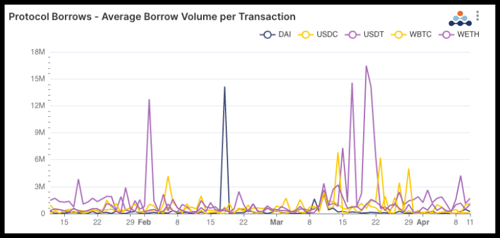
Aave v2 borrowed volumes and average borrow volumes (USD) per transaction from the top 5 pools over the last quarter.
Looking at borrows, we don’t see a significant trend when it comes to the top 5 digital assets. It seems like total borrowing hasn’t fully recovered from the USDC de-pegging event, nor has it recovered to its pre-March borrowing days seeing as the trend of average borrows per transaction remained fairly low in the last days for USDT and WETH volumes outside of odd bumps (which were more common in prior periods).
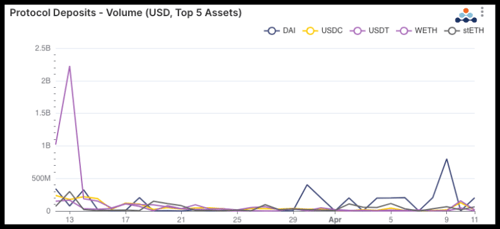
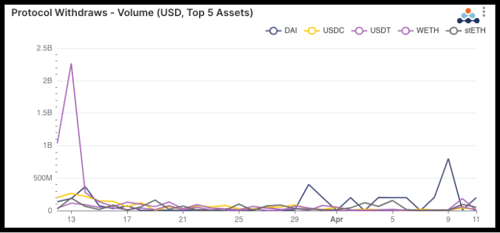
Aave v2 deposit and withdraw volumes (in USD) over the last quarter
Deposits and withdrawals of DAI volumes is the clear standout with high growth in activity for both deposits and withdrawals. The reason for this is a fairly obvious, but major event that occurred on March 1, 2023 when MakerDAO (the second largest DeFi protocol and minter of DAI) reactivated D3M – a partnership started two years ago in April 2021 but paused in June 2022 – which allows lending protocols like Aave to mint DAI directly from MakerDAO. As seen from the borrowers visualizations, the activity is fully in deposits and withdrawals as caused by MakerDAO / Aave D3M showing how DeFi Lending activity metrics are not always as clear-cut as they may seem.
Blockchain Networks
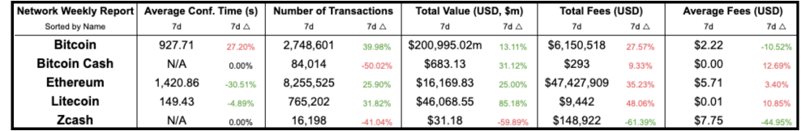 Network comparisons between this and last week
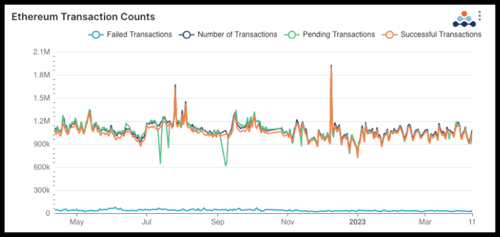
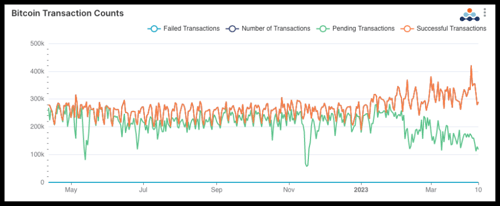
Ethereum and Bitcoin network transaction counts through the last year
Ethereum and Bitcoin, often two peas in a pod, have a starkly different onchain presence. Skipping over the red herring of transaction counts (which really isn’t at scale due to fundamental differences between the networks), the bitcoin network has had a sudden decline in pending transactions while at the same time increasing the number of successful transactions. One potential cause for this is the bitcoin layer 2 Stacks Network, coinciding with Ordinal NFT’s (non-fungible tokens on bitcoin). Additionally, positive effects from the Bitcoin Taproot upgrade may be coming to fruition.
To continue reading the report, click here.
