Welcome to Amberdata's Crypto Snapshots, your one-stop source for in-depth insights into the dynamic world of cryptocurrencies. Our comprehensive coverage includes spot, futures, and swaps trading, as well as DeFi DEXs (decentralized exchanges) and DeFi borrow/lend platforms. We also provide a detailed analysis of various blockchain networks, giving you a holistic view of the rapidly evolving crypto landscape. Stay ahead of the curve with Amberdata's Crypto Snapshots and unlock a deeper understanding of the crypto markets!
Will the next bull run be driven by memes? Does Bitcoin have a future beyond digital gold BTC? And what does this have to do with gas fees?
PEPE has taken the world by storm. The ERC-20 token “fueled by pure memetic power” reached over $1 billion market capitalization and kicked off the current memecoin run which has seen several new memecoins (tokens named or based on memes) launch in the last few weeks. Only time will tell how much staying power these tokens have, but there is such high interest at the moment that Ethereum gas fees have returned to May 2022 values, causing many to question what’s next.
Bitcoin’s future is also up for grabs. Ordinals, inscriptions made on the Bitcoin blockchain, are quickly evolving from “NFTs” to the BRC-20 token standard allowing Bitcoin users to transfer and transact with new tokens on the Bitcoin blockchain. BRC-20s have grown so quickly that the network has seen signs of congestion, leading to increased fees. The high fees even reached Centralized Exchanges (CEXs) with Binance driven to halt BTC withdrawals. One could guess that BRC-20s are on the rise due to the meme token craze on Ethereum, with some meme tokens making their way to Bitcoin to increase their influence (and reduce their costs).
XEN, an ERC-20 not powered by memes, has also made the headlines. While memes are driven by attention, XEN is driven by consumption. The token is produced by minting through “proof-of-burn,” in which users effectively mint new tokens by burning gas fees. The translation: by burning gas through interacting with the token contract, a user receives XEN tokens in return. Over a 24-hour period in October, users paid almost $1.8 million.
What does this all have to do with fees? Like the attention economy, these tokens consume a valuable resource: block space. As more block space is consumed, network congestion and network fees rise in lockstep.
Spot Market
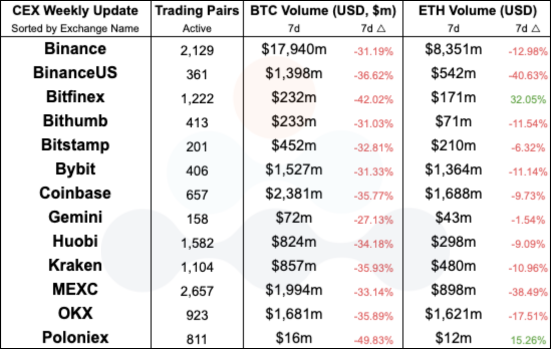 Centralized Exchange (CEX) comparisons between this and last week
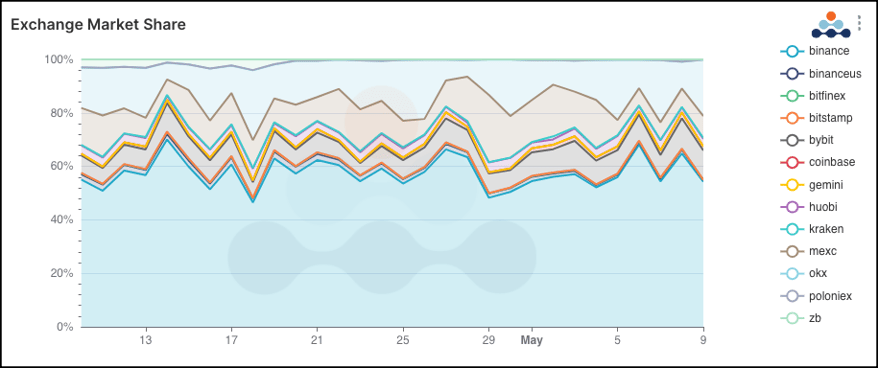 Centralized Exchange (CEX) Market Share over the last 30 days
The clear winner of Binance’s recent market share declines has been MEXC, which has taken as much as 25% of the daily spot market trading volume (April 29, 2023).
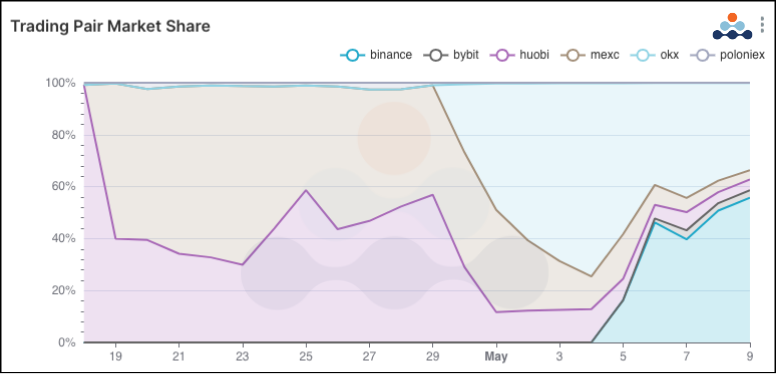 PEPE/USDT CEX Market Share over the last 30 days
Much of the contribution to MEXC’s market share gain comes from $PEPE traders as MEXC was just the second centralized exchange having listed the popular memecoin, a day after Huobi. This first mover advantage is often a strategic value for centralized exchanges who can reap significant trading fees from traders who have very few alternatives when it comes to access to payment rails and custodial solutions. OKX followed suit 11 days after Huobi and yet captured a surprising amount of volume from the first movers, showing how different each exchange is beneath the surface-level metrics. A full 15 days after Huobi, Binance followed suit taking even more volume from the previous exchanges.
Futures & Swaps
 Futures and Swaps exchange comparisons between this and last week.
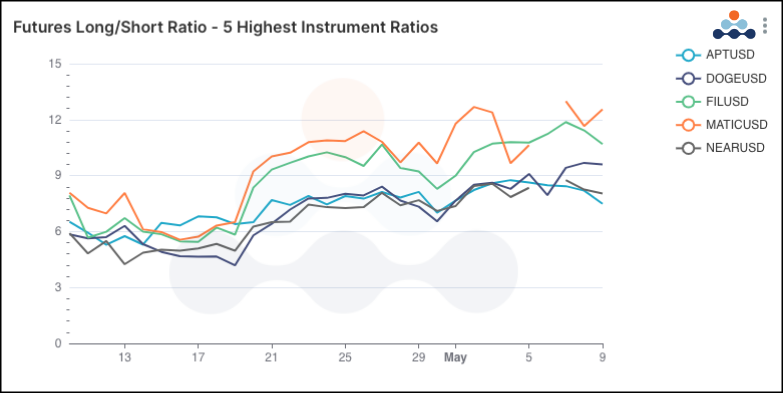 Highest Futures long/short ratios over the last 30 days
Polygon (MATIC) futures reign supreme yet again as having the highest long/short ratio in the futures market. The story here though is Dogecoin (DOGE) which has many speculating on a positive future likely spurred by rumors of a Twitter payments platform – though this has long been rumored – as well as the memecoin run across the wider crypto markets.
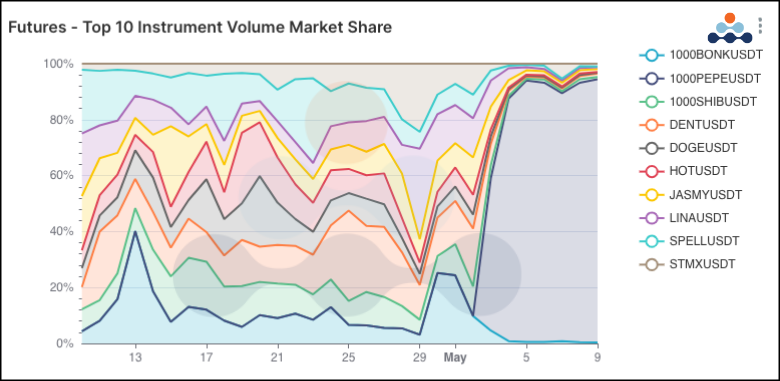 Top 10 Futures instruments’ market share change over the last 30 days
Unsurprisingly PEPE has made its way into the futures market, taking as much as 95% of the futures trading volume since launch.
DeFi DEXs
 DEX protocol comparisons between this and last week
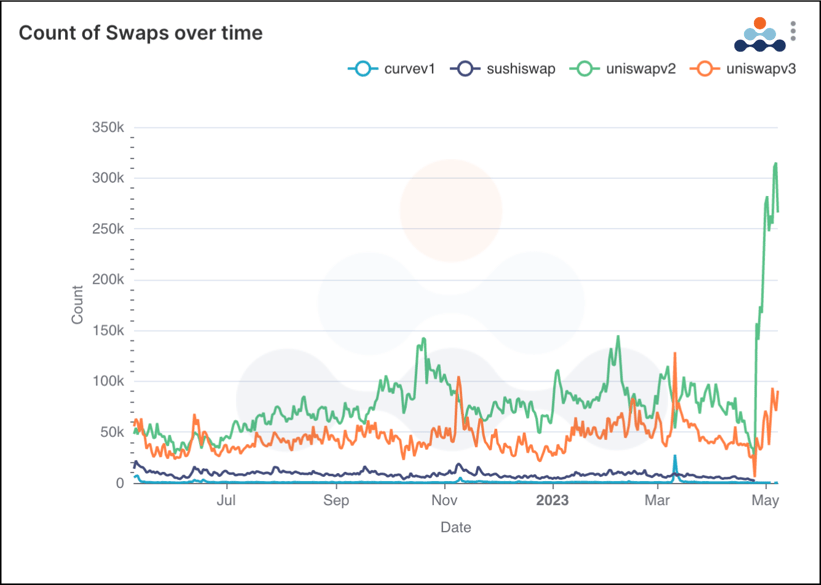 Swaps on DEXes over the last year
DEXes saw a large spike in activity this week, with the extreme popularity of memecoins such as the PEPE-WETH pair which saw 82.8k trades on Uniswap V2 and 92.4k trades on Uniswap V3. As usual when memecoins pump, other memecoins rise with them as investors look to catch the rising tide, regardless of the soundness of the investment. TURBO and POOH are two examples of memecoins that have benefited from PEPE’s meteoric rise this past week, seeing similar increases in trading volume and beating out traditionally popular pairs such as WETH-USDC. Of course, this does not imply that memecoins are viable; rather, it presents an opportunity for investors to not only profit from a short term pump, but also better understand the lifecycle of a memecoin. What are the top signals? What are the parameters to look for on when to exit? How do I detect a memecoin like this early? These questions can be answered with data and are pivotal to building a competitive strategy in non-standard crypto markets.
DeFi / Borrow Lend
 DeFi Lending protocol comparisons between this and last week
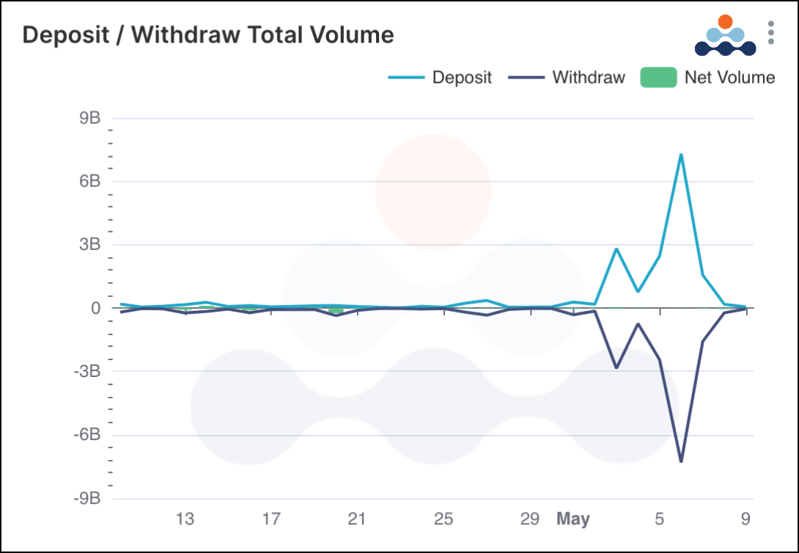 WETH deposit and withdraw volumes over the last 30 days
WETH has been the most active pool over the last 30 days, with deposit and withdraws volumes spiking over the last few days. Overall, WETH pools have had net outflows, presumably to fund memecoin trading.
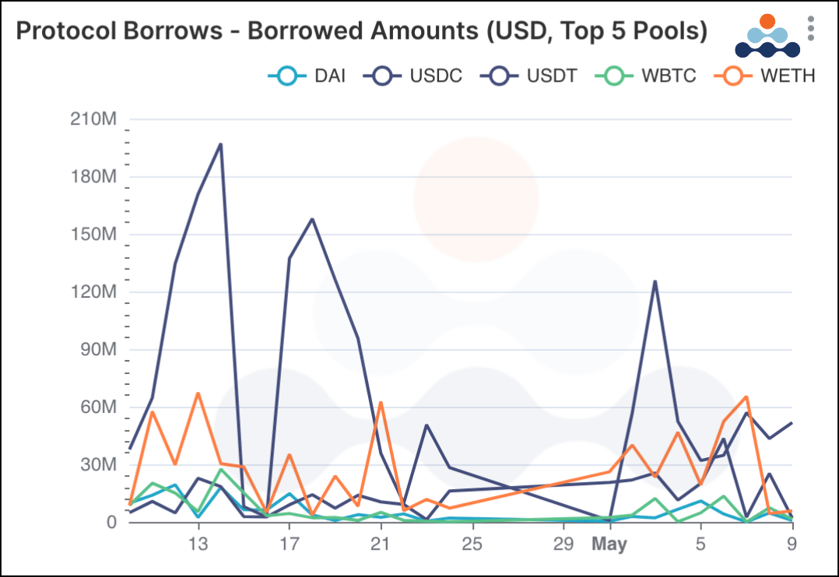 Top 5 assets borrowed across DeFi Lending platforms over the last 30 days
Borrowing has also fluctuated over the last 30 days with the memecoin wave somewhat increasing borrowed amounts, though borrowers appear to still have reservations about current market conditions. With the relatively low borrowed volumes combined with the extremely high trading volumes on DEXes, it seems that traders are playing with “cash-in-hand” rather than two in the bush.
Networks
 Network comparisons between this and last week
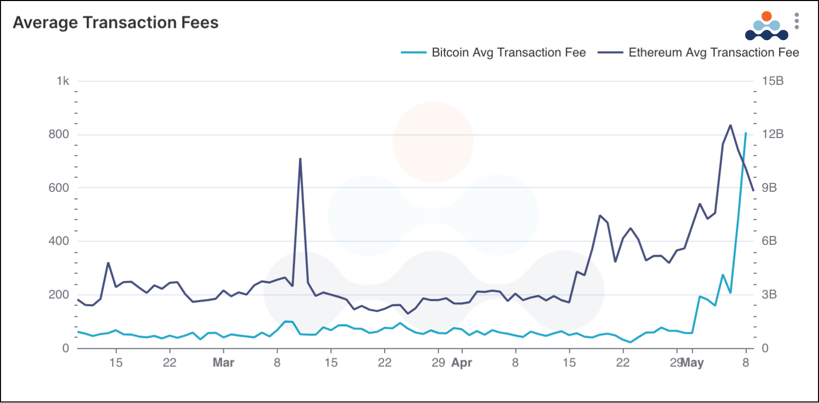 Bitcoin and Ethereum average transaction fees increasing since the start of May
Shockingly, for the first time in years, Bitcoin has seen a block with transaction fees higher than the block reward amount. This is due to the high demand for Bitcoin block space as the network dukes it out over its newfound discovery of tokenization in 2023. Popular projects such as Ordinals and BRC-20s lead the FOMO charge, with investors looking to snag a spot in the relatively small and infrequent block space.
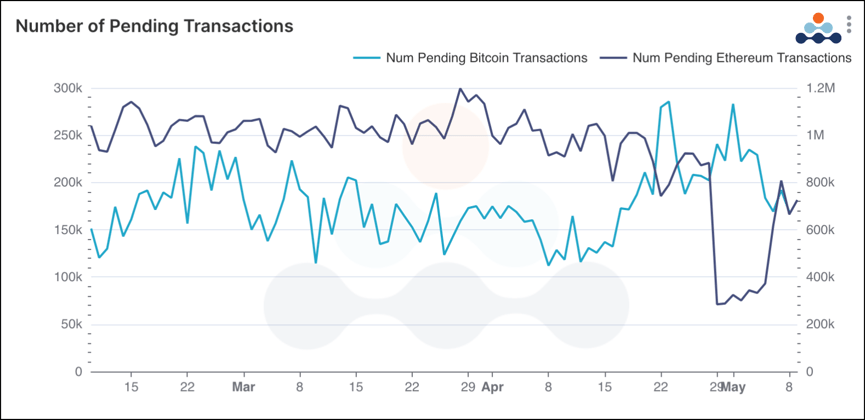 Bitcoin and Ethereum pending transactions over the last 90 days.
Pending BTC transactions hit levels as high as 1 million this past week, leading network developers and enthusiasts to grapple with Bitcoin’s relatively small block size and long confirmation time. The coming weeks will be interesting as we will see the grandfather of all cryptocurrencies debate on how and if it needs to modernize, as well as what that really means. This is not the first time this has happened: Bitcoin has faced many modernization challenges in the past, with most leading to hard forks such as Litecoin and Bitcoin Cash. Will the market rally around NFTs on Bitcoin? Only time will tell.
To download the report, click here.
Links
Spot Market
Spot market charts were built using the following endpoints:
- https://docs.amberdata.io/reference/market-metrics-exchanges-volumes-historical
- https://docs.amberdata.io/reference/market-metrics-exchanges-assets-volumes-historical
- https://docs.amberdata.io/reference/get-market-pairs
- https://docs.amberdata.io/reference/get-historical-ohlc
Futures
Futures / Swaps charts were built using the following endpoints:
- https://docs.amberdata.io/reference/futures-exchanges-pairs
- https://docs.amberdata.io/reference/futures-ohlcv-historical
- https://docs.amberdata.io/reference/futures-funding-rates-historical
- https://docs.amberdata.io/reference/futures-long-short-ratio-historical
- https://docs.amberdata.io/reference/swaps-exchanges-reference
- https://docs.amberdata.io/reference/swaps-ohlcv-historical
- https://docs.amberdata.io/reference/swaps-funding-rates-historical
DeFi DEXes
DEX charts were built using the following endpoints:
- https://docs.amberdata.io/reference/defi-metrics-exchanges-historical
- https://docs.amberdata.io/reference/defi-liquidity-historical
DeFi Borrow / Lend
DeFi lending charts were built using the following endpoints:
- https://docs.amberdata.io/reference/defi-lending-protocol-lens
- https://docs.amberdata.io/reference/lens-protocol-makerdao
- https://docs.amberdata.io/reference/lens-protocol-compound
Networks
Network charts were built using the following endpoints:
- https://docs.amberdata.io/reference/blockchains-metrics-latest
- https://docs.amberdata.io/reference/get-address-transactions
- https://docs.amberdata.io/reference/transactions-metrics-historical
- https://docs.amberdata.io/reference/blocks-metrics-historical
To download the report, click here
Amberdata
Amberdata is the leading provider of global financial infrastructure for digital assets. Our institutional-grade solutions deliver data, analytics and comprehensive tools and insights that empower financial institutions to research, trade, and manage risk and compliance in digital assets. Amberdata serves as a...
