Share this blog:
Opensea Faces Rough Waters
NFT trading platform Opensea, once the dominant platform in NFT trading, has received a Wells notice from the US Securities and Exchange Commission (SEC). According to Opensea co-founder and CEO, the Wells notice alleges that NFTs sold on the Opensea platform are securities. He stated on X: “We're shocked the SEC would make such a sweeping move against creators and artists. But we're ready to stand up and fight.” A Wells notice is often the final step before formal charges, laying out the commission’s argument and offering a rebuttal of claims.
https://www.npr.org/2024/08/28/nx-s1-5091295/telegram-ceo-pavel-durov-french-custody-investigation
Crypto Rollercoaster: Spot Trading Bounces Back After Wild Token Price Swings
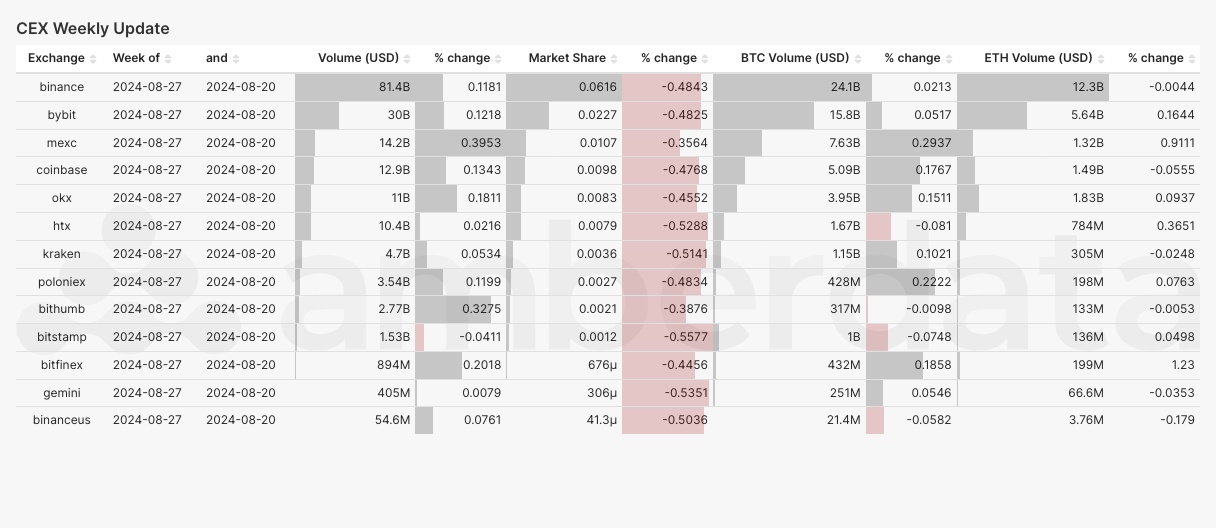
Centralized Exchange (CEX) comparisons
Exchange volume market share by CEX
Spot trading on centralized exchanges normalized last week after a short drop in trading volumes following a major swing in token prices. To recap, token prices on August 5th went through a turbulent period with BTC swinging from $60k to $50k in a matter of hours, then recovering quickly to over $64k. Price swings were applied to nearly every major token such as ETH and SOL. Looking more closely, the majority of trading on August 5th took place on Binance which saw trading volume market share jump from nearly 60% to over 68%, as well as Bybit which saw almost 3 times the usual trading.
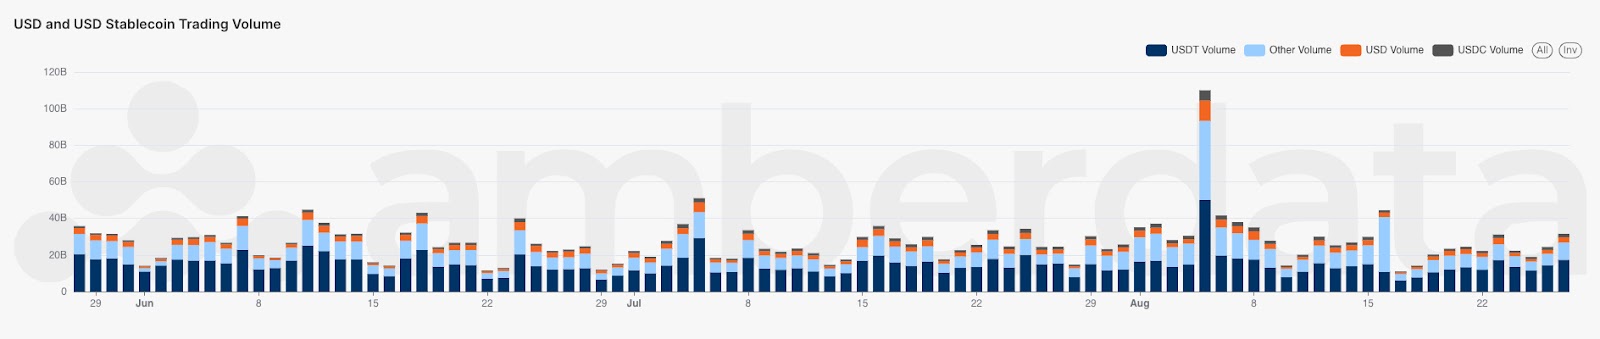
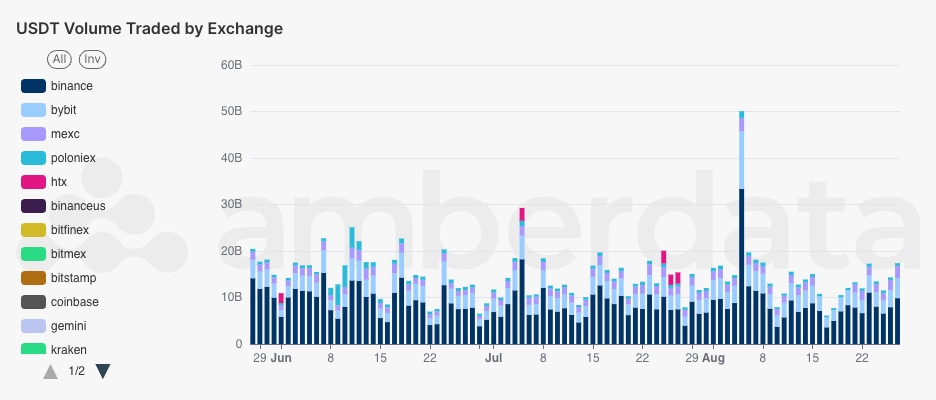
Exchange trading volume across all CEXs by trading pair type
Examining the pairs traded reveals an interesting piece of information. On a typical day, USDT trading makes up the majority of the trading on CEXs, with USDT pairs such as BTC/USDT or USDT/USDC trading far more than any other pair. During the crash, we can see that “Other Volume” (non-USD, non-USDC, non-USDT stablecoin trading pairs) was the large driver as traders moved from one digital asset (like BTC) to another. This shows that this crash didn’t affect every token but was isolated to just certain ones.
Did DeFi Lending Sound the Alarm? On-Chain Moves Hint at August 5th Price Plunge
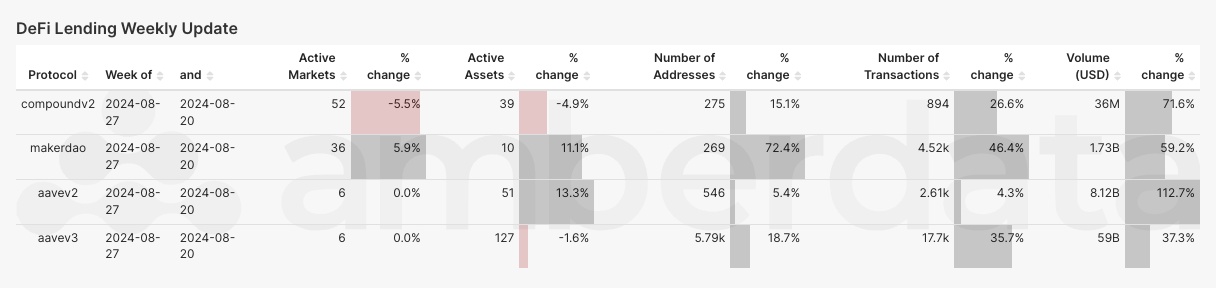
DeFi Lending protocol comparisons
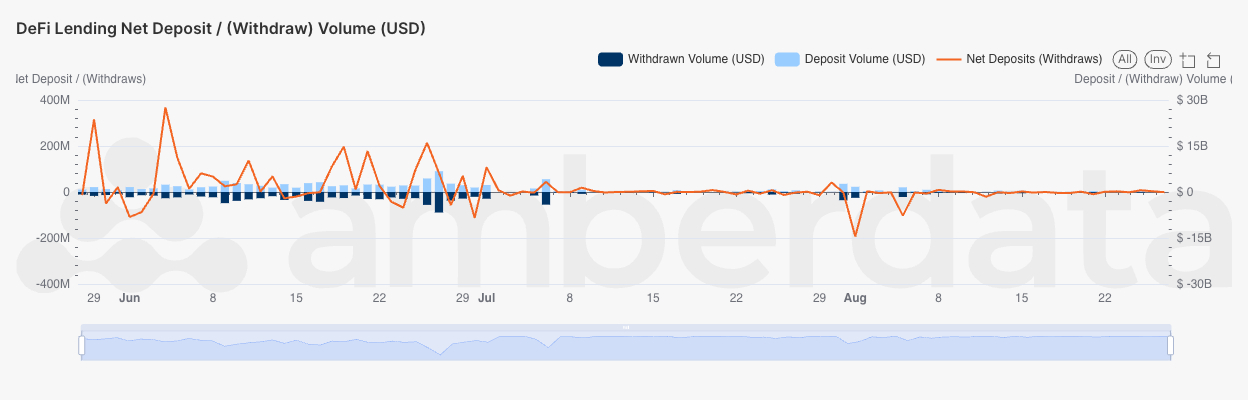
DeFi Lending deposits and withdrawals volume as well as net volume
DeFi Lending offers another interesting perspective on the August 5th price rollercoaster. Deposits and withdrawals had more or less flatlined starting in July, with net deposits and withdrawals on DeFi Lending protocols netting out to near $0. But we can see two major days of net withdrawals preceding the price crashes. Perhaps there was some warning (lending withdrawals could be a leading indicator) on-chain about an impending crash, or perhaps it was isolated to a single whale removing liquidity to sell tokens on Binance/Bybit.
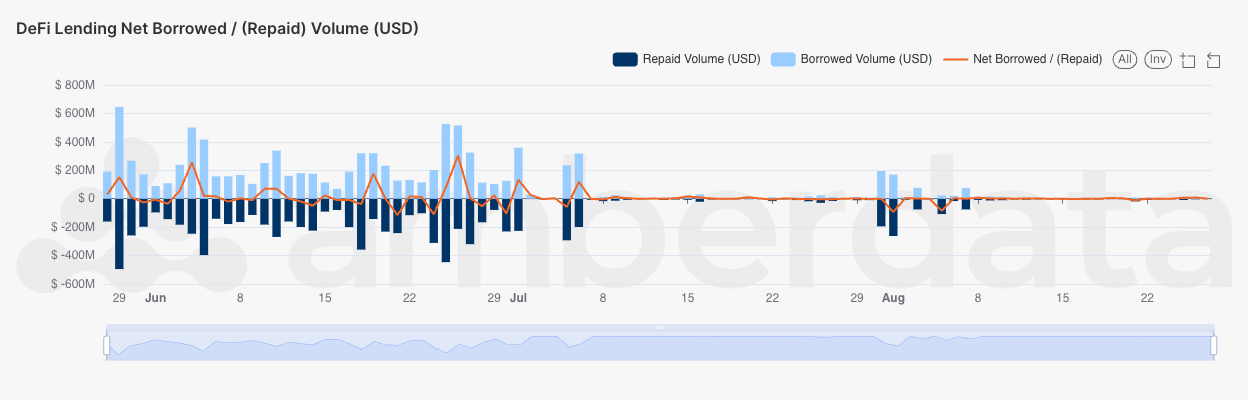
DeFi Lending borrowed and repayment volumes as well as net volume
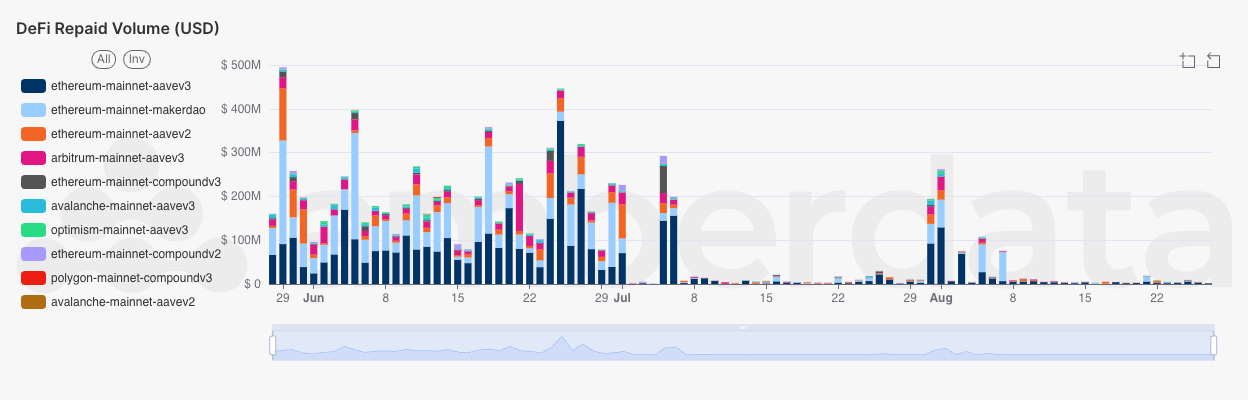
DeFi Lending repayment volumes by network and protocol
Yet another interesting facet in DeFi Lending comes from the repayment perspective. Prior to August 1st (which was a major day for withdrawals), loans across multiple protocols were wound down in a large way. Reducing loans makes sense for an impending price drop as it not only greatly reduces risks, but also allows the borrower to re-borrow at lower collateral values.
Miners Hold Steady: Bitcoin Miner Position Index Signals Bullish Trend Amid Historic Hold Streak
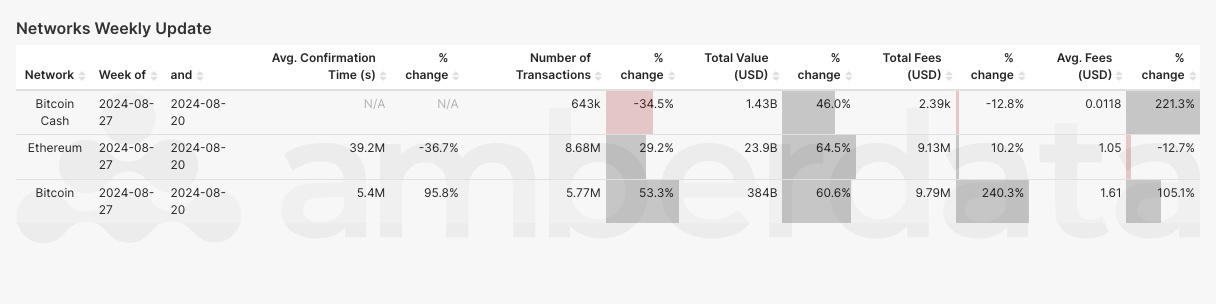
Network comparisons
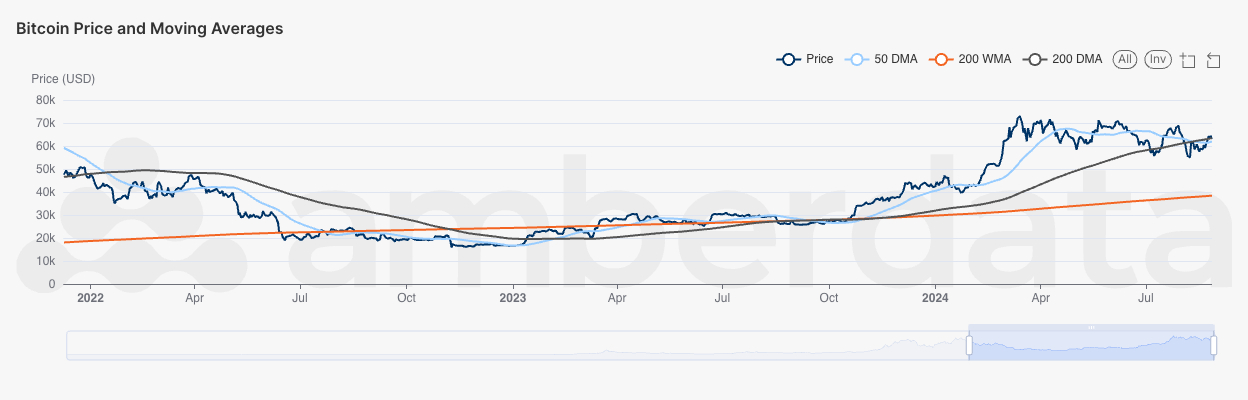
Bitcoin Price and Moving Averages
Bitcoin prices have also seen an SMA cross (Simple Moving Average) for the first time since Q3 2023. While not a commonly traded signal, the few times this indicator has crossed has led to price action in the months following.
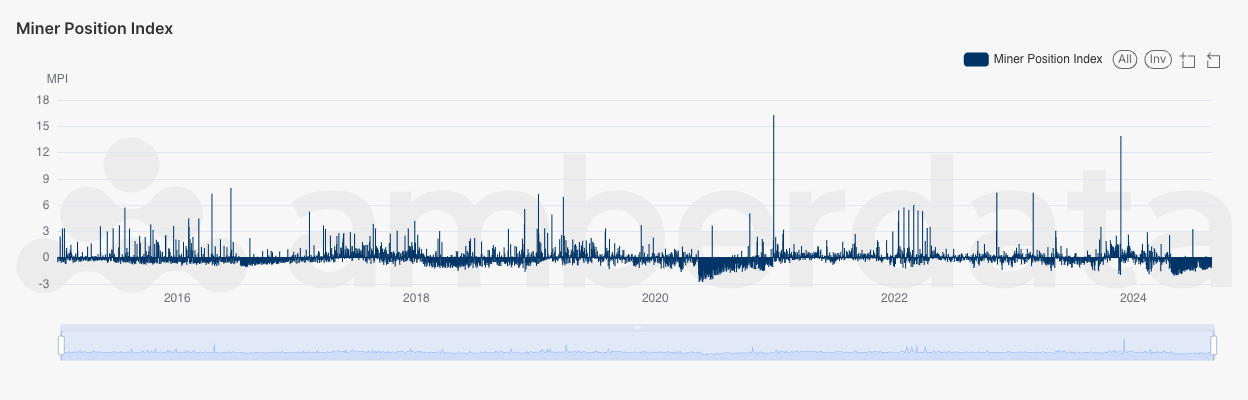
Bitcoin Miner Position Index
Most notably, the Bitcoin Miner Position Index (an indicator of tokens held or sold by miners) continues to run negative for the second longest streak in history. This indicator shows that miners are continuing to hold tokens. This is a very bullish signal that supply isn’t moving anywhere.
Links
AmberLens: intelligence.amberdata.com
Recent from Amberdata
Spot Market
Spot market charts were built using the following endpoints:
- https://docs.amberdata.io/reference/market-metrics-exchanges-volumes-historical
- https://docs.amberdata.io/reference/market-metrics-exchanges-assets-volumes-historical
- https://docs.amberdata.io/reference/get-market-pairs
Futures
Futures/Swaps charts were built using the following endpoints:
- https://docs.amberdata.io/reference/futures-exchanges-pairs
- https://docs.amberdata.io/reference/futures-ohlcv-historical
- https://docs.amberdata.io/reference/futures-funding-rates-historical
- https://docs.amberdata.io/reference/futures-long-short-ratio-historical
- https://docs.amberdata.io/reference/swaps-exchanges-reference
- https://docs.amberdata.io/reference/swaps-ohlcv-historical
- https://docs.amberdata.io/reference/swaps-funding-rates-historical
DeFi DEXs
DeFi DEX charts were built using the following endpoints:
- https://docs.amberdata.io/reference/defi-dex-liquidity
- https://docs.amberdata.io/reference/defi-dex-metrics
- https://docs.amberdata.io/reference/defi-impermanent-loss
DeFi Borrow/Lend
DeFi lending charts were built using the following endpoints:
- https://docs.amberdata.io/reference/defi-lending-protocol-lens
- https://docs.amberdata.io/reference/defi-lending-asset-lens
Networks
Network charts were built using the following endpoints:
- https://docs.amberdata.io/reference/blockchains-metrics-latest
- https://docs.amberdata.io/reference/transactions-metrics-historical
- https://docs.amberdata.io/reference/get-historical-transaction-volume
Disclaimers
The information contained in this report is provided by Amberdata solely for educational and informational purposes. The contents of this report should not be construed as financial, investment, legal, tax, or any other form of professional advice. Amberdata does not provide personalized recommendations; any opinions or suggestions expressed in this report are for general informational purposes only.
Although Amberdata has made every effort to ensure the accuracy and completeness of the information provided, it cannot be held responsible for any errors, omissions, inaccuracies, or outdated information. Market conditions, regulations, and laws are subject to change, and readers should perform their own research and consult with a qualified professional before making any financial decisions or taking any actions based on the information provided in this report.
Past performance is not indicative of future results, and any investments discussed or mentioned in this report may not be suitable for all individuals or circumstances. Investing involves risks, and the value of investments can go up or down. Amberdata disclaims any liability for any loss or damage that may arise from the use of, or reliance on, the information contained in this report.
By accessing and using the information provided in this report, you agree to indemnify and hold harmless Amberdata, its affiliates, and their respective officers, directors, employees, and agents from and against any and all claims, losses, liabilities, damages, or expenses (including reasonable attorney’s fees) arising from your use of or reliance on the information contained herein.
Copyright © 2024 Amberdata. All rights reserved.
