Share this blog:
The FTX saga may soon conclude with a twist: creditors are set to be repaid in full. After selling off assets following their infamous collapse in November 2022, creditors were stuck in limbo with $11 billion in the balance. With the market turnaround at the end of 2023, assets held by the company appreciated promptly, allowing them to pay off the debt fully. This amount unlocked is poised to enter the market again in some form, leading some to see bullish signals ahead.
Robinhood has also been caught in the SEC net of enforcement against crypto companies and was issued a Wells notice on May 4, 2024. The Wells notice alerted the company that the SEC plans to bring an enforcement action against them. The CEO has since stated his intentions of seeing the case out in court.
Spot Market
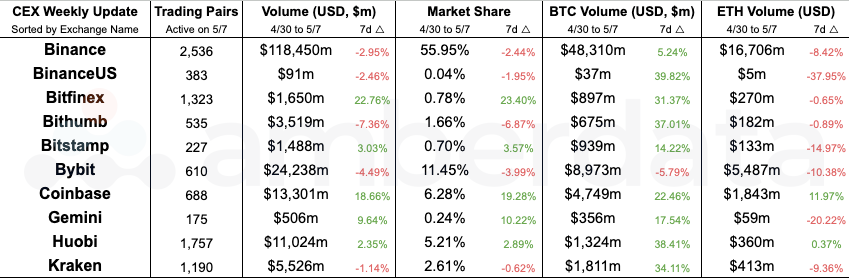
Centralized Exchange (CEX) comparisons from weeks 4/30/2024 and 5/07/2024
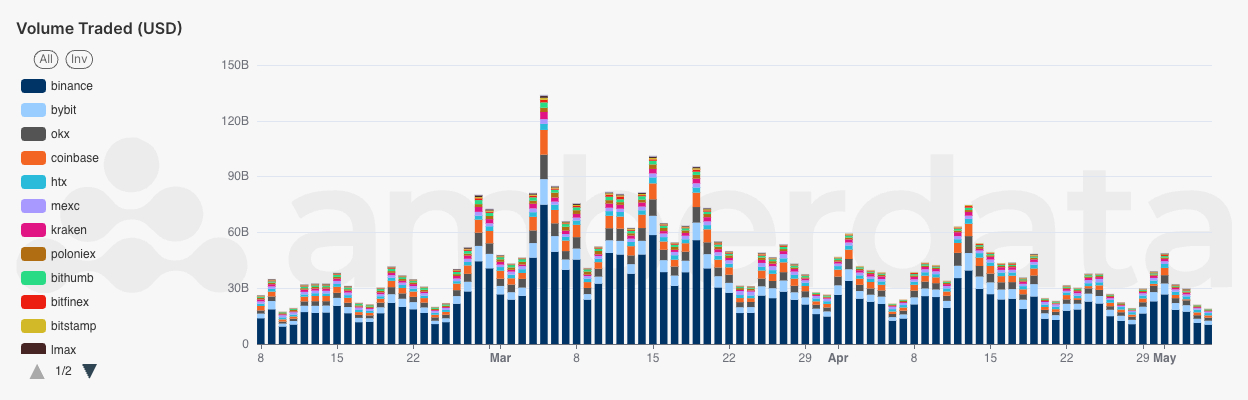
Spot trade volume by exchange since February 2024
Exchange volumes in the last few weeks have been declining since the March bounce. The last few weeks have been testing for the wider spot trading markets as news slows. Despite Coinbase’s massive beat on Q4 2023 earnings, Q1 2024 ended with a slowdown.
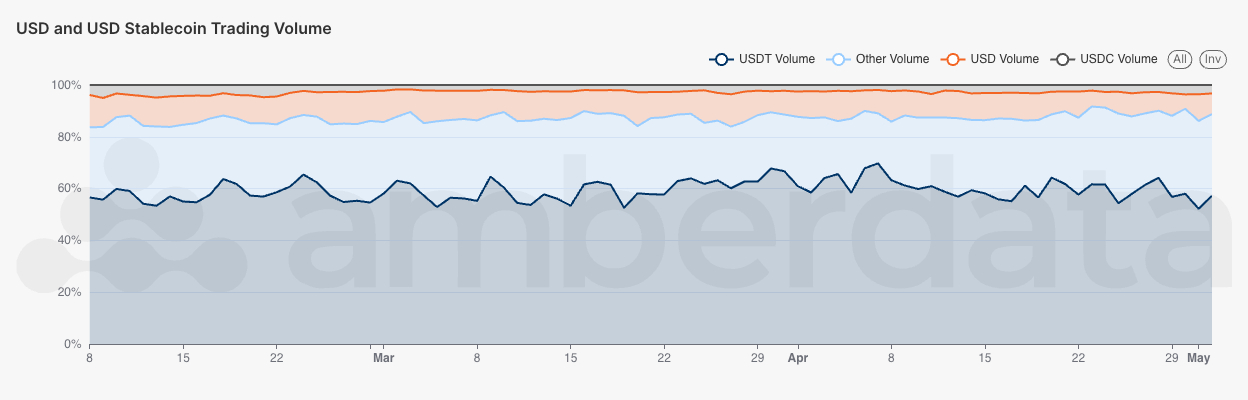
Trading volumes for USDT, USDC, and USD trading pairs across all centralized exchanges
An interesting trend to follow is seeing how USD, USDC, and USDT stablecoin volumes trend compared to the rest of the trading volume. Overall, there has been a reduction in trading volumes for these pairs, with volumes on non-USD and stablecoins growing. This may indicate that fiat on-ramps are slowing down, and we may see fewer new funds.
DeFi DEXs

Decentralized Exchange (DEX) protocol from weeks 4/30/2024 and 5/07/2024
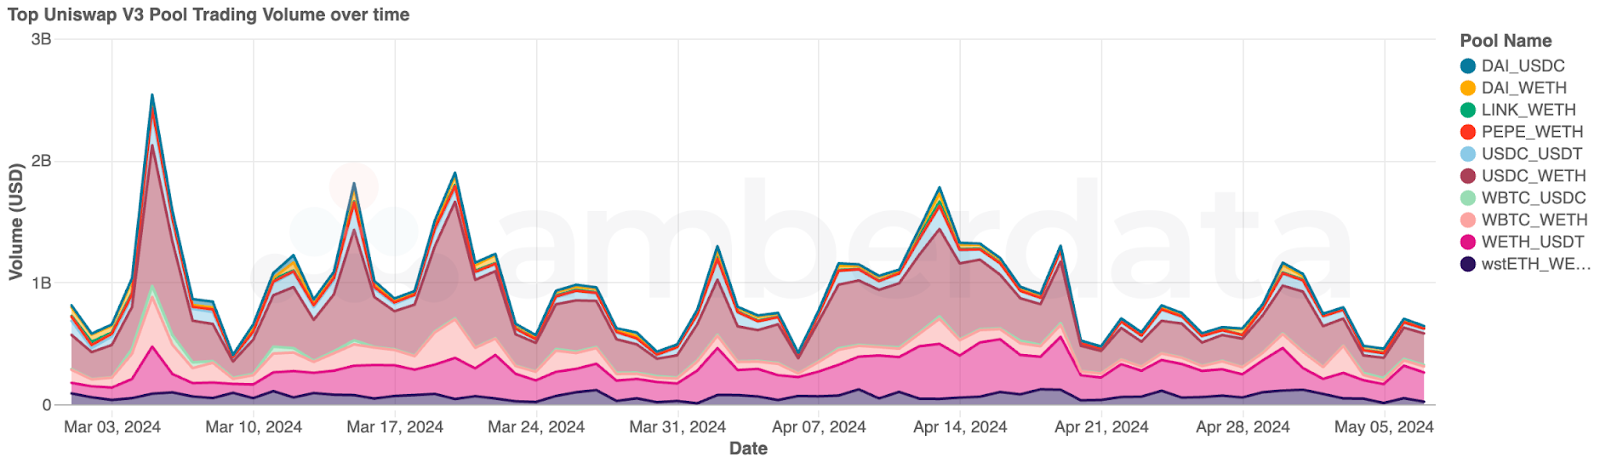
Uniswap v3 trading volume for top pools over the last 60 days
Uniswap v3 has also seen a recent slowdown in trading volumes, primarily driven by lower volumes this week than historically for WBTC/WETH, WETH/USDT, and USDC/WETH. These tokens were critical during the January bull run earlier this year.
DeFi Borrow/Lend
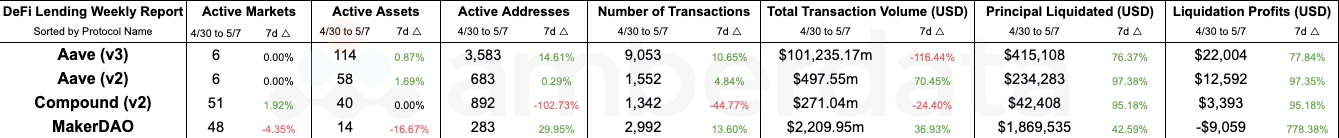
DeFi Lending protocol comparisons from weeks 4/30/2024 and 5/07/2024
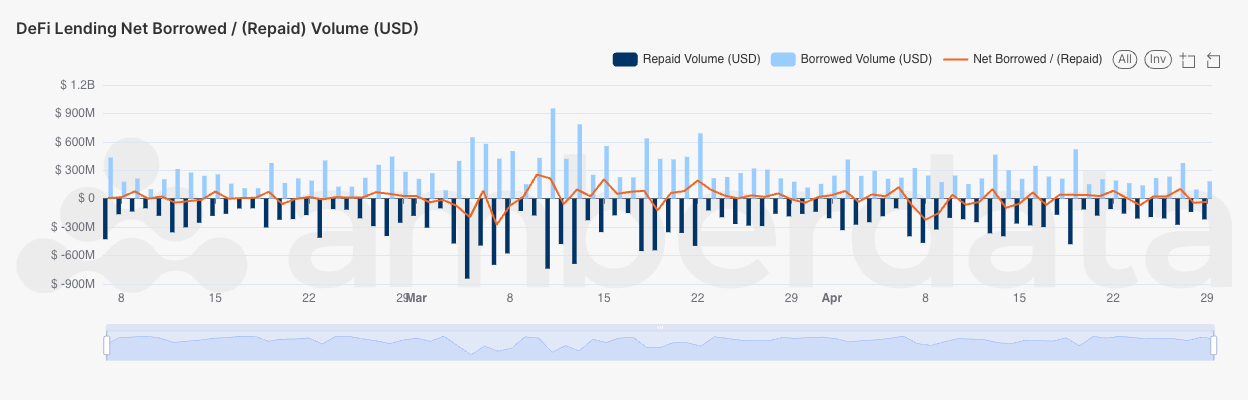
Net Borrow and Repay Volume over the past three months across all lending protocols
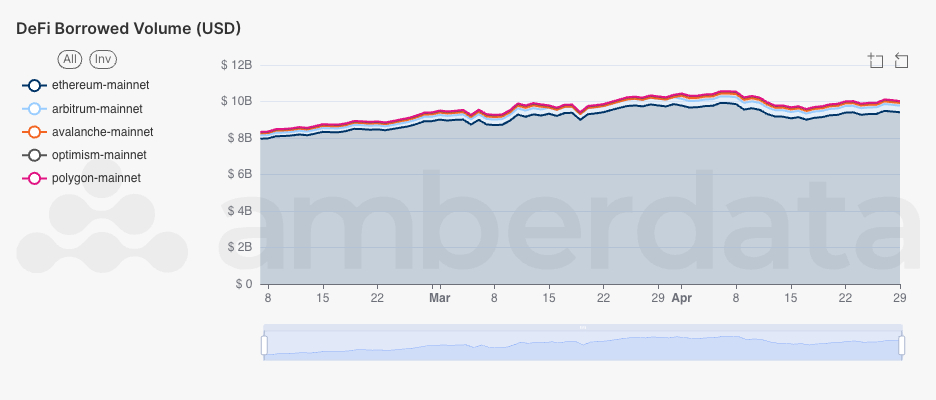
Total borrowed on DeFi protocols across Ethereum, Arbitrum, Avalanche, Optimsm, and Polygon
Despite declining trading volumes, total borrows in DeFi have not moved much since mid-March. Ethereum continues to dominate borrowed volumes, but it appears that borrowers are moving toward L2s. Arbirtum and Polygon are beginning to take away lending protocol volumes from Ethereum.
Networks
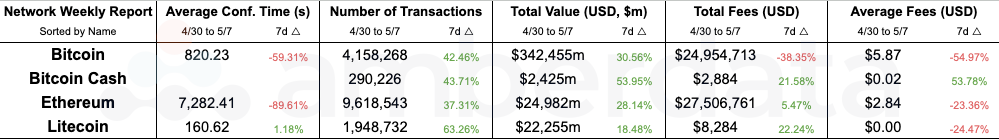
Network comparisons from weeks 4/30/2024 and 5/07/2024
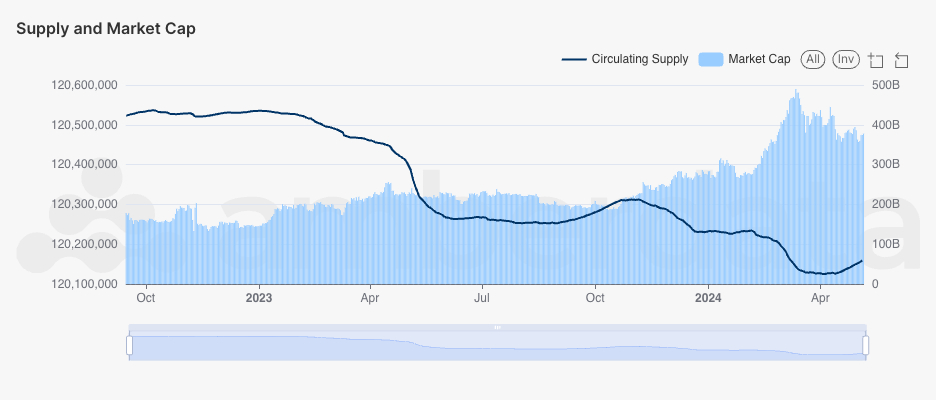
Ethereum Supply and Market Cap since September 2023
Ethereum supply has, for the second time since September 2023, started to tend upward. A rough comparison between market cap and circulating supply shows an inverse relationship as market cap began to decline around the same time supply began to increase. With L2s gaining traction on DeFi Lending protocols, we may see supply increasing over time as network fees decrease. Time will tell if the inverse relationship between supply and market cap will remain.
Links
AmberLens: intelligence.amberdata.com
Recent from Amberdata
- Amberdata: Institutional Crypto Investing Strategies
- Schwab Network: What’s Behind Recent Drop in Bitcoin?
- AMB Crypto: April 2024 Report – BTCFi dominance, Ethereum’s fall, and May forecast
- Bloomberg: DeFi Comeback Renews Questions of the Sustainability of 20% Returns
Spot Market
Spot market charts were built using the following endpoints:
- https://docs.amberdata.io/reference/market-metrics-exchanges-volumes-historical
- https://docs.amberdata.io/reference/market-metrics-exchanges-assets-volumes-historical
- https://docs.amberdata.io/reference/get-market-pairs
- https://docs.amberdata.io/reference/get-historical-ohlc
Futures
Futures/Swaps charts were built using the following endpoints:
- https://docs.amberdata.io/reference/futures-exchanges-pairs
- https://docs.amberdata.io/reference/futures-ohlcv-historical
- https://docs.amberdata.io/reference/futures-funding-rates-historical
- https://docs.amberdata.io/reference/futures-long-short-ratio-historical
- https://docs.amberdata.io/reference/swaps-exchanges-reference
- https://docs.amberdata.io/reference/swaps-ohlcv-historical
- https://docs.amberdata.io/reference/swaps-funding-rates-historical
DeFi DEXs
DeFi DEX charts were built using the following endpoints:
- https://docs.amberdata.io/reference/defi-dex-liquidity
- https://docs.amberdata.io/reference/defi-dex-metrics
- https://docs.amberdata.io/reference/defi-impermanent-loss
DeFi Borrow/Lend
DeFi lending charts were built using the following endpoints:
- https://docs.amberdata.io/reference/defi-lending-protocol-lens
- https://docs.amberdata.io/reference/defi-lending-asset-lens
Networks
Network charts were built using the following endpoints:
- https://docs.amberdata.io/reference/blockchains-metrics-latest
- https://docs.amberdata.io/reference/transactions-metrics-historical
- https://docs.amberdata.io/reference/get-historical-transaction-volume
