Share this blog:
With our frequently-referenced USD stablecoins dashboard, we’ve leveled up our coverage by adding several core metrics centered around USD stablecoins – and introduced EUR stablecoin coverage. The metrics covered below apply to both USD stablecoins and EUR stablecoins, but we’ve highlighted EUR stablecoins here.
Prices
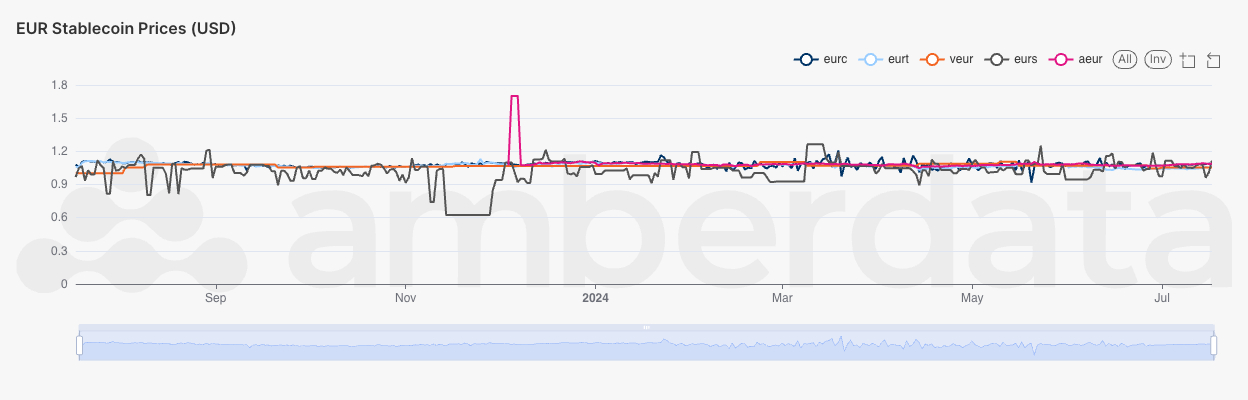
Daily Stablecoin Prices in USD
Stablecoins aren’t always stable, and when they are volatile there is a major arbitrage opportunity. In the case of Euro stablecoins, there is likely significant arbitrage to be had. For EUR stablecoins, we track prices in both USD values and EUR values, which allows for both USD/EUR arbitrage spotting and EUR stablecoin/EUR arbitrage spotting.
Issuance, Circulating Supply, and Market Capitalization
Stablecoin growth, especially those backed by fiat, is solely driven by issuance. As tokens are issued, the presumption is that $1 (or in this case 1€) is deposited into a bank account. Daily spikes in issuance represent large movements of deposits into a bank account, adding even more credence to the stablecoin and its adoption on-chain.
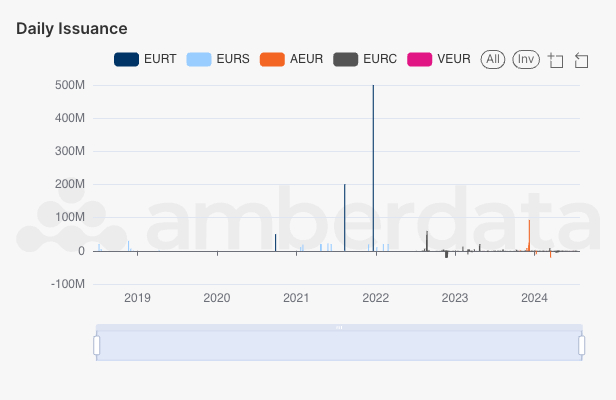
Daily Stablecoin Issuance by Token
As we can see in daily stablecoin issuance, EURS is a long-standing stablecoin having been around since 2018. However, EURT (Tether EUR) has been issuing stablecoins in large volumes since 2021.
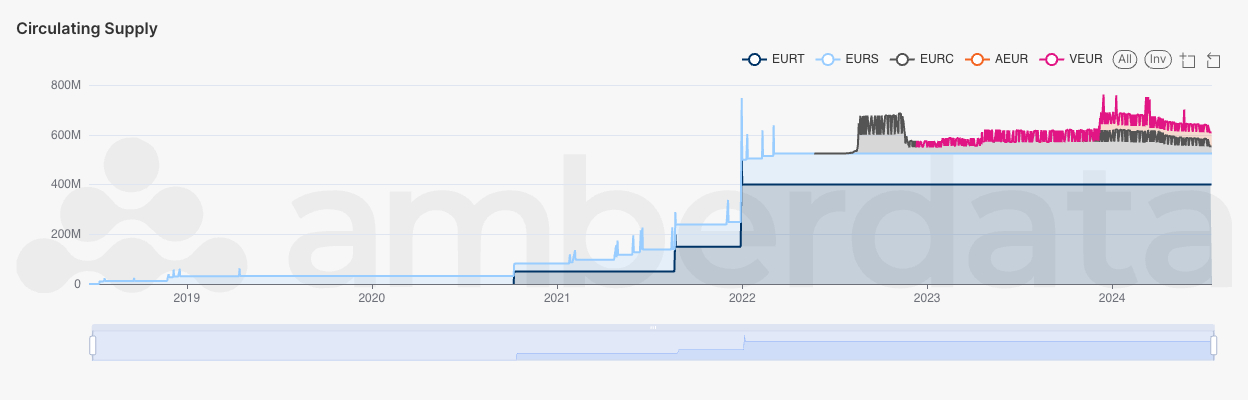
Circulating Supply by Token
Circulating supply, a rolling sum of issuance, is a great way to track this adoption over time as the rolling sum shows changes better than daily issuance. Interestingly, EURT which had large spikes in issuance, has only limited mints. With MiCA in Europe being adopted holding strict rules for stablecoins, circulating supply will be interesting to follow as adoption is likely to become very volatile over the next few years.
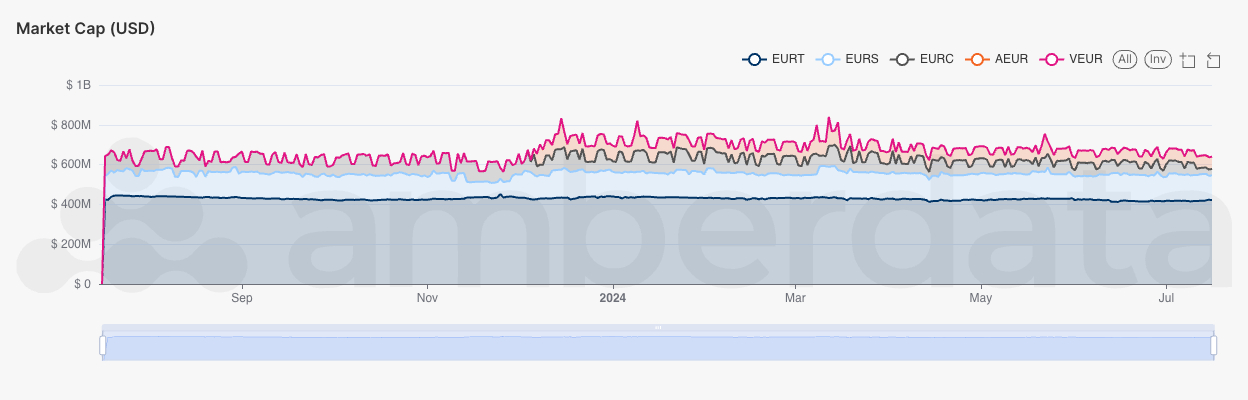
EUR Stablecoin Market Cap in USD
Market capitalization is another great way to track the growth (or change) in stablecoin adoption over time as the price volatility can dramatically show shifts over time. With stablecoin arbitrage being an integral part of price stability, ebbs and flows in market capitalization show dramatic fluctuations over time where issuance has largely flattened.
Holders & Transfers
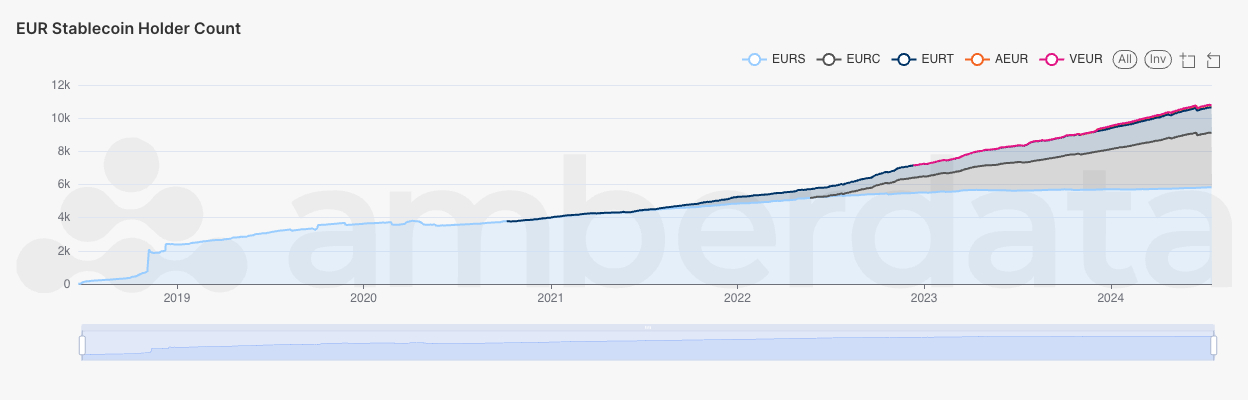
Number of Token Holders by Stablecoin
While not trivial, token holder counts are another indicator of growth. Here we can see that despite insignificant growth in circulating supply, token holder counts have been steadily increasing.
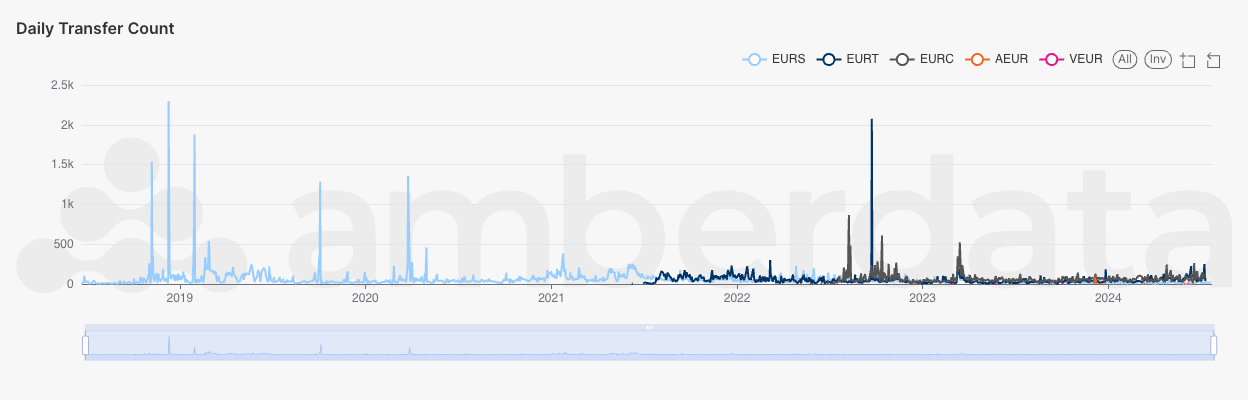
Daily Transfer Count
Transfers are great to track as circulating supply grows, as it is a critical component of real adoption. As users adopt tokens, to have actual usage they will have to transfer them to others for remittances, usage on DeFi, trading on centralized exchanges, etc. Following transfers is a great source of information in terms of real adoption and risk.
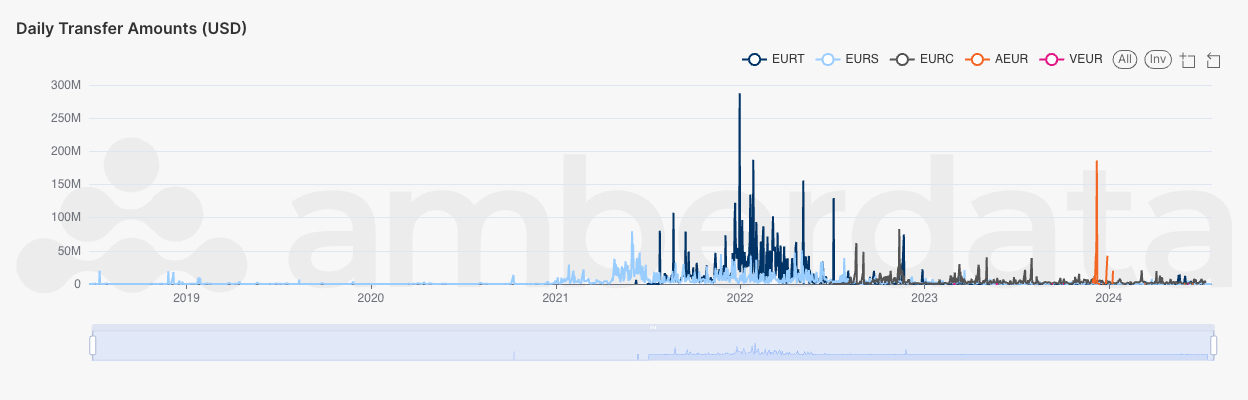
Daily Transfer Amounts (in USD)
In addition to transfer counts, transfer amounts are another component of risk evaluation. Some tokens may have high transfer volumes, but with no change in user counts it’s a major indication of fake volume or exchange in/out flows or rebalances.
Conclusion
Stablecoins are a major real-world asset and have solidified their place as a critical infrastructure on the blockchain. When it comes to metrics, these new insights should provide value to researchers and analysts alike. Our metric datasets are crucial for traders and are available across our data distribution providers like Databricks, Snowflake, and Google Big Query.
