Amberdata Crypto Snapshot: Grayscale's Victory, SEC vs NFTs, & DAOs
Greyscale’s GBTC lawsuit victory is the first big win and a huge step forward for Bitcoin spot ETFs. There are several big statements made by the court, including: “The denial of Grayscale’s proposal was arbitrary and capricious because the [Securities Exchange] Commission failed to explain its different treatment of similar products.” The court examined the existing and previously approved Bitcoin futures ETF offerings to conclude the case. While this ruling does not mean that spot ETFs have been approved, it does open the door for several notable ETFs pending SEC approval.
Meanwhile, the SEC has conducted their first action against an NFT project, charging Los Angeles media company Impact Theory with an unregistered securities offering. This case, in which Impact Theory agreed to terms with the SEC (including shutting down the project, paying a $6.1m penalty, and refunding holders) is likely the first of many against NFT collections. The SEC has previously shown their crypto prowess by charging multiple centralized exchanges, DAOs, and now NFT collections.
In related news, a federal judge has ruled that a decentralized autonomous organization is an association. This case affirms the Treasury Department’s Office of Foreign Assets Control (OFAC) is entitled to cite Tornado Cash under sanctions statutes, potentially opening the door to more suits against DAOs or projects where no clear ownership exists. In the Coinbase-sponsored defense, the judge also determined smart contracts deployed by Tornado Cash constitute “property” subject to sanctions under OFAC's broad regulatory definitions.
Spot Market
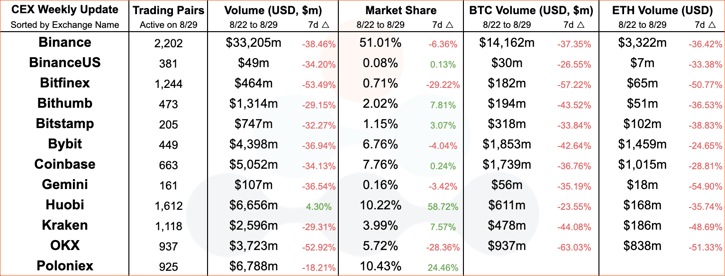
Centralized Exchange (CEX) comparisons from weeks 08/28/2023 and 08/21/2023.
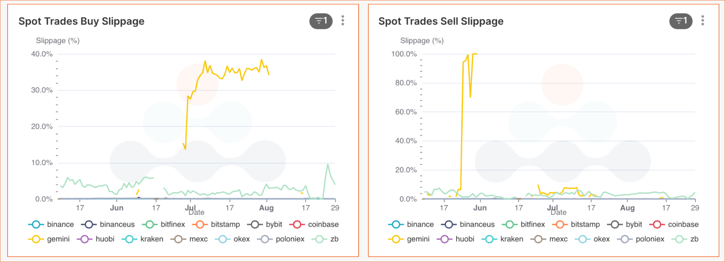
Centralized Exchange (CEX) BTC/USDT slippage from the last 90 days.
Buy-side slippage on Gemini for BTC/USDT reached its absolute highest levels in July this year as SEC statements around the inadequacy of Bitcoin spot ETF filings caused price drops on BTC, ETH, and various alt-coins. July also brought about the release of US CPI data, which sent traditional markets into positive figures and raised tides for BTC and other tokens. Sell slippage also hit absolute highs on Gemini in June as USDT began to depeg (which has yet to recover). This was likely caused by a major pool imbalance on Curve’s 3pool which consists of USDT, USDC, and DAI stablecoins. The 3pool is a stablecoin pool that generally has a 33.3% split balance between the 3 tokens. However, traders selling large quantities of USDT (for USDC and DAI in return) caused the pool to consist of over 72% USDT.

Centralized Exchange (CEX) ETH/USDT slippage from the last 90 days.
Despite Gemini’s high slippage costs for BTC/USDT, the same could not be said for ETH/USDT, which had near zero values for the last 90 days on Gemini. However, ZB saw similar high slippage values for ETH/USDT – roughly the same amount of slippage as they have for BTC/USDT. With buy-side slippage sliding from nearly 10% in May to around 4% and sell-side slippage sitting near 5%, the Chinese-based crypto exchange has been wavering on liquidity for two of the most popular trading pairs.
DeFi DEXs

Decentralized Exchange (DEX) protocol from weeks 08/28/2023 and 08/21/2023.
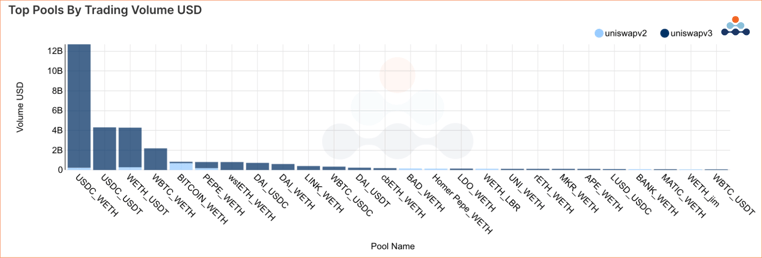
Decentralized Exchange (DEX) top pools by trading volume over the last 90 days.
USDC/WETH is the undisputed king of DEX trading pairs. Over the last 90 days, the pool has had over $12 billion in trading volume on Uniswap v3 alone, surpassing trading volume for the next three most popular pools combined. With USDT depegging, USDC may be becoming an even more important secondary stablecoin in a trader’s arsenal.
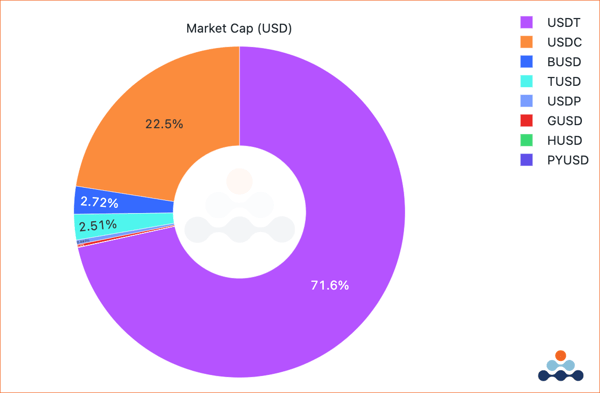
Stablecoin market cap dominance for fiat-backed USD stablecoins as of 08/30/2023.
USD stablecoins are by far dominated by Tether (USDT), with USD Coin (USDC) having less than a quarter of USDT’s market capitalization. Given the DEX trading preferences for USDC, this will be an interesting metric to track. It will also be interesting to understand how these stablecoins are used - are they more commonly used in non-custodial wallets, or are they more popular in custodial wallets like Binance or Coinbase? Keep an eye out for more on our blog as we share USD stablecoin primers in the coming weeks.

Decentralized Exchange (DEX) top pools by daily trading volume over the last 90 days.
Not to be lost or forgotten, memecoin PEPE continues to play a role on DEXs as a top trading pair and saw spikes of trading volume over the last week. Meanwhile, USDC/USDT pair trading volume dominance has waned recently – likely because USDT is recovering from their depegging event and arbitrage opportunities are few and far between.
DeFi Lending/Borrowing

DeFi Lending protocol comparisons from weeks 08/28/2023 and 08/21/2023.

DeFi Lending total deposit and withdrawal volumes over the last 30 days.
Overall activity on DeFi Lending protocols has been waning recently, and total volumes have faced large declines since the beginning of August.
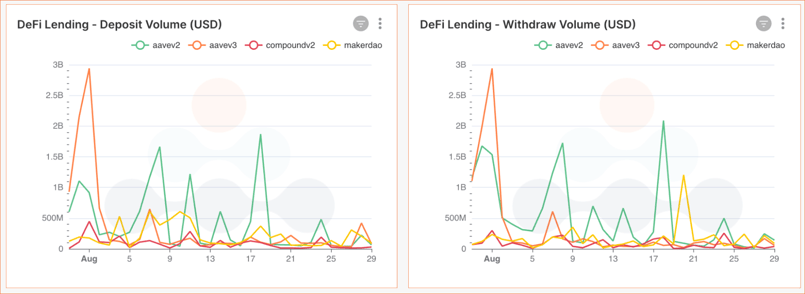
DeFi Lending deposit and withdrawal volumes by protocols over the last 30 days.
This trend hasn’t been isolated to any one protocol, either. It appears that almost all lending protocols have been affected as yield opportunities on Ethereum appear to be drying. What’s more likely is that the market is starting to move away from Ethereum as protocols have now launched on multiple L2s (or even different L1s).
Blockchain Networks

Network comparisons from weeks 08/28/2023 and 08/21/2023.

Daily network transaction counts since 2020.
Bitcoin transactions have increased dramatically since the launch of Ordinals, which has likely taken volume away from Ethereum. Since 2023, Ethereum has slowly maintained transaction volume, though we are starting to see signs of decreasing transaction counts on the network. L2s have arguably been more interesting lately with meme tokens (ex. BALD) and social dApps (ex. friend.tech) providing traders with opportunities to earn high yields, in addition to the ongoing bear market’s inability to draw users or rebuild traction. All of these combined factors seem to have decreased a lot of the excitement that NFT collections were able to generate just a few years ago, which caused extremely high gas and transactions.
Links
Recent Coverage
- Coindesk: Ethereum Handled Friend.tech Frenzy Without 'Gas Fee' Spike. Why That’s a Big Deal
- Nasdaq Trade Talks: The Convergence of Traditional Financial Institutions With Web3
- CNBC: Altcoins slide to begin the week while bitcoin and ether stabilize
- Coinspeaker: Bitcoin and Ether Stabilize while Other Altcoins Enter Deep Correction
- Coindesk: Ether-Bitcoin Ratio Uptick Fails to Inspire Bullish Positioning in ETH Options
Spot Market
Spot market charts were built using the following endpoints:
- https://docs.amberdata.io/reference/market-metrics-exchanges-volumes-historical
- https://docs.amberdata.io/reference/market-metrics-exchanges-assets-volumes-historical
- https://docs.amberdata.io/reference/get-market-pairs
- https://docs.amberdata.io/reference/get-historical-ohlc
Futures
Futures / Swaps charts were built using the following endpoints:
- https://docs.amberdata.io/reference/futures-exchanges-pairs
- https://docs.amberdata.io/reference/futures-ohlcv-historical
- https://docs.amberdata.io/reference/futures-funding-rates-historical
- https://docs.amberdata.io/reference/futures-long-short-ratio-historical
- https://docs.amberdata.io/reference/swaps-exchanges-reference
- https://docs.amberdata.io/reference/swaps-ohlcv-historical
- https://docs.amberdata.io/reference/swaps-funding-rates-historical
DeFi DEXs
DEX charts were built using the following endpoints:
- https://docs.amberdata.io/reference/defi-metrics-exchanges-historical
- https://docs.amberdata.io/reference/defi-liquidity-historical
DeFi Borrow/Lend
DeFi lending charts were built using the following endpoints:
Amberdata
Amberdata is the leading provider of global financial infrastructure for digital assets. Our institutional-grade solutions deliver data, analytics and comprehensive tools and insights that empower financial institutions to research, trade, and manage risk and compliance in digital assets. Amberdata serves as a...
