Share this blog:
In this week’s Digital Asset Snapshot, Crypto AI Agents saw their market cap plunge 65% in one month—from $20B to about $7B—even as tokens like ARC and AI16Z rebounded strongly. Meanwhile, the DeFAI sector remains the only area with month-to-date gains, driven by AGIX’s 5.8% rise and increased trading volumes. Trump’s WLFI launched its Macro Strategy Fund to support Bitcoin, Ether, and altcoins, bridging TradFi and DeFi. Additionally, stablecoin metrics show rising USDC velocity and holder totals, while divergent long/short ratios and lower exchange volumes indicate a shift toward market stabilization.
News
- Crypto AI Agents Market Cap Plunge
Crypto AI Agents have seen their market cap tumble by 65% in one month—from $20 billion to about $7 billion—even as tokens like ARC and AI16Z post significant rebounds amid sector uncertainty. - DeFAI Sector Outperforms Others
The DeFAI sector, blending decentralized finance with artificial intelligence, remains the only crypto segment with positive gains this month, driven by AGIX’s 5.8% increase and a 45% surge in trading volume. - Trump’s WLFI Macro Strategy Fund Launched
Trump’s WLFI blockchain platform has unveiled a “Macro Strategy” fund to support Bitcoin, Ether, and altcoins, aiming to bridge traditional finance and DeFi while enhancing financial stability.
Market Analysis
- Stablecoin Velocity Trends Mixed
USDC is setting new velocity records, signaling robust trading activity, whereas USDT’s lower figures point to a more cautious sentiment among stablecoin traders. - Stablecoin USD Holders Rise Steadily
USDC and USDT holder totals continue to climb—USDC from $25 billion to nearly $37 billion and USDT from $55 billion to around $77 billion—reflecting growing investor commitment. - Binance vs. Bybit Long/Short Ratios Diverge
While Binance’s ratios indicate a strong bullish shift for SOL, BTC, and ETH, Bybit’s more modest moves suggest a cautious trading environment. - Exchange Volumes Pull Back
Trading volumes have retreated from December’s spikes, indicating a transition toward a more stable market environment.
News
Crypto AI Agents: Market Cap Plunge Amid Uncertainty and Early Signs of Recovery
Crypto AI Agents have seen their total market cap tumble by 65% in just one month—from $20 billion to approximately $7 billion—amid growing uncertainty in the sector. While many tokens are struggling, some standout performers are showing resilience. Notably, ARC surged by nearly 96% over the past week, and AI16Z gained around 50%, positioning these tokens as key drivers in what appears to be a potential recovery for part of the market. Despite the overall decline, VIRTUAL, the largest token in the space, is up about 10% this week, though it still faces challenges in reclaiming its previous dominance.
Smart account engagement, a critical indicator of seasoned investor activity, has been on the decline; however, the rate of this drop has started to slow, hinting at a possible stabilization in the market. In addition, the diverse blockchain distribution—with several tokens launching on Base and Solana compared to fewer on Ethereum and BNB—could set the stage for renewed interest if AI-driven narratives gain traction once again. Overall, while the broader market remains under pressure, pockets of recovery among top tokens suggest that Crypto AI Agents might be poised for a rebound if investor confidence returns.
DeFAI Sector: Leading the Charge with Positive Month-to-Date Gains
Despite a broader market downturn, the DeFAI sector—merging decentralized finance with artificial intelligence—remains the only area in crypto showing month-to-date gains. According to Miles Deutscher on February 12, 2025, the sector’s index is up by 3.2% since the start of the month, driven primarily by SingularityNET (AGIX), which has surged 5.8% in the same period. AGIX’s trading volume has also jumped to an average of $23.4 million per day—a 45% increase from the previous week—highlighting strong investor interest.
Trading activity further reinforces this momentum. On Binance, the AGIX/BTC pair saw a 35% volume increase in the past 24 hours, while Uniswap’s AGIX/ETH pair recorded a 20% rise. On-chain metrics show a 15% boost in active AGIX addresses, now totaling 12,500, and technical indicators like an RSI of 68 and a bullish MACD crossover point to continued upward trends. A recent announcement of a new AI-powered DeFi protocol also spurred a 7% price jump, suggesting that renewed AI developments could further drive the sector’s recovery and present attractive trading opportunities.
Trump’s WLFI Macro Strategy Fund: Bridging TradFi and DeFi
US President Donald Trump’s WLFI blockchain platform has launched its “Macro Strategy” fund to support the growth of major cryptocurrencies such as Bitcoin, Ether, and other altcoins. The fund aims to strengthen projects at the forefront of reshaping global finance by diversifying holdings across a range of tokenized assets. According to the February 11 announcement, the initiative is designed to enhance financial stability and unlock emerging opportunities within the decentralized finance (DeFi) landscape.
In addition to fueling crypto growth, WLFI is actively targeting partnerships with traditional finance institutions to help bridge the gap between TradFi and DeFi. This move comes amid speculation that the Trump family might expand its presence on Ethereum, as suggested by Joseph Lubin. The fund’s launch, therefore, not only marks a strategic reserve for digital assets but also signals an effort to integrate cutting-edge blockchain technology into mainstream finance, potentially setting new industry standards in the process.
Market Analysis
Stablecoin Velocity Trends
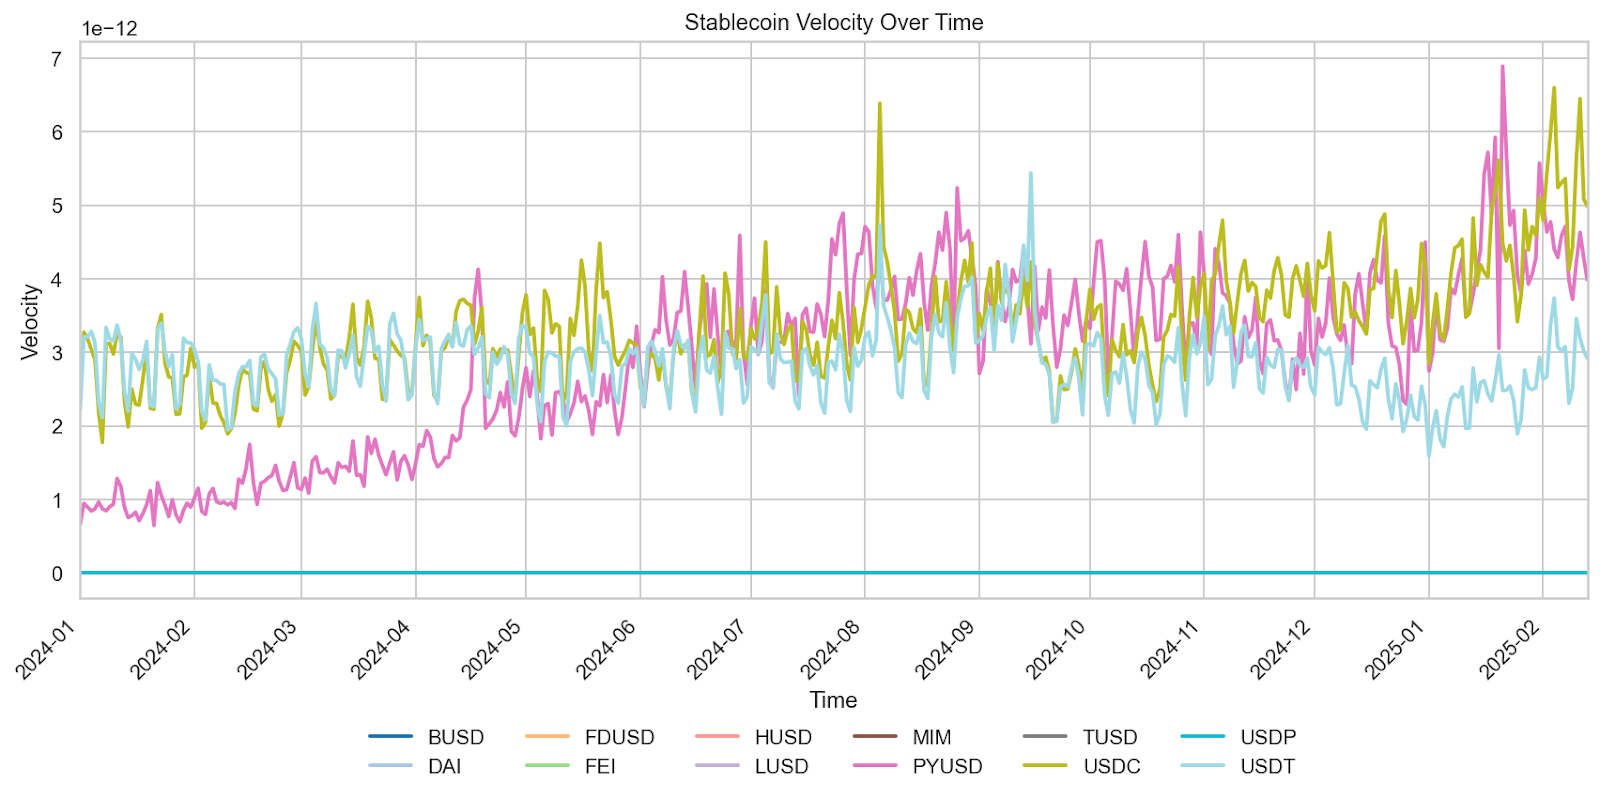
The stablecoin velocity metric, defined as the ratio of on-chain transaction volume to circulating supply, provides a dimensionless indicator of how actively a stablecoin is traded. Since early January, the velocity of key assets has been on an upward trend, reflecting a renewed trading fervor. PyUSD, for example, experienced an initial surge in activity before settling into a consistent, stable pattern that suggests a more balanced liquidity environment. This measure, calculated without any fixed units, offers insight into the underlying health and usage frequency of these digital currencies.
USDC has set new records with its velocity, pointing to robust market engagement and elevated trading volumes. Its peak levels signal strong investor confidence and aggressive trading behavior. In contrast, USDT’s velocity remains below figures seen in Q3, hinting at lingering caution or a shift toward alternative assets. Such contrasting dynamics among stablecoins can influence overall liquidity, risk distribution, and trading strategies in the digital asset sphere. Monitoring these trends is crucial, as they reveal evolving market sentiment and potential inflection points. Traders may find these metrics invaluable in anticipating shifts in liquidity and momentum. Staying abreast of these trends can help investors optimize strategies and manage risk effectively with greater impact.
Stablecoin USD Holders
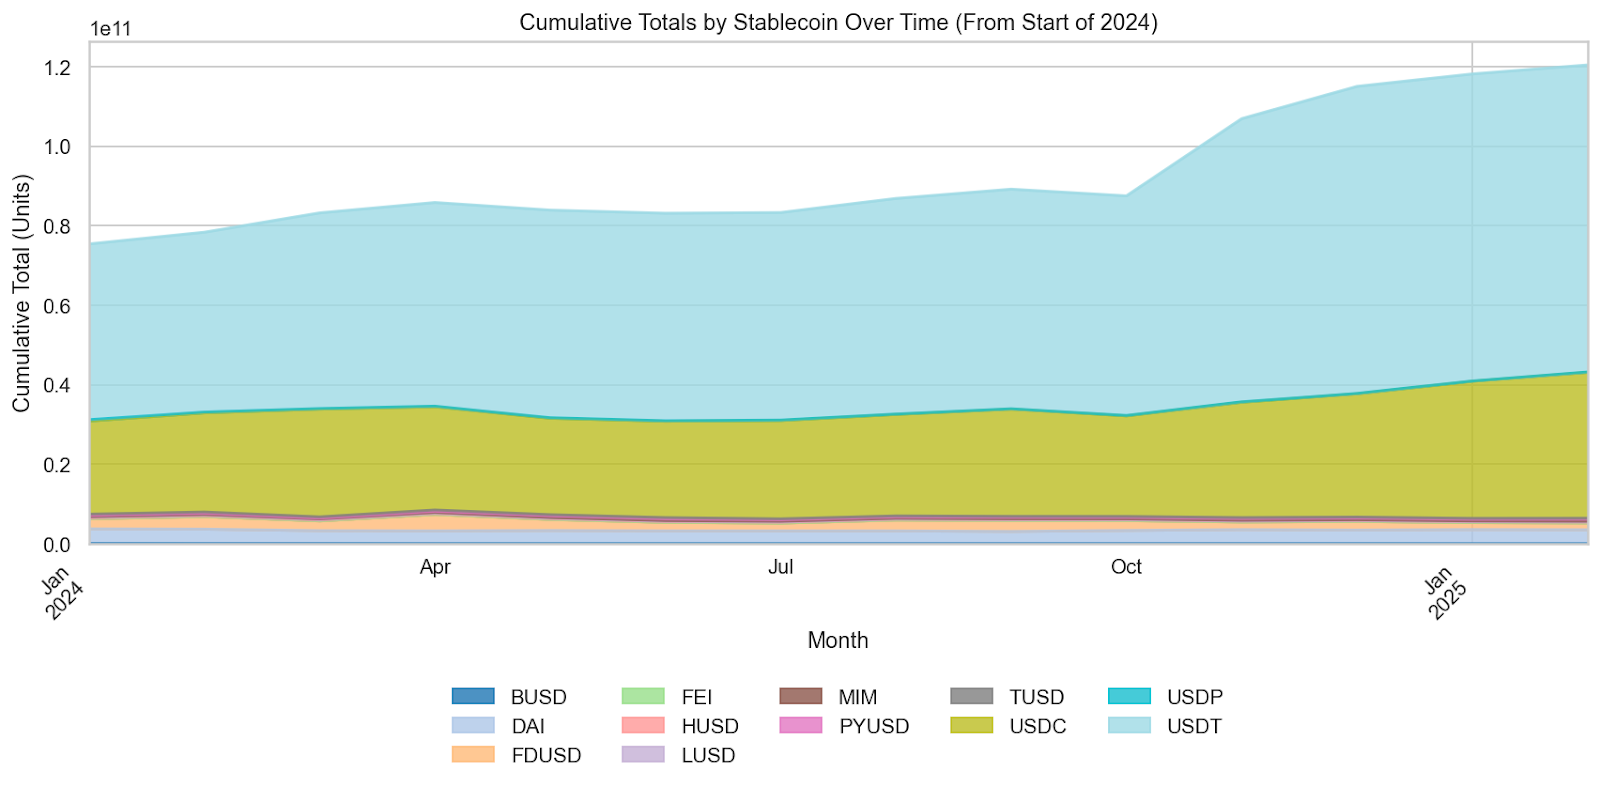
Stablecoin holder totals in USD provide a clear snapshot of investor sentiment by aggregating the dollar value held across the market. Analyzing USDC and USDT between October 2024 and February 2025 shows a marked upward trend. USDC holdings rose from an estimated $25 billion to nearly $37 billion, indicating a steady pace of accumulation. In parallel, USDT’s value surged from around $55 billion in October to close to $77 billion by late 2024, then held steady into early 2025. These dollar figures, far from being abstract, directly represent investor commitment and liquidity in the stablecoin sector.
For traders and market strategists, these movements are pivotal. The gradual climb in USDC totals suggests a growing reliance on it for everyday transactions and liquidity management, fostering a more robust trading infrastructure. In contrast, USDT’s significant jump, followed by a stabilization, implies that market participants are quickly reallocating capital during volatile periods before settling into a risk-adjusted equilibrium. Such trends point to a cautious yet confident market environment, where steady accumulation and strategic positioning in stablecoins create opportunities for informed trading and effective risk management in the broader digital asset ecosystem.
Binance Long Short Ratios
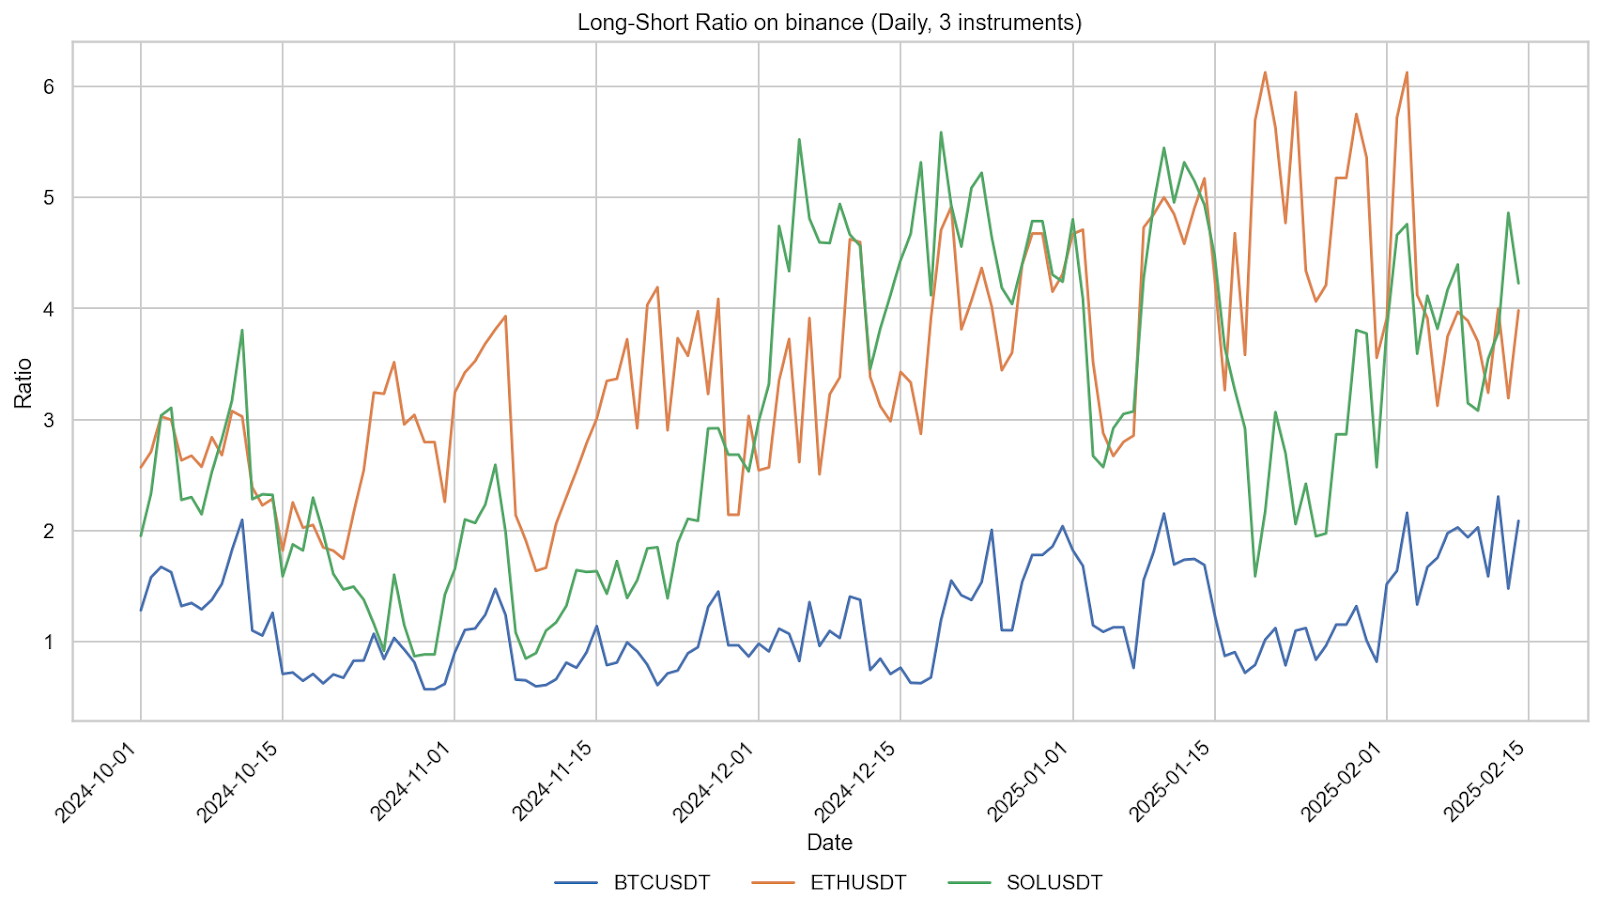
In early January, SOLUSDT’s long/short ratio was quite low—around 1.97 by January 26—showing that traders were not heavily leaning into long positions at that time. These ratios, sourced from Binance, indicate that by February 14 the ratio jumped to about 4.23, more than doubling its previous level and signaling that many more traders were now taking long positions as their confidence in SOL grew.
Similarly, Bitcoin’s (BTCUSDT) long/short ratio rose from a low of roughly 0.82 on January 31 to around 2.09 by February 14. This change suggests that traders were shifting from a cautious stance to a more bullish approach as their trust in Bitcoin’s performance increased amid changing market conditions.
In contrast, Ethereum (ETHUSDT) had reached a very high long/short ratio of about 6.13 around January 20, reflecting a period of intense speculative buying and high leverage. However, by mid-February the ratio had dropped to nearly 3.98, suggesting that traders were beginning to take profits and lower their risk after the earlier phase of strong optimism.
Bybit Long Short Ratios
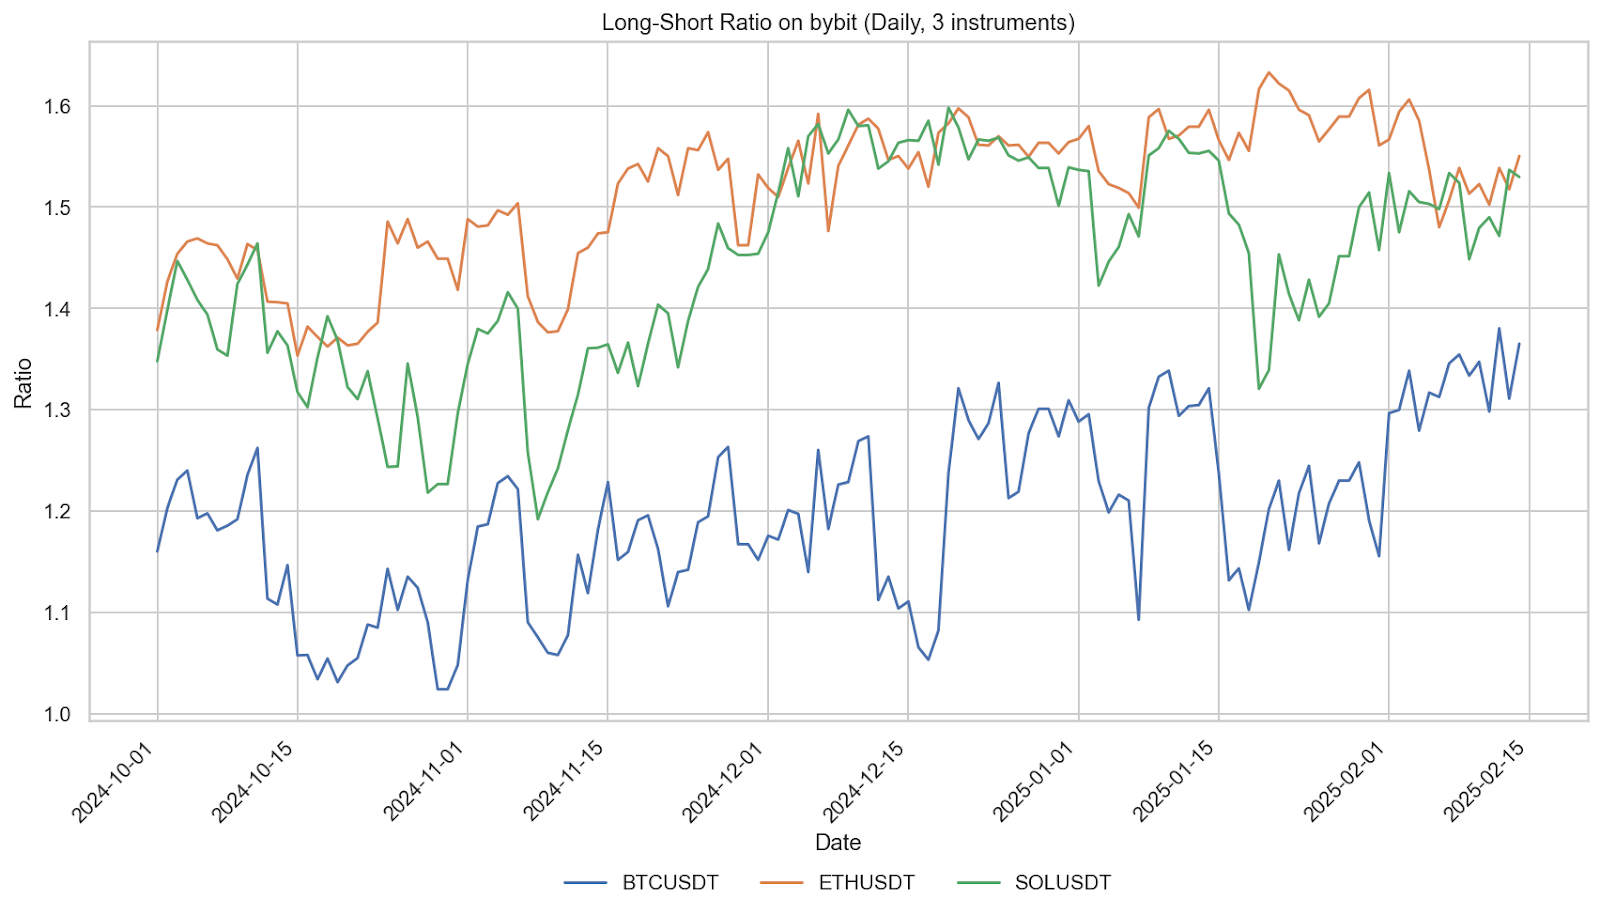
In early January on Bybit, SOLUSDT’s long/short ratio was relatively low—around 1.41 by January 26—showing that traders were not heavily leaning into long positions at that time. By February 14, the ratio had modestly increased to about 1.53, a change that is far less dramatic compared to Binance, where SOLUSDT’s ratio more than doubled from roughly 1.97 to 4.23. This difference suggests that traders on Bybit are adopting a more cautious approach when taking long positions in SOL.
Similarly, Bitcoin’s (BTCUSDT) long/short ratio on Bybit rose from a low of roughly 1.16 on January 31 to around 1.37 by February 14. This gradual increase indicates that traders shifted from a cautious stance to a slightly more bullish outlook, yet the movement is much more subdued than on Binance, where BTCUSDT’s ratio jumped from about 0.82 to 2.09. The more measured change on Bybit may reflect differing trading strategies or leverage options between the platforms.
In contrast, Ethereum’s (ETHUSDT) long/short ratio on Bybit peaked at approximately 1.63 around January 20, reflecting a period of increased speculative buying, but by mid-February it had dropped slightly to roughly 1.55. This suggests that traders began taking profits or reducing their risk after an earlier phase of optimism—again, a much milder shift compared to Binance, where ETHUSDT’s ratio fell from around 6.13 to 3.98. These contrasts highlight the varying risk appetites and trading environments between Bybit and Binance.
Exchange Traded Volume
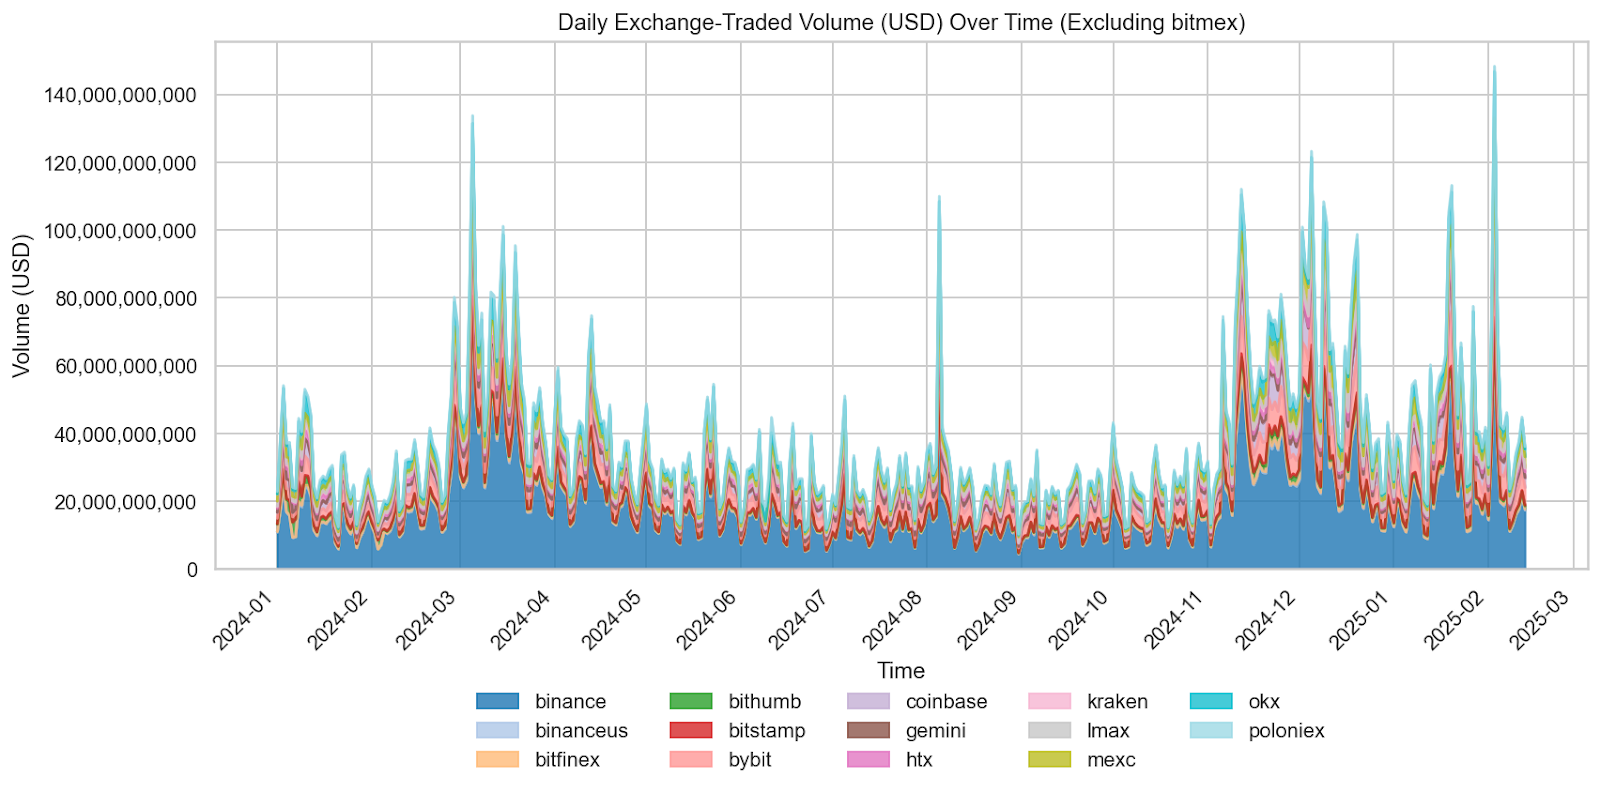
Recent data from February 2025 indicates that trading volumes across major exchanges have pulled back significantly from the high spikes recorded in December. For instance, on February 13, Binance’s volume was around $17.3 billion and Coinbase’s was approximately $2.8 billion—figures that are noticeably lower than the record highs seen in December. Similar trends are evident on other platforms, with Bybit and OKX also reporting reduced volumes compared to the peak activity of the previous month. This decline in volume suggests that market participants are stepping back from the frantic trading environment of December, opting instead for a more cautious approach as market conditions stabilize.
The lower average trading volumes have important implications for market dynamics and trading strategies. With less frenetic activity, price movements may become less volatile, allowing for more measured price discovery and potentially tighter spreads. This pullback could signal that traders are either taking profits or waiting for clearer directional cues before re-engaging in high-volume trading. As liquidity conditions moderate, investors might expect a period of consolidation, offering opportunities for more strategic entries and exits in the market. Overall, the current volume environment reflects a market in transition, shifting from the exuberance of December toward a steadier pace in early 2025.
Links
AmberLens: intelligence.amberdata.com
Recent from Amberdata
- Amberdata:Amberdata 2024 Digital Asset Market Intelligence Report: Exchanges & Derivatives
- Amberdata: Altcoin Volatility Surface Methodology
- Amberdata: AD Derivatives Podcast Featuring Bulat Kaliev, CPO at BABB & ReDeFi
- Amberdata: Bridging TradFi, CeFi, and DeFi: Introducing Crypto ETF and Equity Options
- Amberdata: AmberLens Product Update: USD & EUR Stablecoin Dashboard Enhancements
- Amberdata: AD Derivatives Newsletter: Navigating BTC Volatility Amid U.S. Elections
Spot Market
Spot market charts were built using the following endpoints:
- https://docs.amberdata.io/reference/market-metrics-exchanges-volumes-historical
- https://docs.amberdata.io/reference/market-metrics-exchanges-assets-volumes-historical
- https://docs.amberdata.io/reference/get-market-pairs
- https://docs.amberdata.io/reference/get-historical-ohlc
Futures
Futures/Swaps charts were built using the following endpoints:
- https://docs.amberdata.io/reference/futures-exchanges-pairs
- https://docs.amberdata.io/reference/futures-ohlcv-historical
- https://docs.amberdata.io/reference/futures-funding-rates-historical
- https://docs.amberdata.io/reference/futures-long-short-ratio-historical
- https://docs.amberdata.io/reference/swaps-exchanges-reference
- https://docs.amberdata.io/reference/swaps-ohlcv-historical
- https://docs.amberdata.io/reference/swaps-funding-rates-historical
DeFi DEXs
DeFi DEX charts were built using the following endpoints:
- https://docs.amberdata.io/reference/defi-dex-liquidity
- https://docs.amberdata.io/reference/defi-dex-metrics
- https://docs.amberdata.io/reference/defi-impermanent-loss
DeFi Borrow/Lend
DeFi lending charts were built using the following endpoints:
- https://docs.amberdata.io/reference/defi-lending-protocol-lens
- https://docs.amberdata.io/reference/defi-lending-asset-lens
Networks
Network charts were built using the following endpoints:
- https://docs.amberdata.io/reference/blockchains-metrics-latest
- https://docs.amberdata.io/reference/transactions-metrics-historical
- https://docs.amberdata.io/reference/get-historical-transaction-volume

Disclaimers
The information contained in this report is provided by Amberdata solely for educational and informational purposes. The contents of this report should not be construed as financial, investment, legal, tax, or any other form of professional advice. Amberdata does not provide personalized recommendations; any opinions or suggestions expressed in this report are for general informational purposes only.
Although Amberdata has made every effort to ensure the accuracy and completeness of the information provided, it cannot be held responsible for any errors, omissions, inaccuracies, or outdated information. Market conditions, regulations, and laws are subject to change, and readers should perform their own research and consult with a qualified professional before making any financial decisions or taking any actions based on the information provided in this report.
Past performance is not indicative of future results, and any investments discussed or mentioned in this report may not be suitable for all individuals or circumstances. Investing involves risks, and the value of investments can go up or down. Amberdata disclaims any liability for any loss or damage that may arise from the use of, or reliance on, the information contained in this report.
By accessing and using the information provided in this report, you agree to indemnify and hold harmless Amberdata, its affiliates, and their respective officers, directors, employees, and agents from and against any and all claims, losses, liabilities, damages, or expenses (including reasonable attorney’s fees) arising from your use of or reliance on the information contained herein.
Copyright © 2025 Amberdata. All rights reserved.