Share this blog:
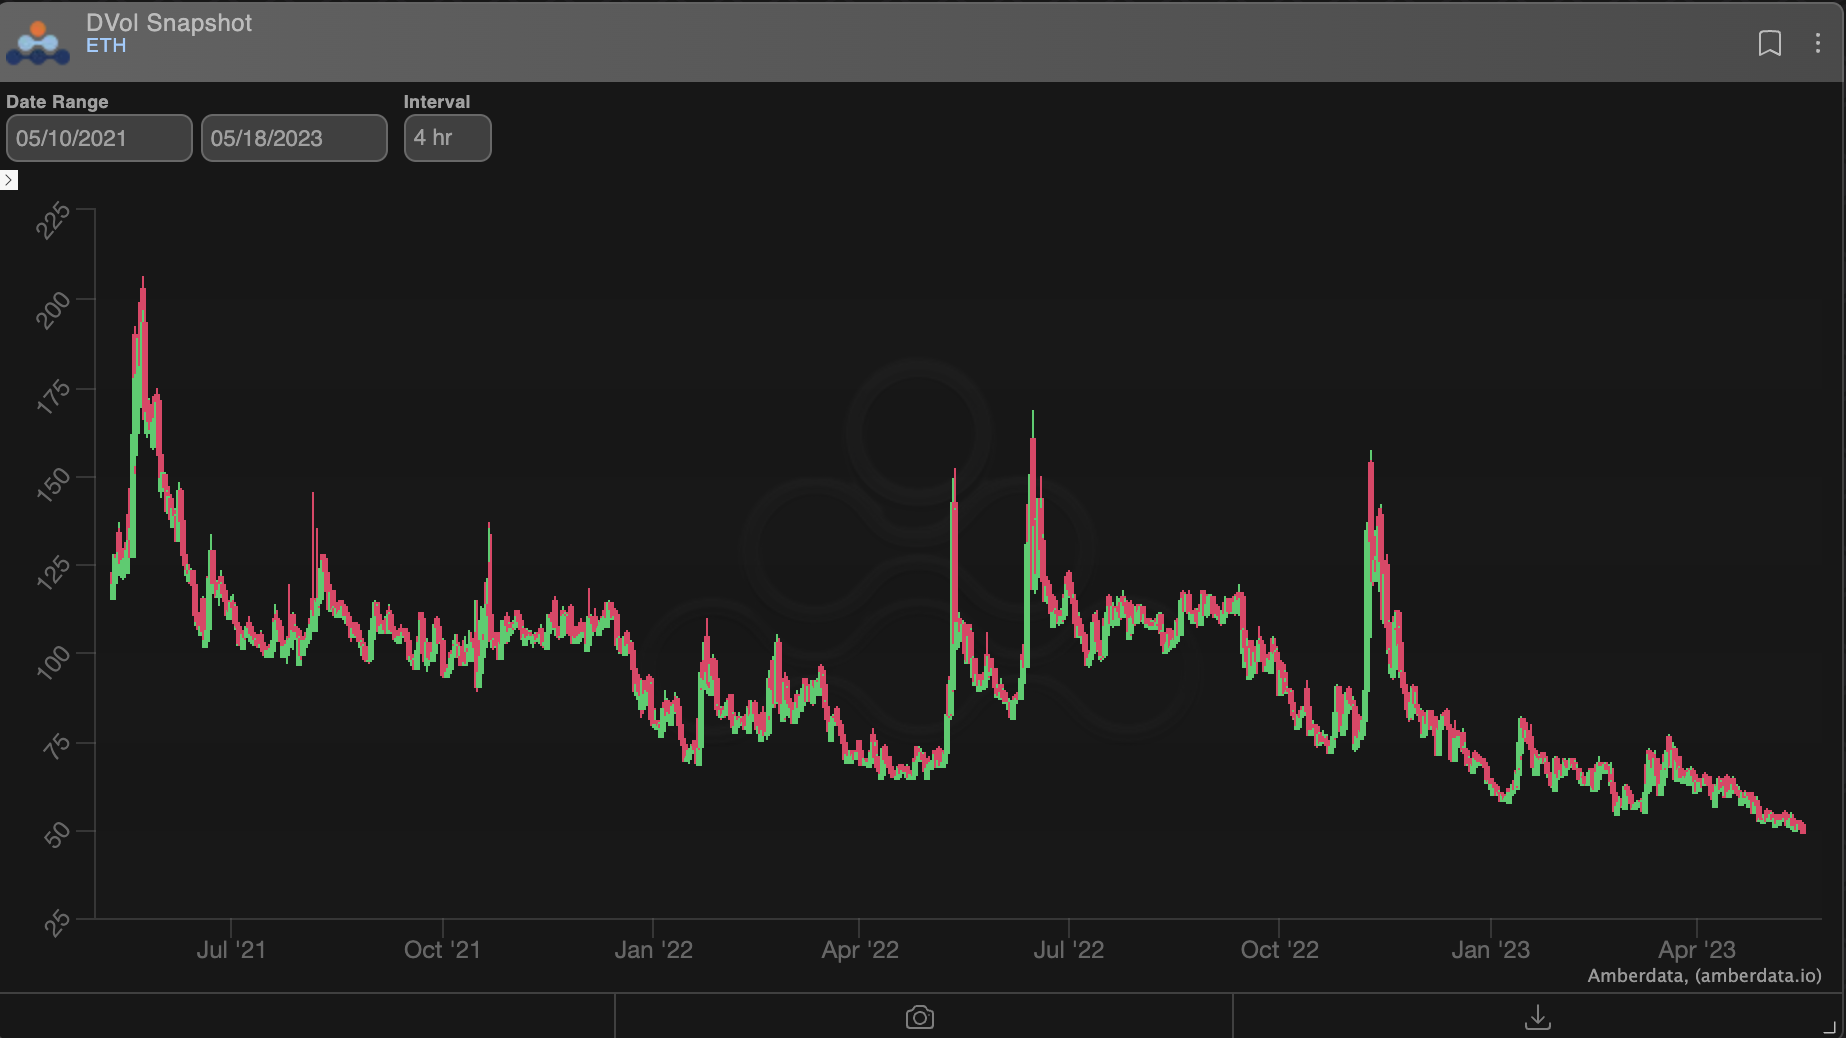
Igniting a spark in the implied volatility realm, theBTC and ETH options markets have embarked on an intriguing journey of structural descent.With a careful eye on the DVol indexes since their remarkable Q2 2021 inception, we witness a gradual grind downward, occasionally punctuated by captivating "volatility events" like TerraLuna, 3AC, and FTX.
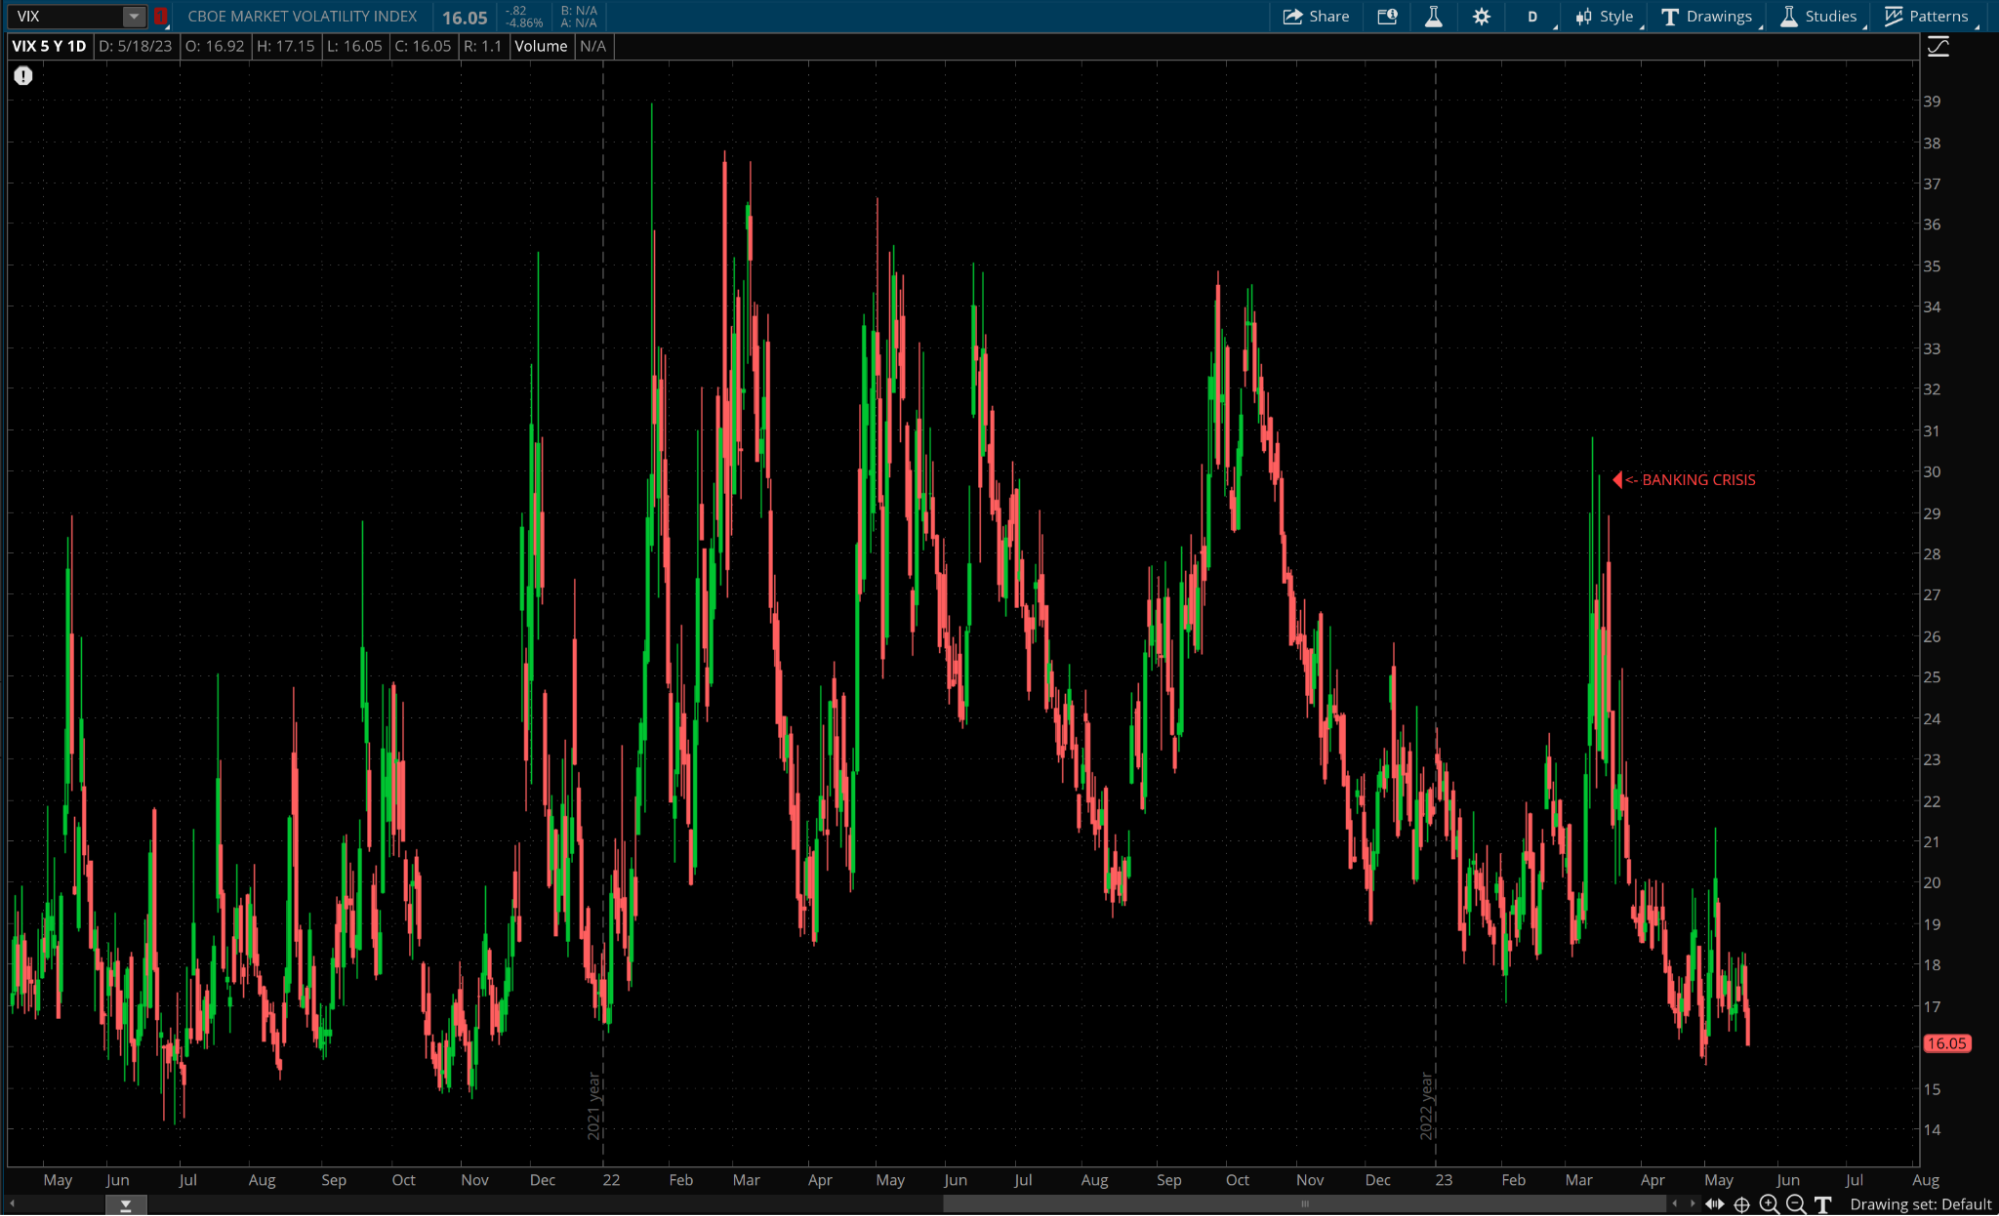
Interestingly, a striking contrast emerges when we juxtapose this trajectory with the (SPX) VIX, as the crypto volatility grind takes a remarkably different shape.
Let’s go a little deeper into this mesmerizing crypto volatility landscape!
In this dynamic crypto market, an increasing number of participants, armed with serious capital, are eager to seize the opportunity and exploit what seems to be an enduringly generous "Variance Risk Premium." For those of you unfamiliar, The Variance Risk Premium (VRP) is a concept that describes the difference between the implied volatility of options and the subsequent realized volatility of the underlying asset. In simpler terms, it represents the premium that crypto investors are willing to pay for expected future volatility compared to the actual volatility that occurs.
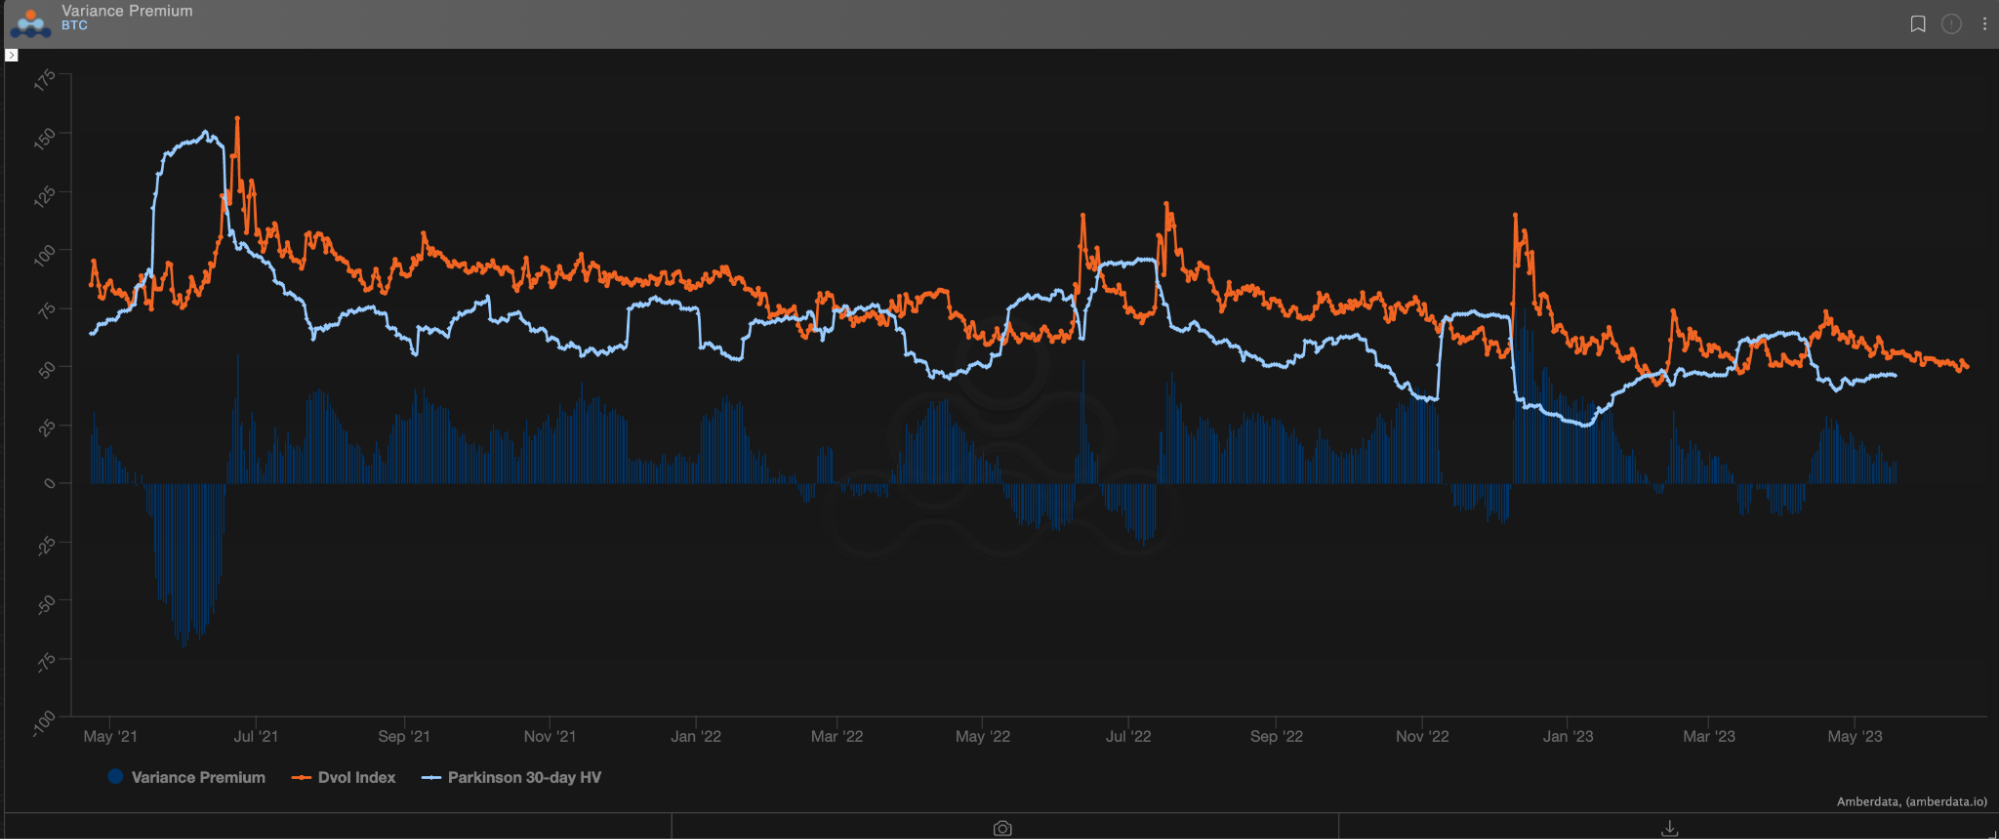 *This chart compares 30-day realized volatility versus DVol shifted back 30-days to measure how efficiently IV priced future RV
Often we witness a VRP of nearly 25 volatility points. Not only is that a massive VRP, but at the times that options are indeed underpriced due to a surprise volatility event, the negative VRP is usually very shallow.
We say all this to acknowledge that short-vol is typically a good “base-case” for volatility trading in crypto, at least historically speaking.
That said, we do see enticing long-vol opportunities today on the ETH surface.
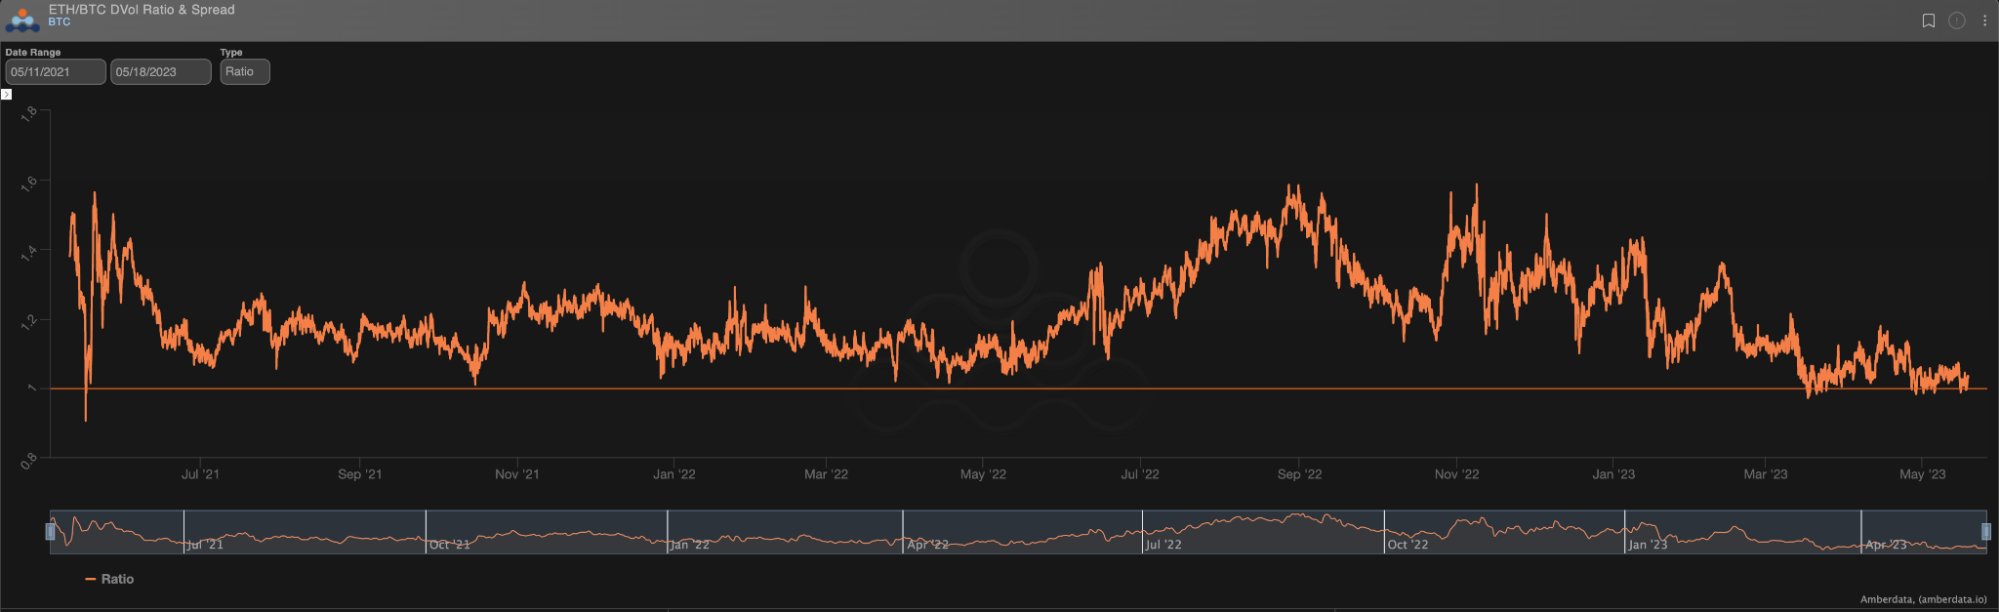
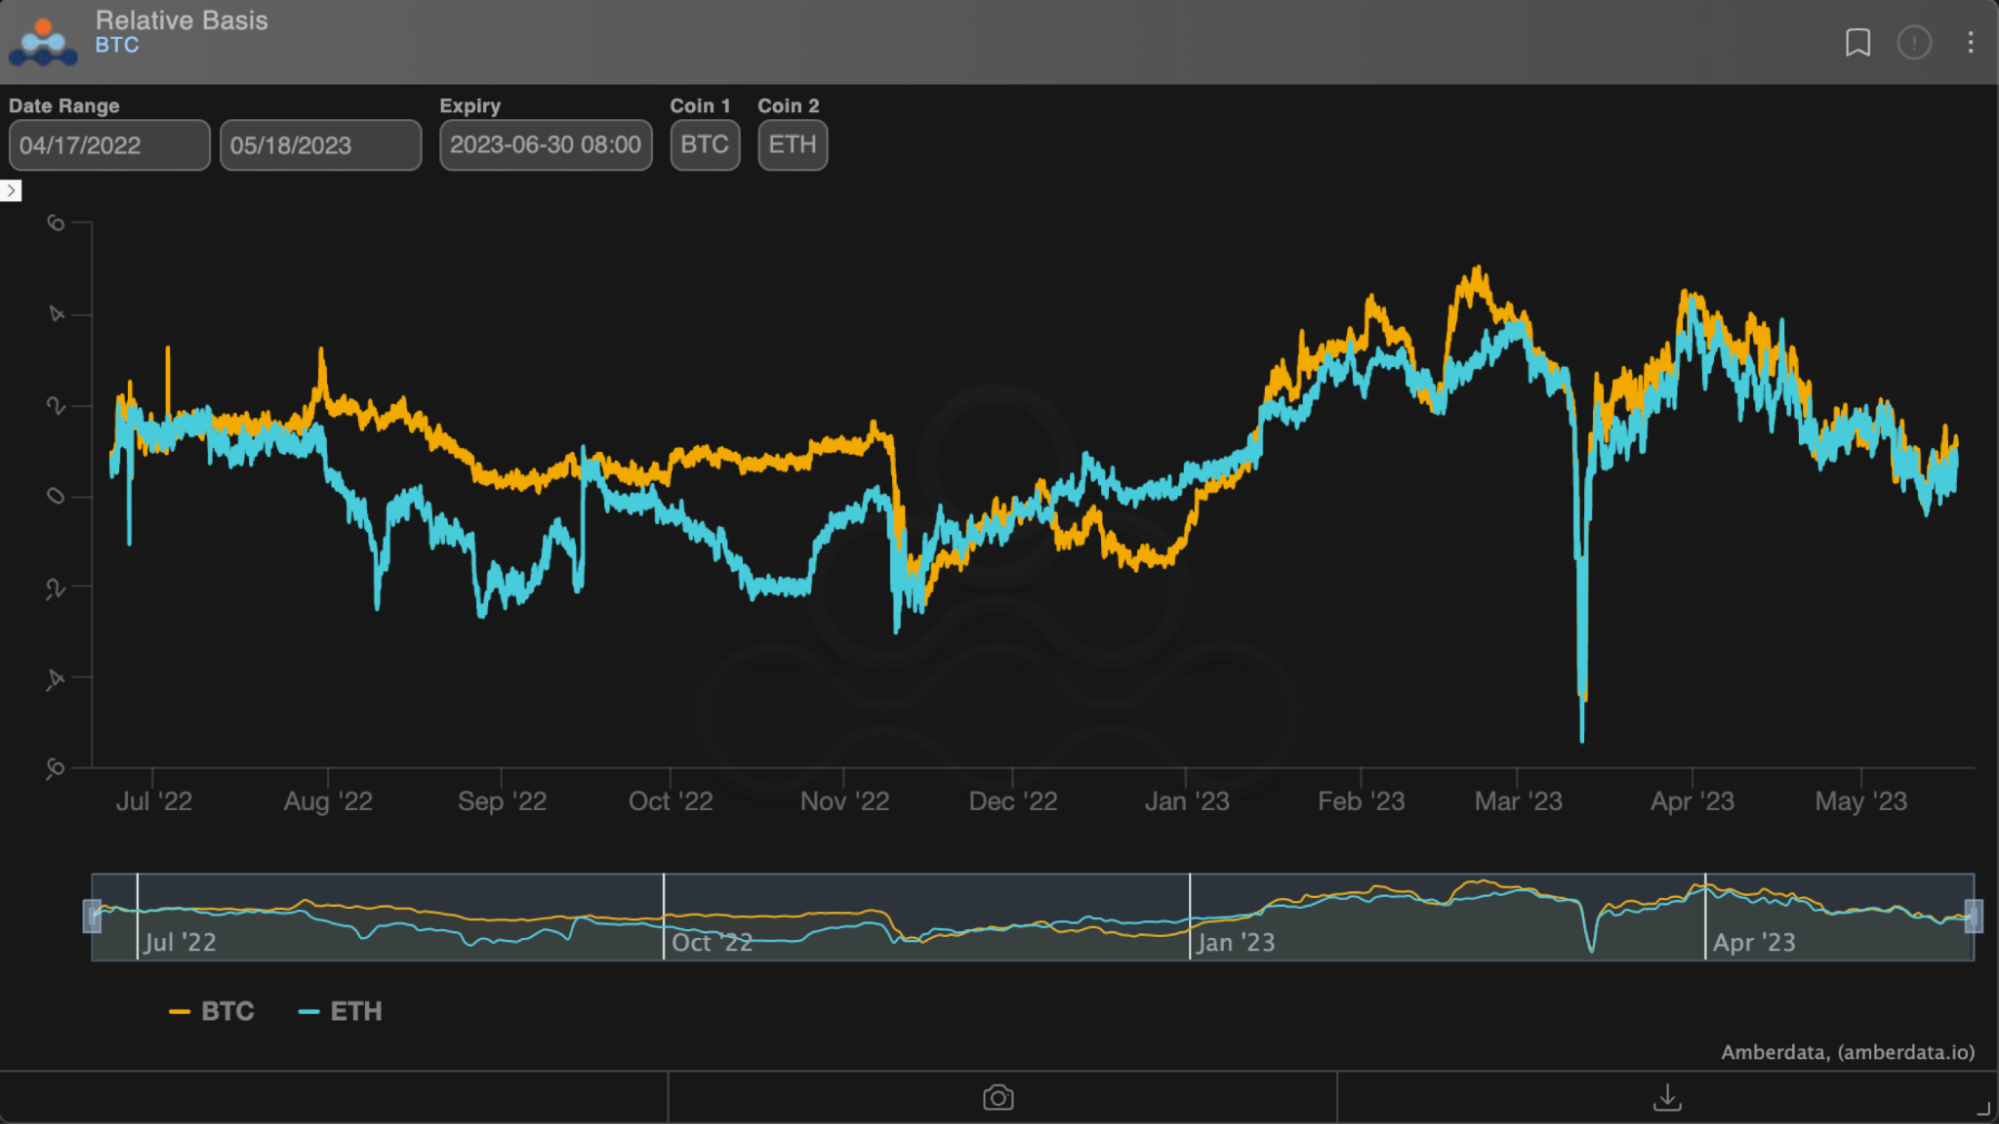
First, looking at the relative volatility between BTC and ETH, we can see that the ETH DVol is at historic lows compared to BTC DVol.
Looking at the realized space, we can also see a similar story.
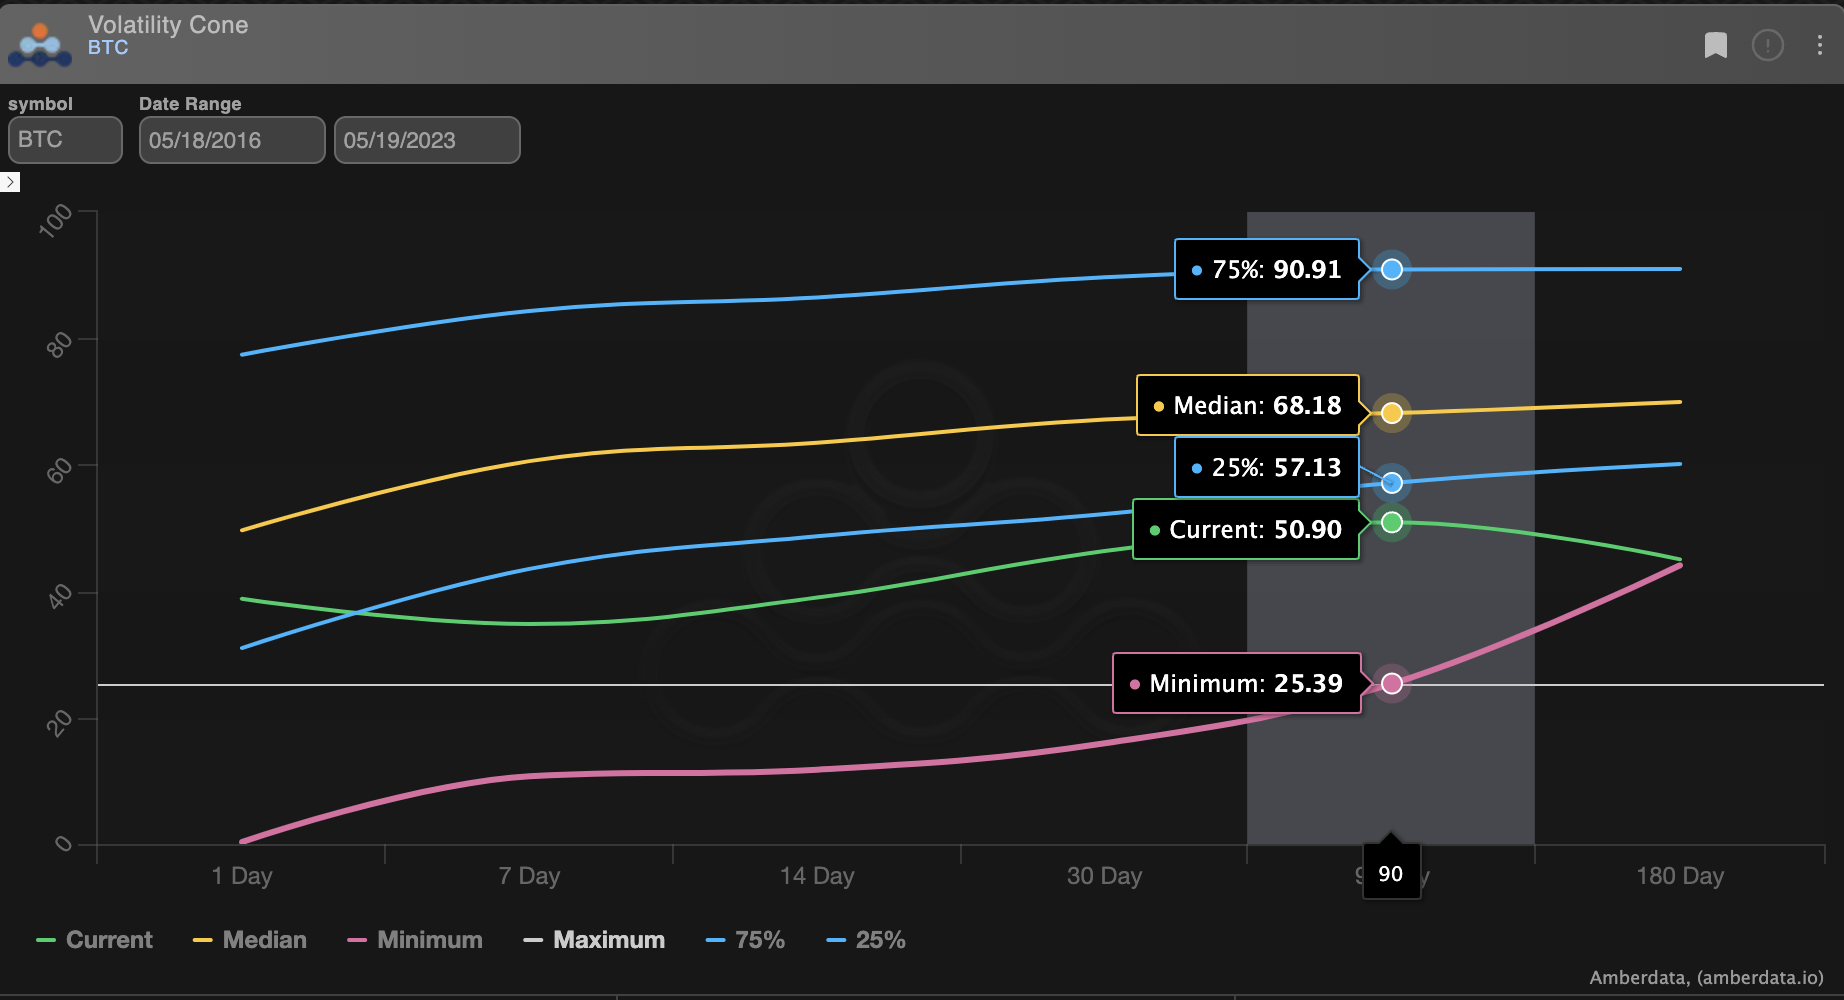
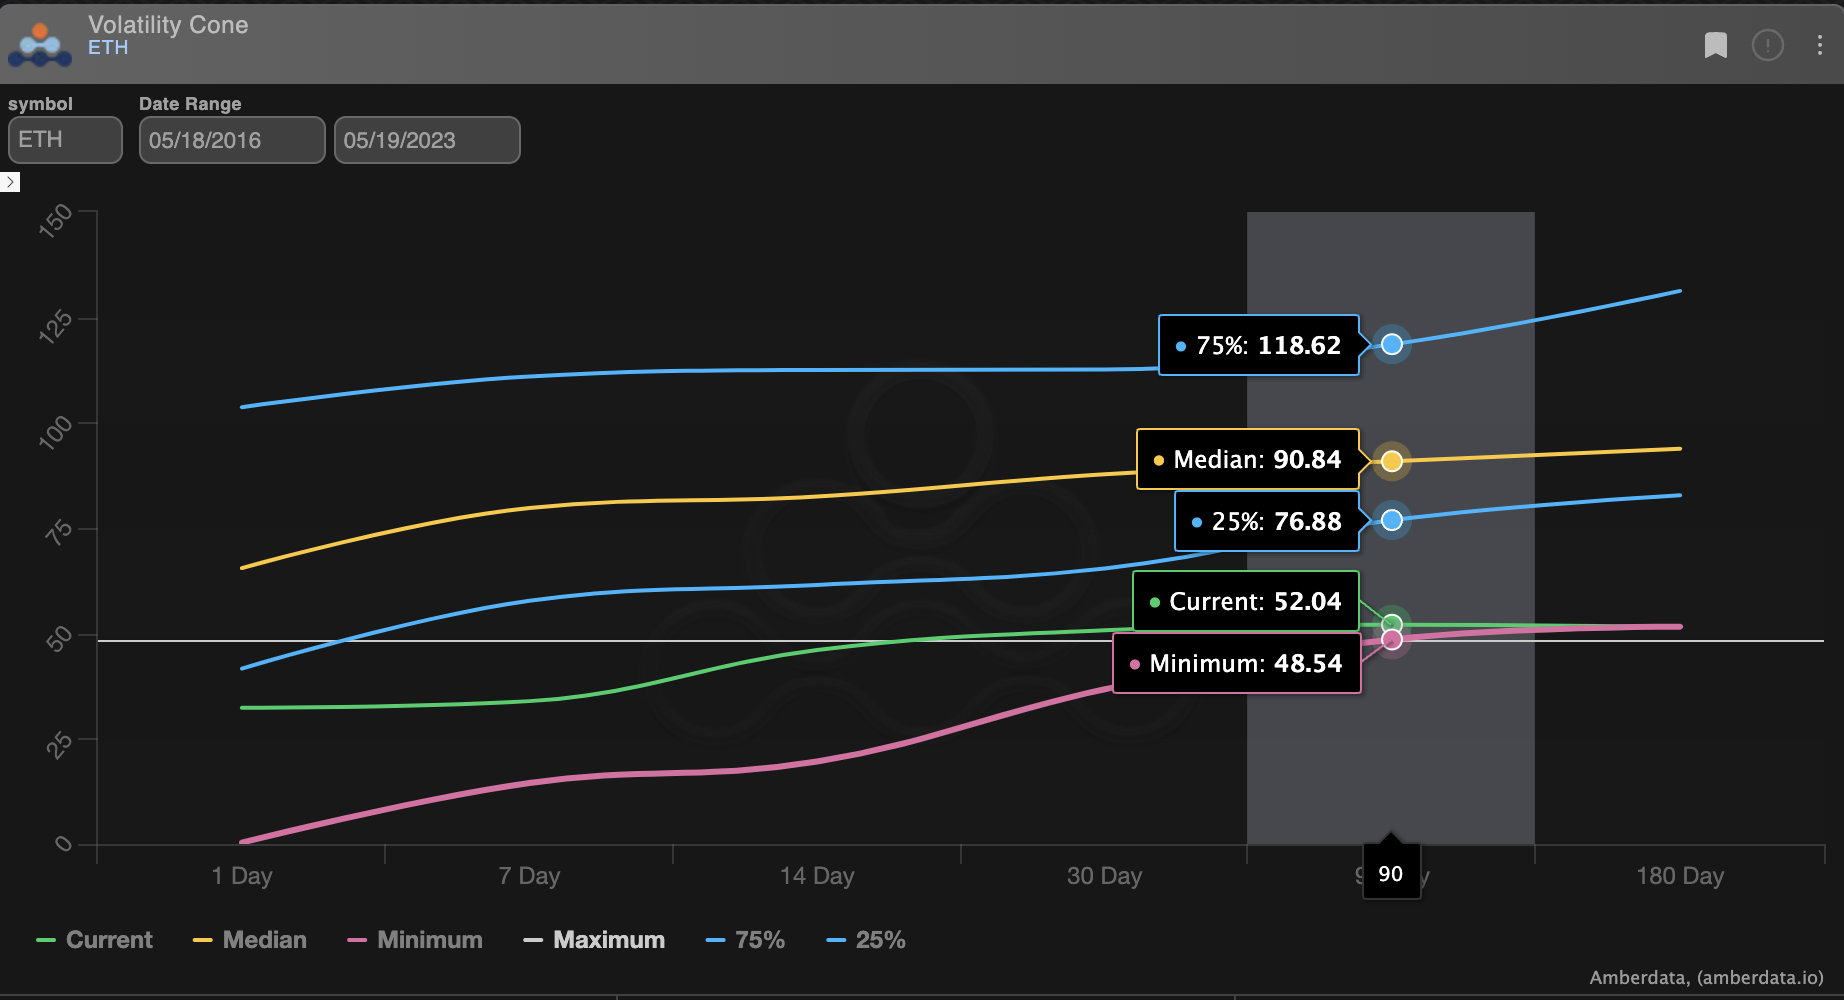
Looking at RV over the past seven years, both BTC and ETH are trading below the 25% percentile, but ETH is actually trading at 7-year minimums for longer-dated RV.
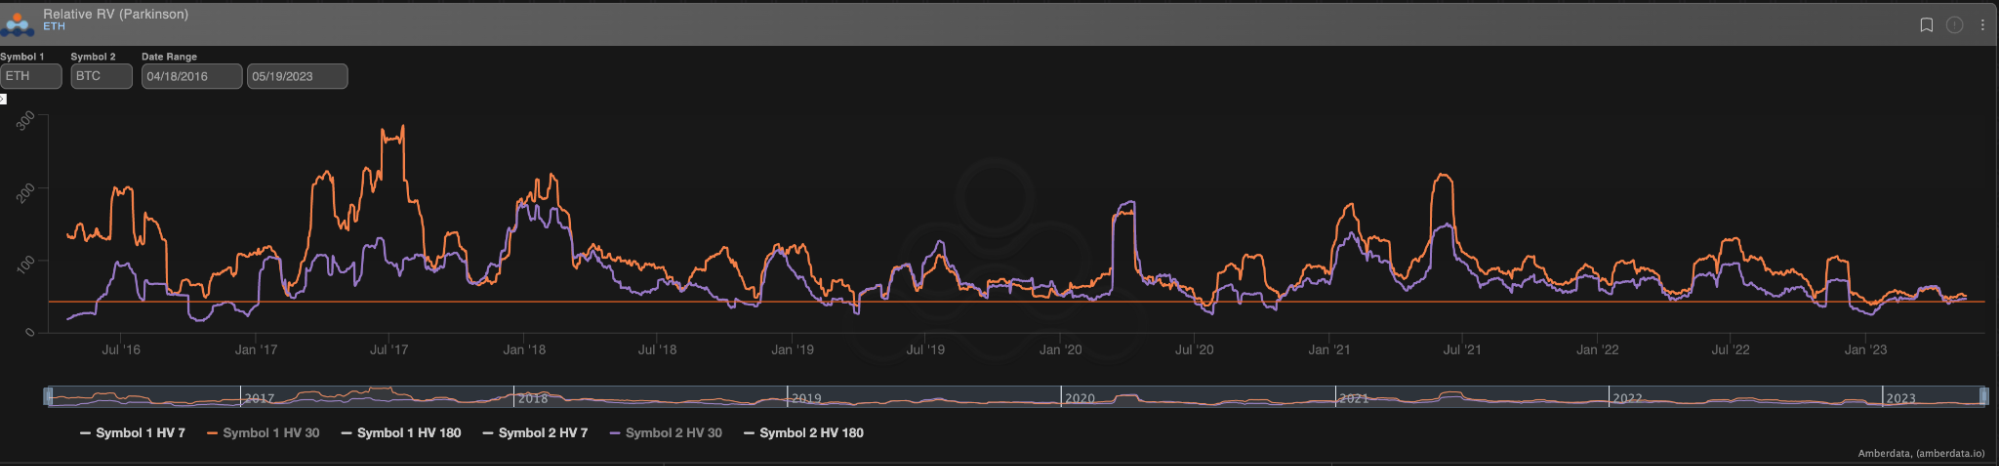
And, considering the relative volatility between ETH and BTC we can see that the realized relationship is historically much higher for ETH (orange) relative to BTC (purple).
We next need to ponder the reasoning for this low ETH IV when considering the current market conditions.
Indeed, the current low realized volatility (RV) is just one aspect of the situation. However, another factor has sparked significant excitement in the market. It revolves around the anticipated "Proof-of-Stake" (PoS) merge scheduled for September 2022.
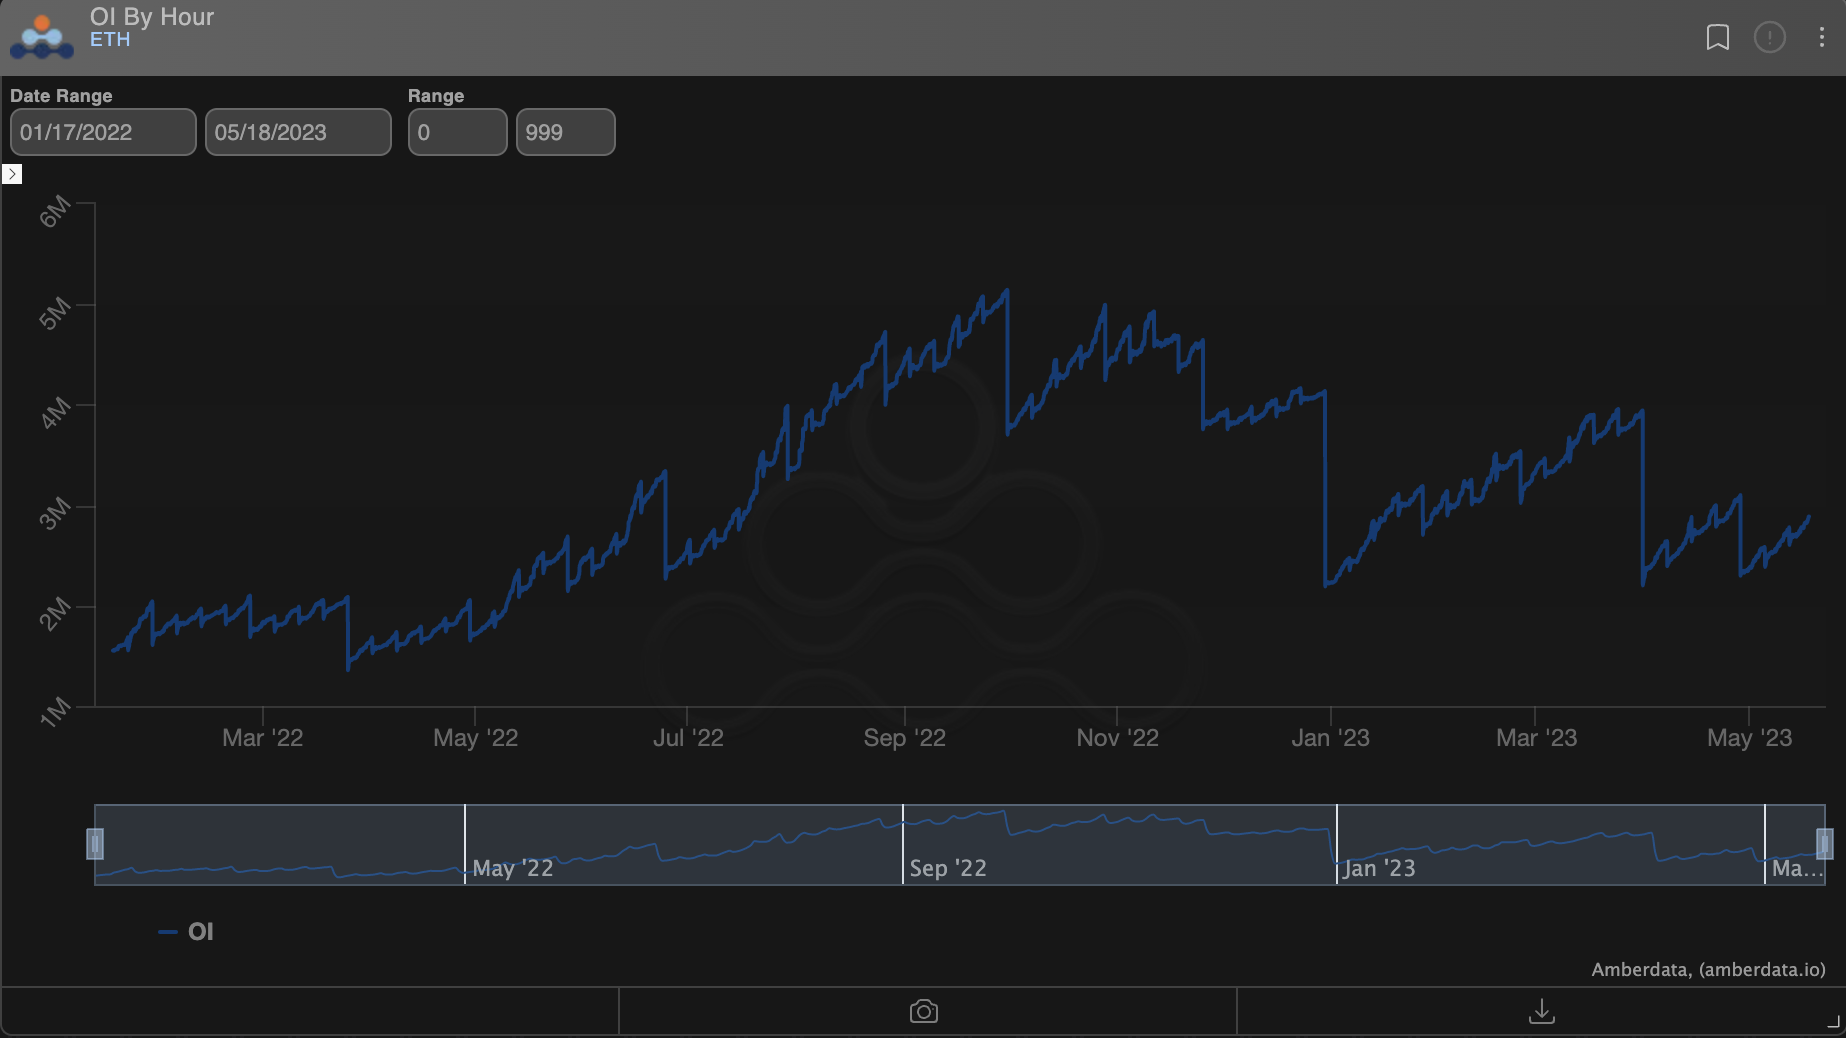
The institutional appetite for ETH has dominated the market narrative as it transitions into a yield-generating asset similar to dividend-paying stocks. The growing enthusiasm surrounding the PoS merge even peaked ETH option open interest on Deribit, particularly for the September 2022 quarterly expiration.
Assuming the narrative that institutional appetite for yield holds, traditional volatility flows strategies would likely follow.
A common theme found in TradFi option flows is covered call selling by institutions.
So the question becomes, are big players running the old playbook by buying ETH, staking it, and selling covered calls against their holdings?
If we look at block trades, it seems this flow type is occurring.
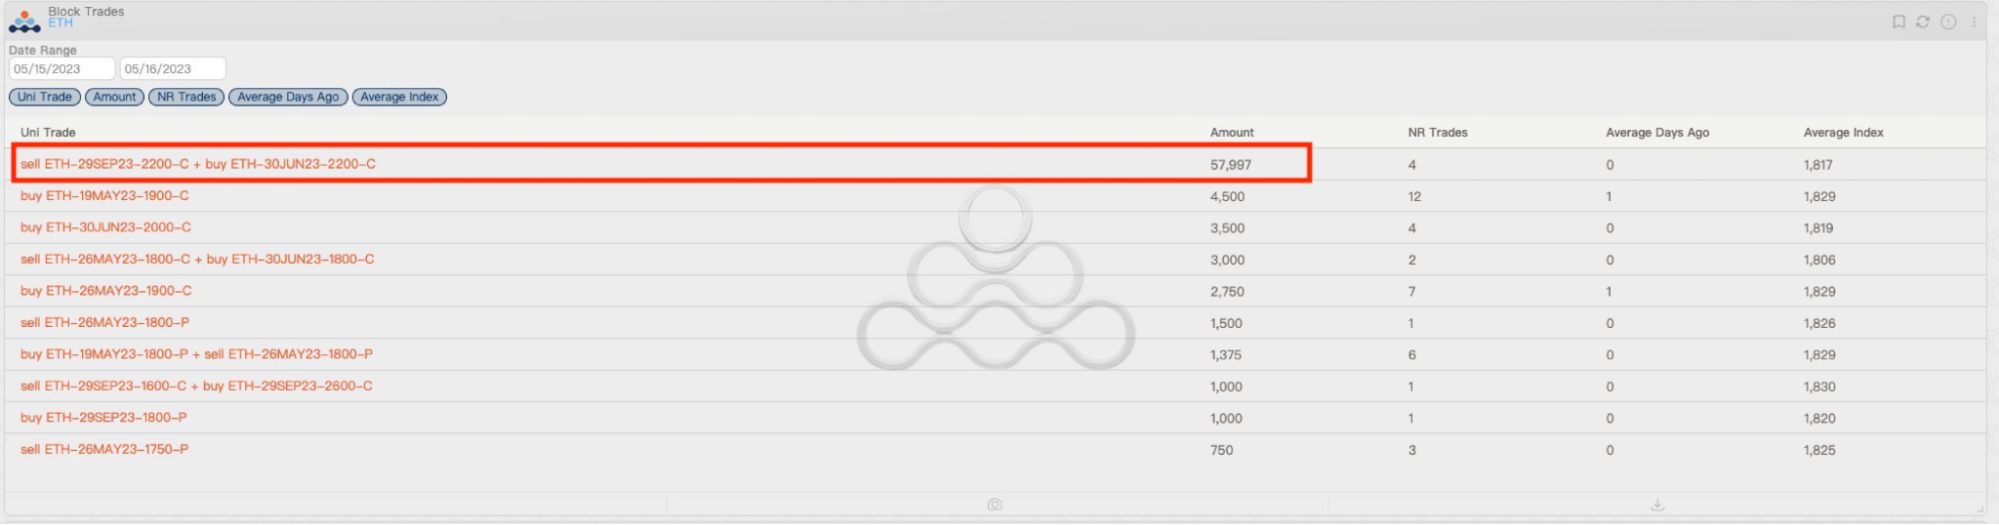
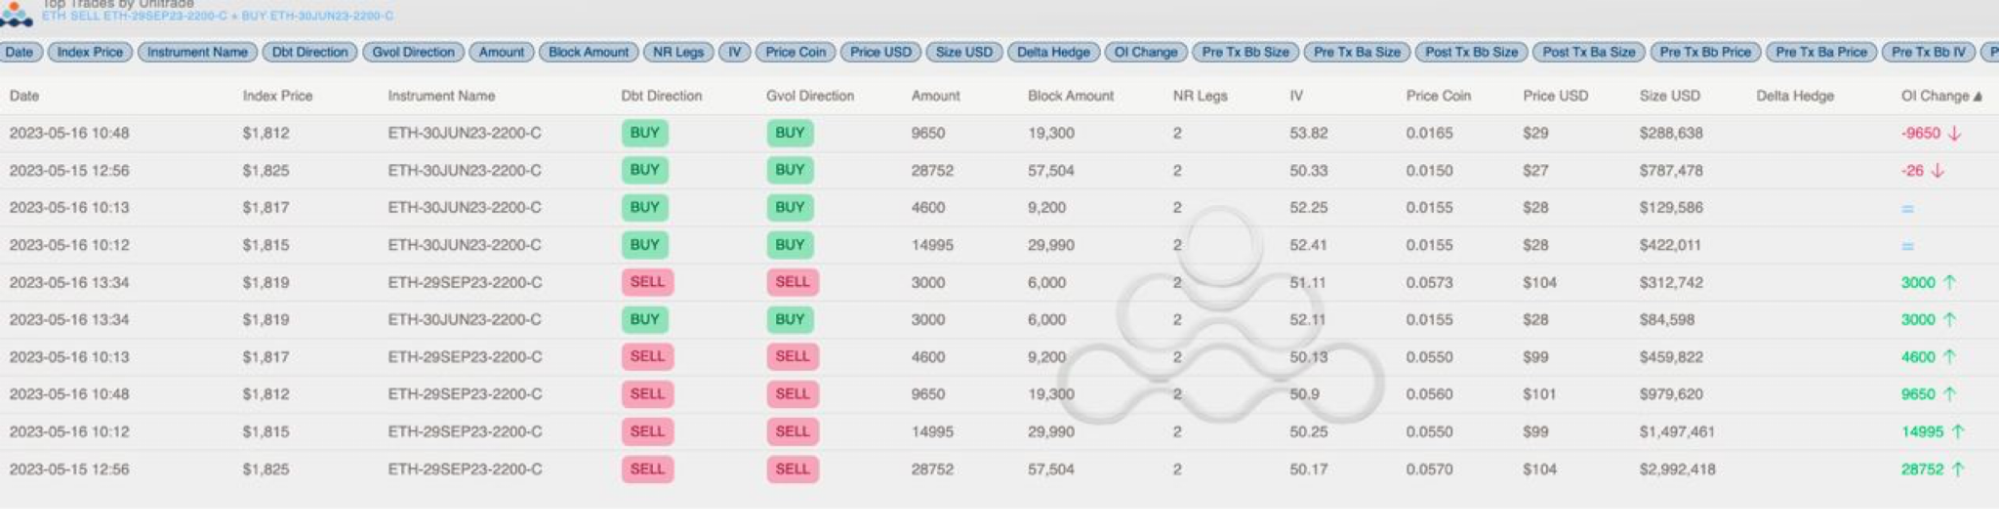
If we examine the impact on open interest, we can see June 2022 short quarterly contracts were repurchased and new September 2200 short calls were established.
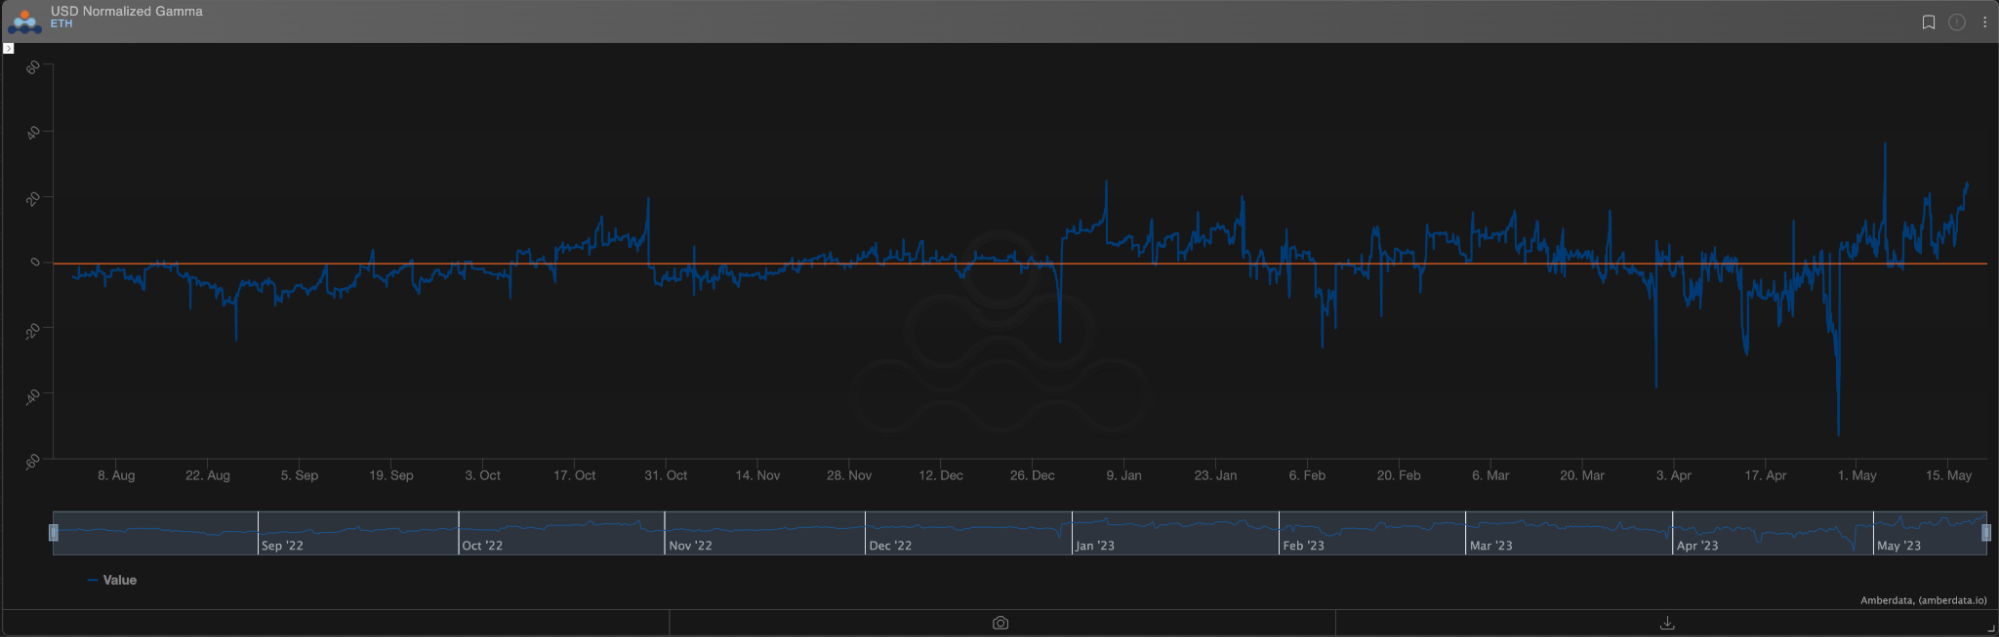
This type of flow has been persistent enough to saddle market-makers with a lot of long inventory. The net gamma profile chart shows persistently high inventory despite the low-vol environment.
So what? Isn’t the market efficient? Isn’t everything priced the way it should be?
We don’t think so, the markets are often cyclical, and by my estimation, there are some elements that are being overlooked, such as the current basis and forward prices.
In traditional currencies, yielding assets typically have discounted forward curves in order to “synthetically” reflect the yield.
The cost of capital can still create a Contango forward curve despite the assets having a yield, but what’s currently happening between BTC and ETH is neither of these cases.
BTC is a non-yielding digital asset, while ETH is a yielding digital asset, and both are trading in lock-step.
We can witness efficient market pricing of the ETH yield back in September 2022 as the market was acutely focused on the impact of a PoS merge, then FTX blew up, and the forwards stopped pricing in that phenomenon.
An overpriced forward means calls are overpriced, making the covered call selling even more attractive. Conversely, an overpriced forward also means that ETH puts are underpriced. Combining this with historically low volatility measurements makes ETH look incredibly cheap.

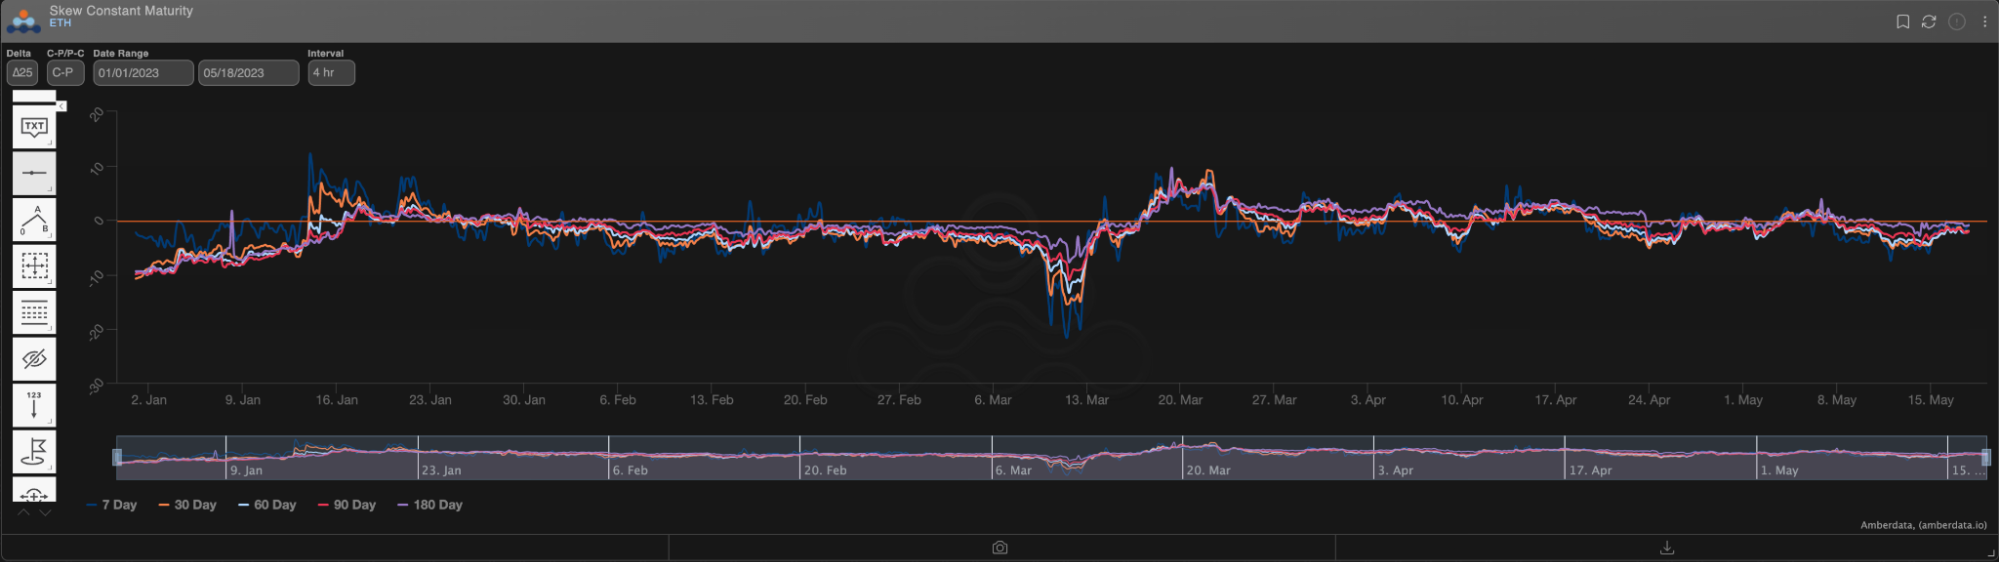
Something of note, if we compare the ∆25 RR-Skew between BTC and ETH, we see ETH does look to be pricing in a bit of negative bias in the RR-Skew, but I’d argue this is currently being priced because of “call supply” as opposed to “put demand.”
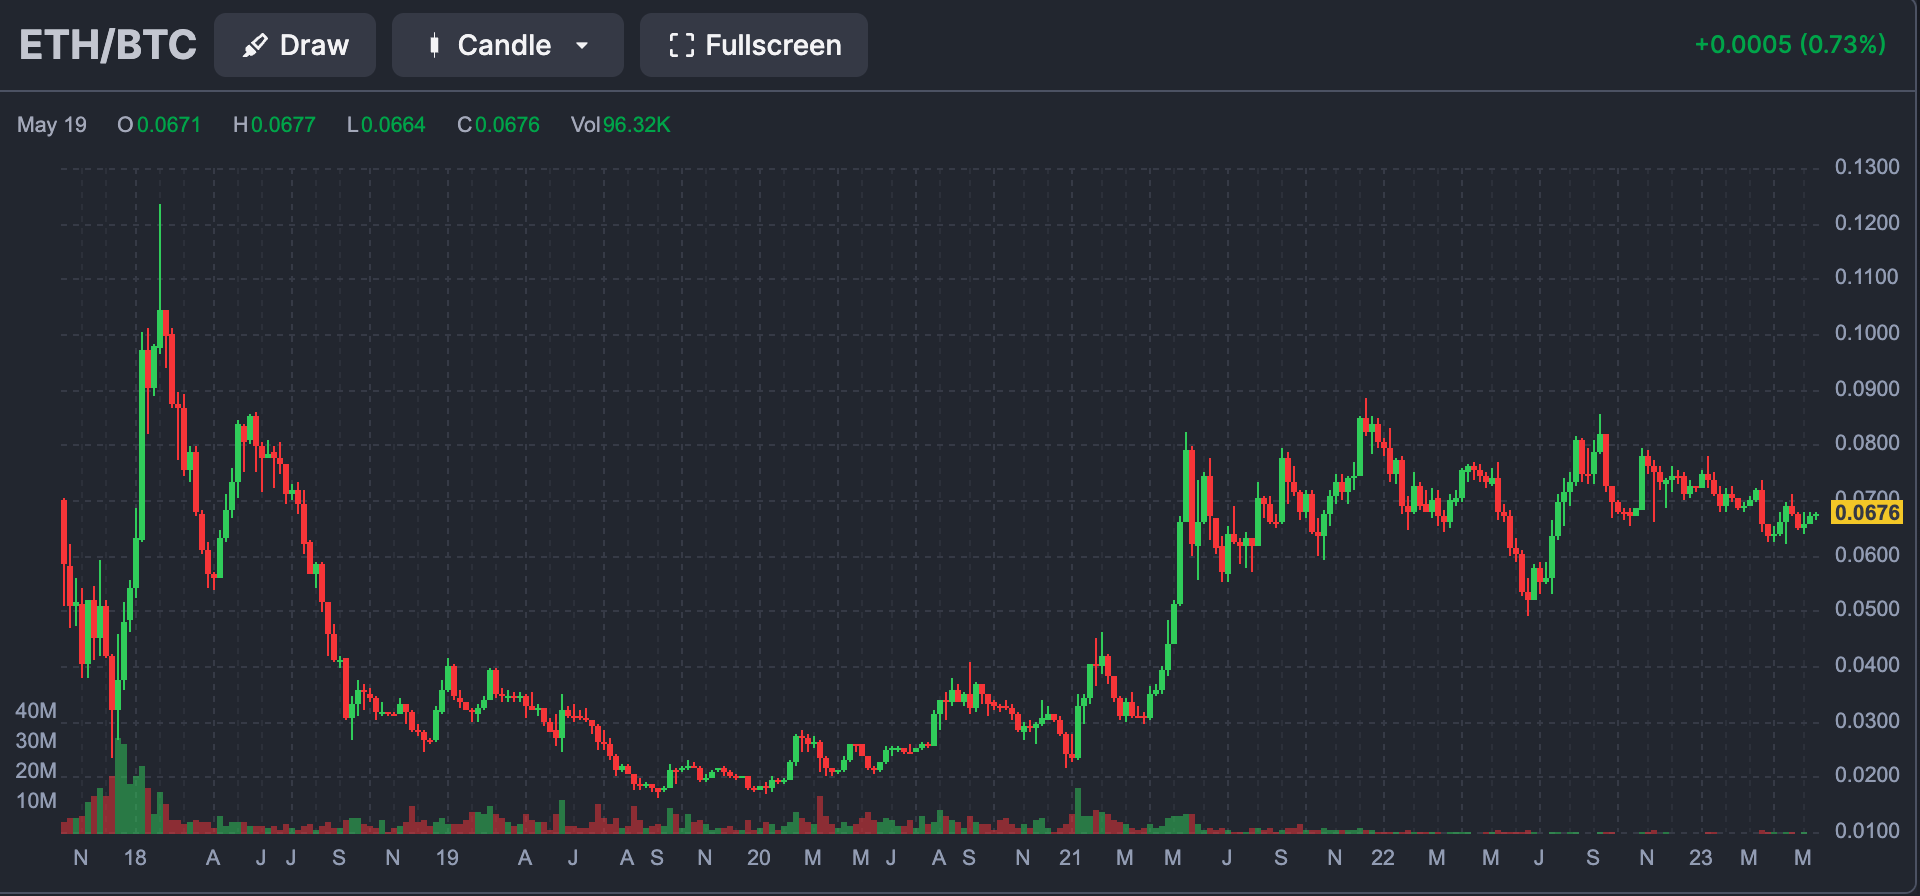
And finally, another attractive property of ETH volatility is the “Altcoin” property of spot ETH. When markets crash, ETH/BTC drops; when markets rally, ETH/BTC rallies. This translates to extra BTC-beta exposure, essentially providing more RV compared to BTC.
This fundamentally makes sense as ETH has a lower total market cap, which means it takes less money to move spot prices around, combined with a restricted tradeable ETH float, as nearly 16% of the total ETH supply is currently being staked.
Owning medium-term to long-term ETH puts, against a staked ETH spot position (enough ETH puts to create a synthetic straddle with net 0-delta as inception) is the most attractive opportunity here.
The combination of overpriced ETH forwards, historically cheap relative volatility, cheaper outright volatility, and additional “altcoin” beta make this trade appealing.
To download the report, click here.
