Share this blog:

The nascent crypto asset class is only 15-years old and has presented investors with unique challenges and opportunities with respect to valuation.
Deribit traded its first BTC options in November 2016, making the crypto space even richer with opportunities by layering-in tradable volatility.
We explore big questions that remain in crypto volatility by dissecting the volatility surface and its associated regimes.
Although the crypto volatility space being new brings a unique set of challenges, it also enables astute investors to become skilled and competitive in the space. No one has a substantial head-start, so to speak.
We are committed to being pioneers in crypto volatility analytics and to helping our customers find moneymaking opportunities. As such, Amberdata Derivatives will make all the following analysis available to our customers.
Thank you for your continued trust and confidence in Amberdata.
Introduction

When Deribit first launched its exchange there wasn’t an ERC-20 standard built on Ethereum yet, nor was there a reliable stablecoin market.
This led to the creation of an “inverse” options and futures exchange, meaning that BTC options and futures are collateralized by BTC itself and cash-settlement also occurs in BTC (AKA “coin”).
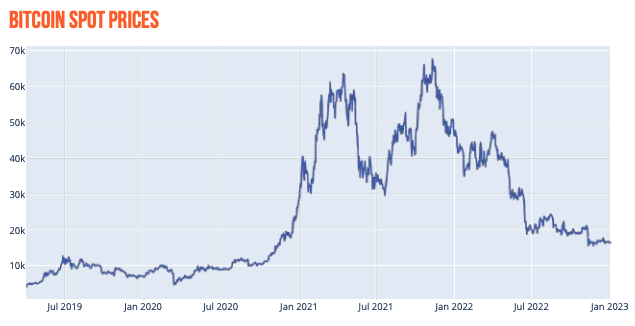
From 2019 through 2022, we’ve seen a lot of different regimes and investment cycles around BTC and the associated options trading on Deribit.
2019: This was the tail-end of the 2018 bear market. The spot market was mostly quiet and a lot of enthusiasm for BTC investing had faded away. BTC hit its bear market low in December 2018, then prices consolidated for most of the first half of 2019. Only later in the year did BTC spot prices rally to $10k, a major level of spot traders.
2020: In 2020 we had two significant events. First March 2020 had the Covid meltdown. This was a scary sell-off in spot prices that caused a drop of 50%, accompanied by volatility which exploded higher. Prices then consolidated back around the $10k level for much of the year. Volatility hit extreme lows in the summer of 2020 only to end the year with a massive bull-market breakout.
2021: That year started with a bullish-breakout. In January of 2021, we saw extreme positioning in the options market as BTC quickly slid through new alltime highs day after day. Extreme positioning then leaked into the futures basis during April 2021, only to completely collapse in May 2021 after a nasty market correction.
2022: That year can be categorized into a bear market year as spot prices retraced from their November 2021 peak. The fundamental picture in crypto became bleak and quickly escalated as LUNA imploded, 3AC ran into trouble and darling exchange FTX turned out to be fraudulent, broke and actively traded against its own clients (Think 3AC’s book).
All taken together, we have a subject dataset with a multitude of spot cycles and associated volatility regimes.
Our analysis starts on April 1st 2019 and concludes on December 31st, 2022.
ATM Term Structure
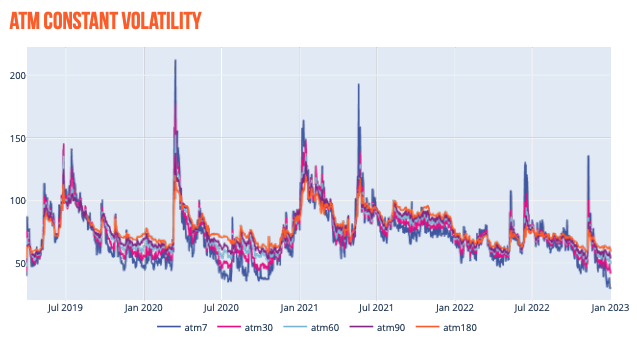
The term structure is one of the most significant measurements of the volatility surface. The term structure is essentially the “spine” of the volatility surface and has significant importance because it deals with ATM (at-the-money) options, which have the most extrinsic value and “optionality”, so to speak.
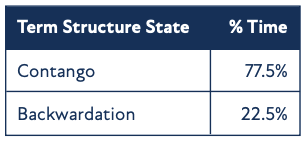
Using our subject data set, we can see that the term structure is in Contango almost 77.5% of the time and rarely in Backwardation.
Backwardation occurs in reaction to volatility “shocks” such as March 2020.
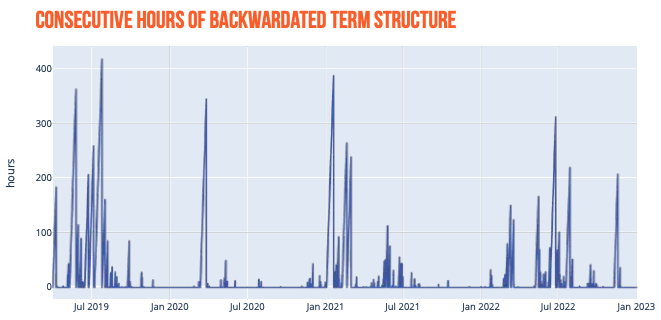
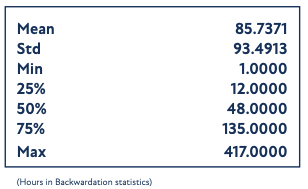
Since Backwardation is the abnormal state of affairs, we have calculated the time spent in Backwardation. Volatility traders can use the “time-to-live” (TTL) measurements to estimate when vol bets should revert into Contango.
The mean TTL of Backwardation in the Amberdata dataset is around 85 hours.
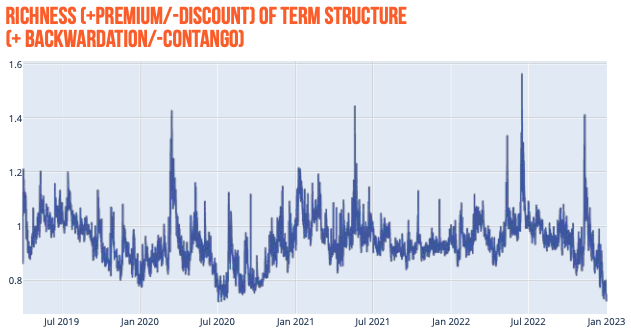
Another important measurement of the term structure is the relative “level” of the Contango or Backwardation shape.
A reading of 1.00 would be a perfectly flat term structure - as measured by our method - while readings below/above represent Contango/Backwardation respectively.
Using the term structure levels enables us to quantify how extended the term structure pricing currently is, at any point in time.
Notice that March 2020, May 2021, June 2022 and November 2022, all represent “vol shocks” that blindsided the market but peaked around the 1.45 level.
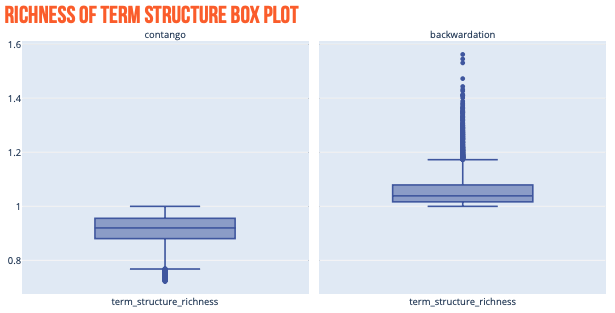
We can further investigate the term structure “levels” by separating the readings between two subsets (Contango/Backwardation) and then applying percentile distribution analysis.
We can see that the mean Contango reading is about 0.93, while the mean Backwardation reading is about 1.03.
Spot/Vol. Dynamics
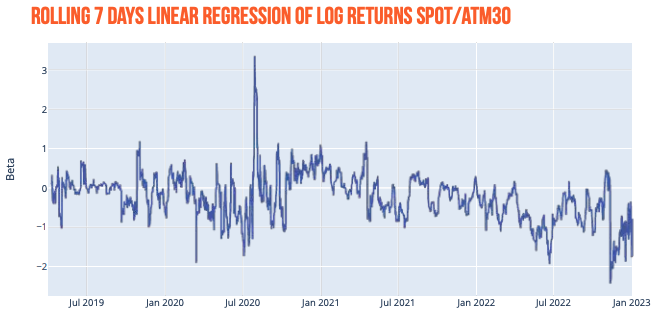
Taking the previous analysis one step further, we can now investigate how spot markets affect ATM volatility. We compare spot and 30-day ATM volatility (customers can easily pass different parameters for analysis) both on a 7-day rolling window above and as a scatter plot using hourly data, below.
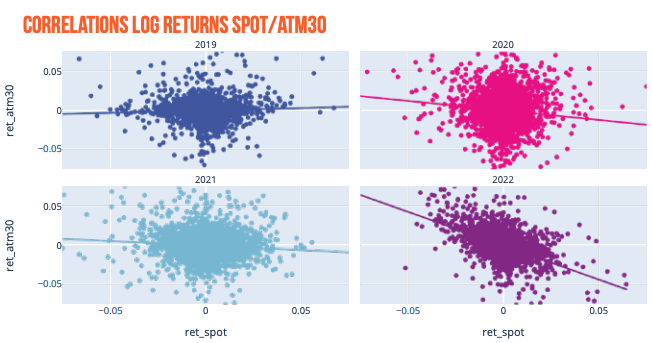
2022 stands out as a regime-changing year. We can see a much more negative scatter plot slope and a “tighter” range of readings.
On the rolling plot, we can also notice deeply negative and persistent readings of the beta values.
One of the big questions in crypto vol is whether this shift is cyclical (temporary) or structural (persistent).
In traditional markets, equity spot/vol regimes will be negative (like we see in 2022 for BTC) but commodities often display a positive relationship, as production & demand shocks affect the commodity volatility space in a different way.
While we described the ATM term structure as the “spine” of the volatility surface, the wings would be the OTM (out-of-themoney) options. Specifically, we analyze the Δ25 OTM options. The relationship between the Δ25-Call implied volatility (minus) the Δ25-Put implied volatility would be the RR-Skew (RiskReversal Skew).
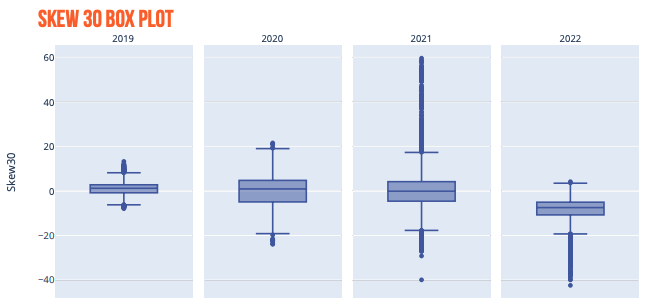
We can see two big trends when the RR-Skew is grouped and analyzed by different year buckets.
First, although 2020 and 2021 had similar variance in the term structure analysis, the RR-Skew was much more muted in 2020 than in 2021.
2021 stands out as a clear outlier in terms of overall RR-Skew range.
Secondly, the total range of RR-Skew for 2019, 2020, and 2021 is loosely symmetrical. A clear outlier to this trend is 2022, where the RR-Skew is decidedly negative and nearly never positive.
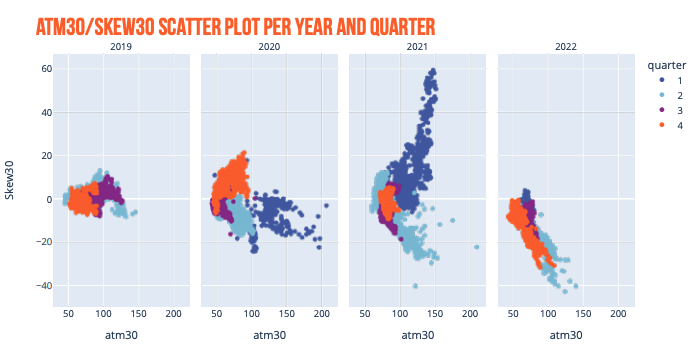
Layering the relationship between 30-day ATM implied volatility and the 30-day RR-Skew, we can see that 2021 and 2022 have two completely inverse relationships. 2021 is marked by upside momentum - especially true for Q1 2021. As implied volatility increased the RR-Skew became more and more positive.
2022 saw the opposite, especially pronounced in Q2 and Q4.
As implied volatility came into the market, the RRSkew became more negative.
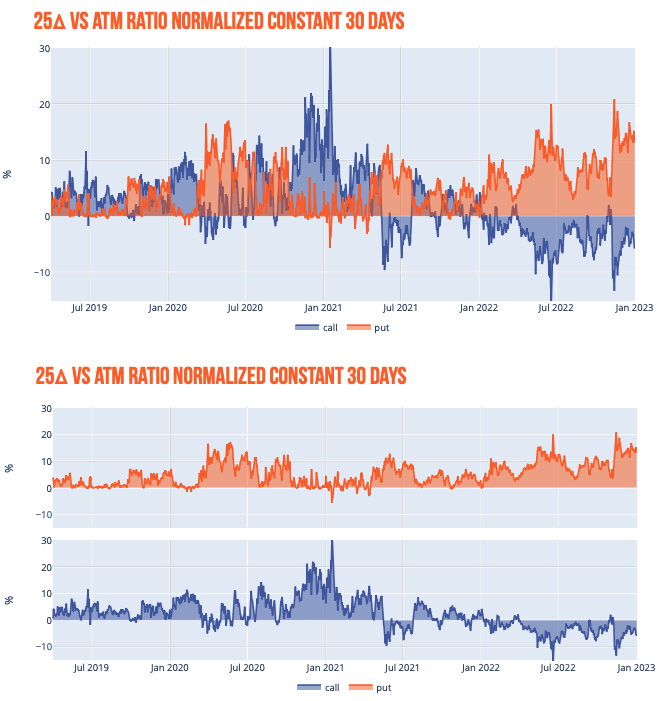
If we isolate the Δ25 Call/Put wings and ratio them by ATM volatility, we can see that call wings began to persistently trade at a discount to ATM IV (by nearly 10%) - a phenomenon similar to equity index volatility - starting in July 2021.
Puts have never traded at a discount to ATM volatility, but in the bullish market of Jan 2021, we can see Δ25 Put IV traded on par with ATM IV. This type of volatility pricing is enticing for 1x2 and put ratio spreads, which allow you to buy 2 OTM options with nearly no IV premium to the ATM option you’re selling.
To continue reading the report, click here.
