Share this blog:

In this quarterly report teaser of decoding option flows we take a deep dive analysis and provide key insights into crypto volatility as it is still in its early stages, and there is no established framework for analyzing crypto volatility.
This Q2 2023 report is collectively written by Greg Magadini, Director of Derivatives, Amberdata; Fabio Bassani, Analyst, Amberdata; Tony Stewart, Strategic Advisor, Amberdata; Euan Sinclair, Strategic Advisor, Amberdata; and Samneet Chapel, Quantitative Researcher, LedgerPrime.
Forward
Crypto volatility trading has remained concentrated on flows being executed on Deribit, a few smaller CeFi exchanges, and a handful of OTC desks.
Despite the fragmentation between various venues (not to mention a growing opportunity within
on-chain DeFi options), analyzing the trade volumes that flow through Deribit has provided our
customers with actionable insights that represent a vast percentage of total option activity. Crypto volatility trading is still in its infancy and many of the “traditional” flows we’re used to seeing in equities and other markets have only begun to be replicated in the crypto volatility landscape.
The Amberdata team, including Tony Stewart and Euan Sinclair, have developed proprietary tools to tag the trade direction of aggressors. This has enabled us to glean subtle information found within option volumes and positioning.
We look forward to sharing our insights found using the tools currently available to Amberdata customers.
INTRODUCTION
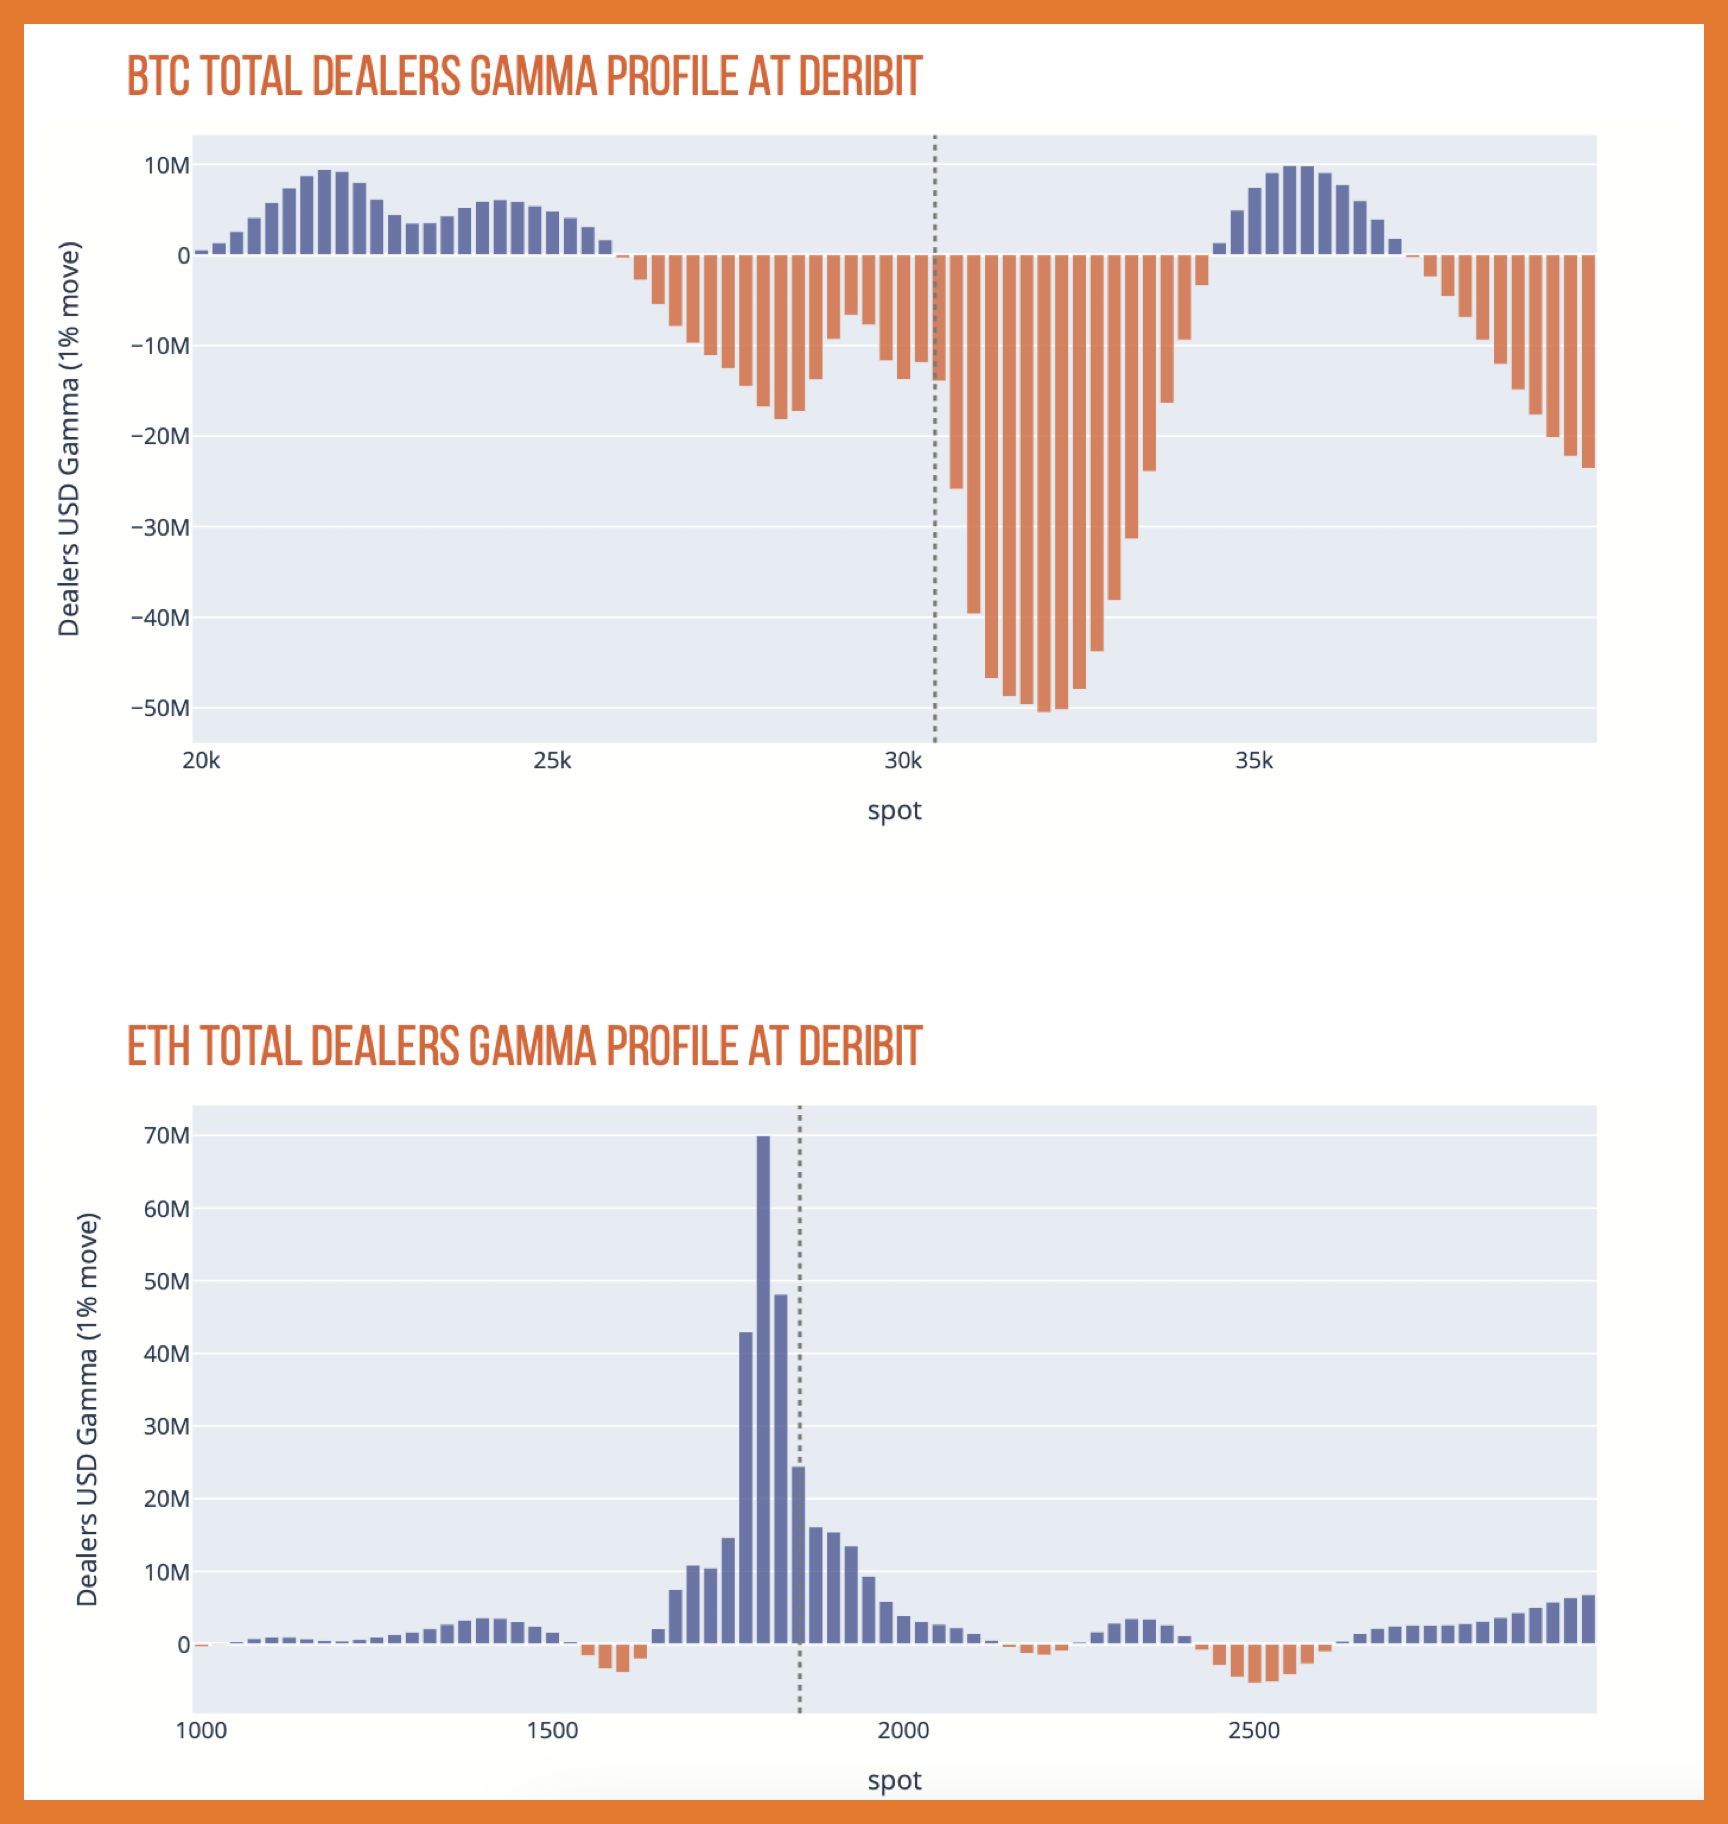
YTD we’ve seen interesting trends in crypto volatility, ranging from a reversal of the 2022 spot/vol dynamics, compressed relative volatility between BTC & ETH, and finally, massive flows that have created divergent gamma profiles between these two assets.
As BTC became a sought-after crypto earlier this year, especially in response to the SVB banking crisis, we’ve seen a strong positive spot/vol dynamic for the asset. Fundamentally speaking, many view BTC as more of a pure play on monetary policy, while ETH is often viewed as a crypto “tech-play”.
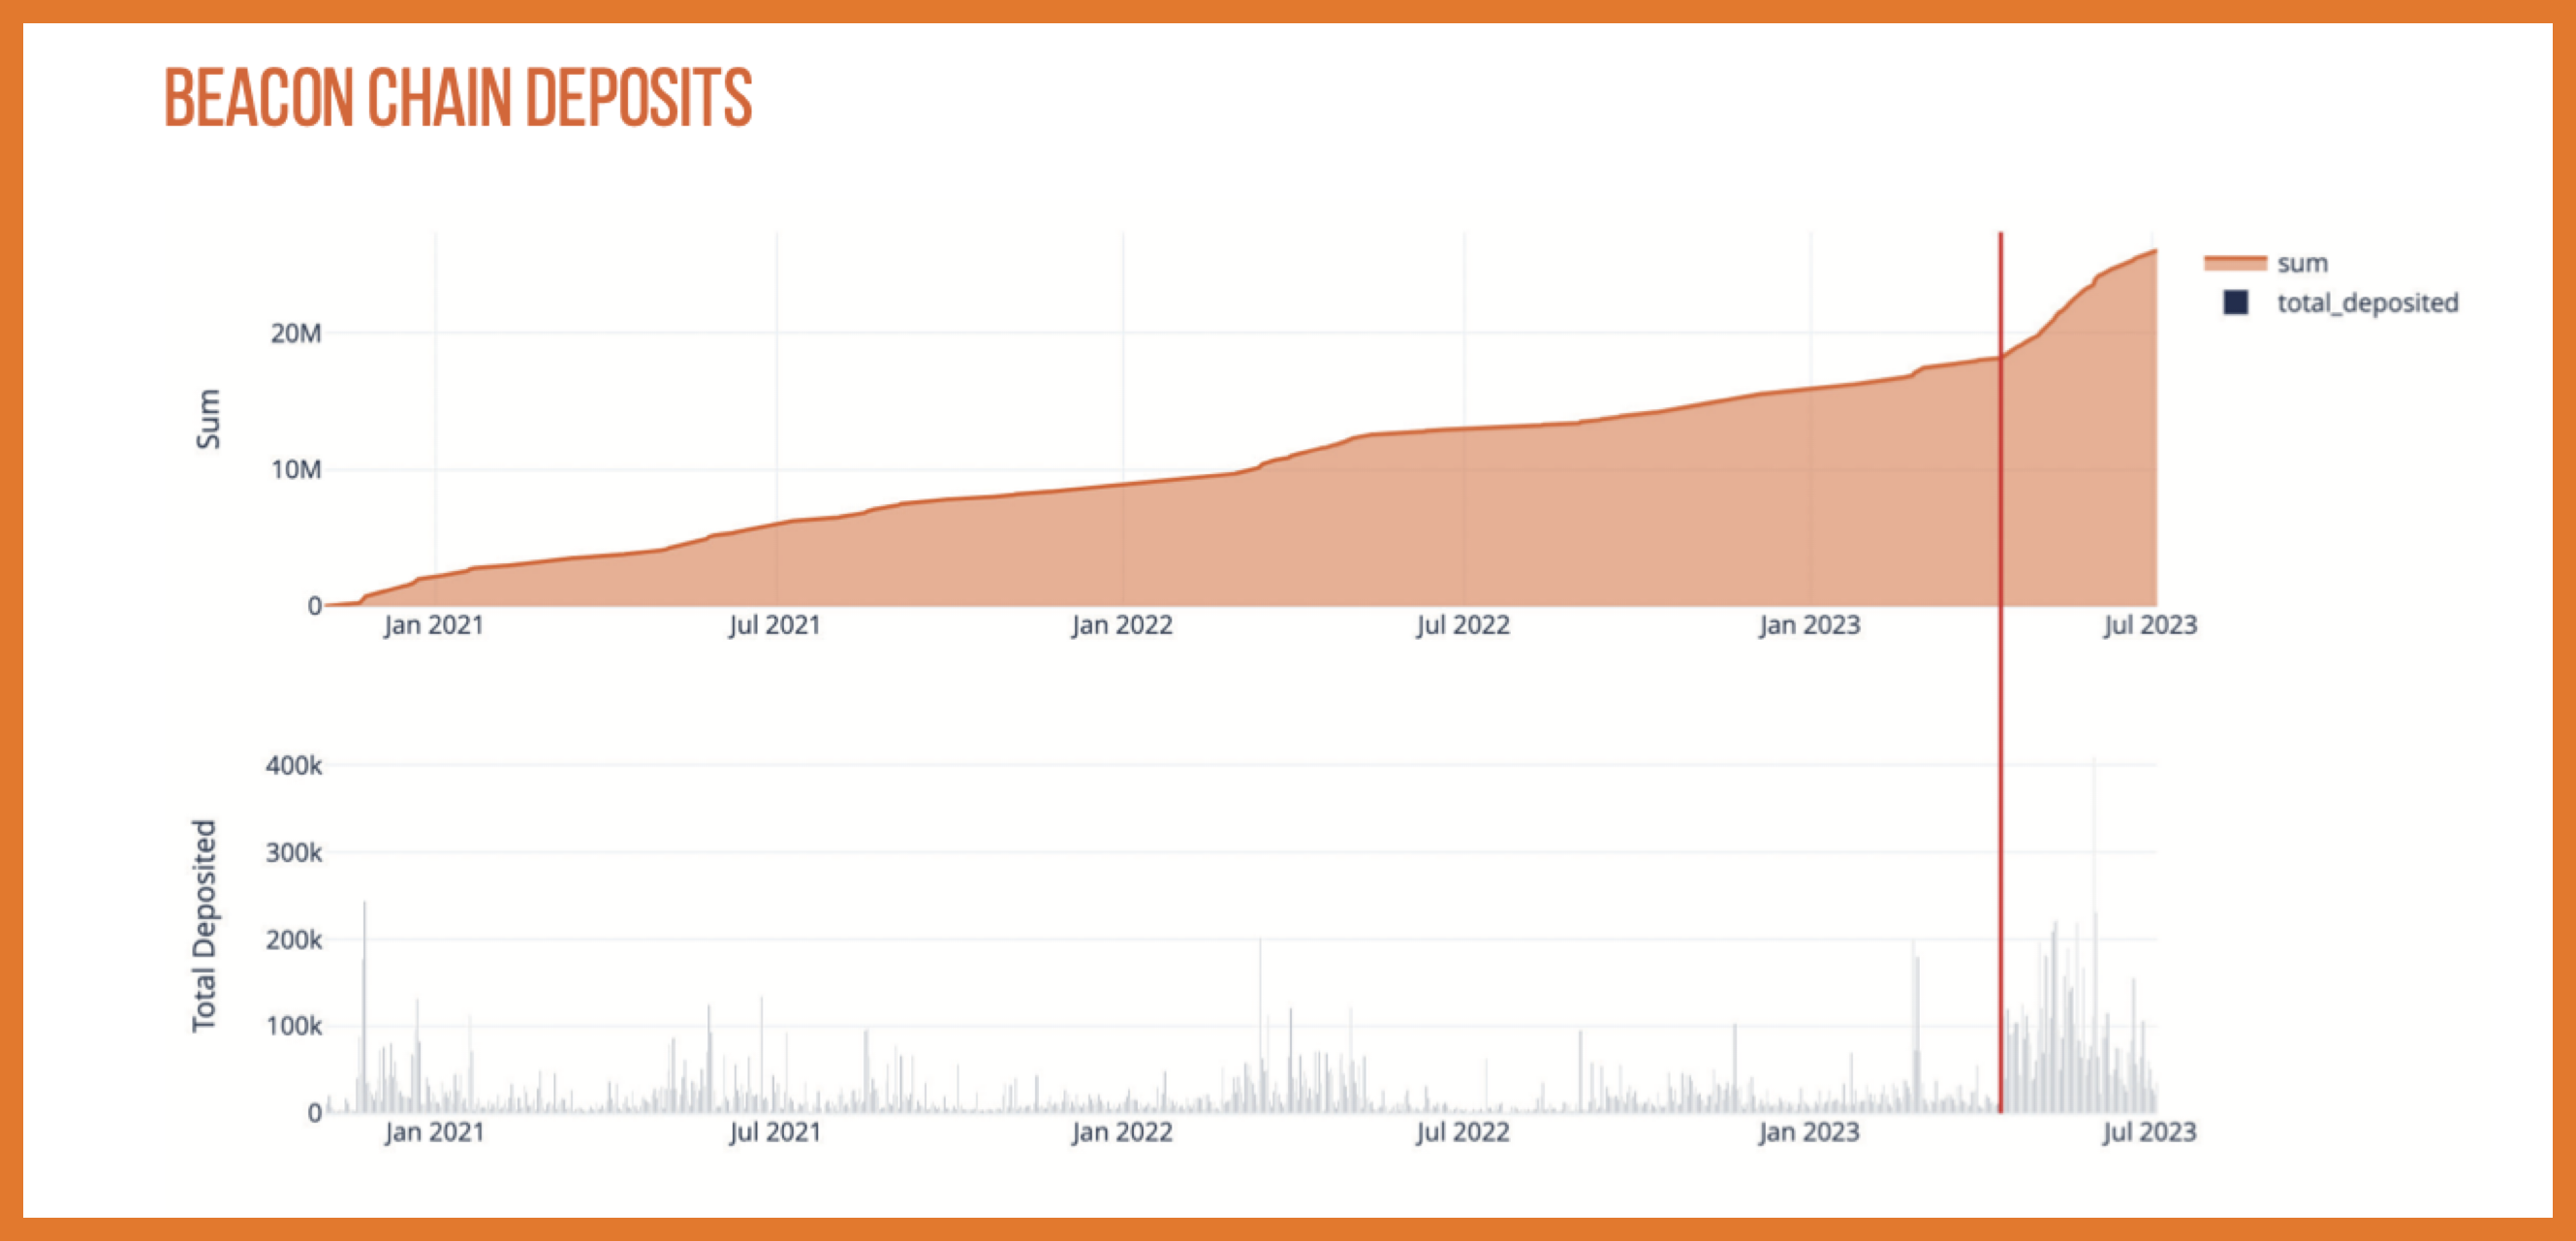
In September of 2022, ETH moved to PoS, enabling holders to stake ETH for yield. Furthermore, as a result of the April 2023 Shanghai upgrade, the ability to “unstake” one’s ETH finally became available. This has attracted a lot more staking flows and created a lucrative opportunity for ETH holders to enhance their yield by also selling “covered calls” against their staked ETH holdings.
MARKET REGIME
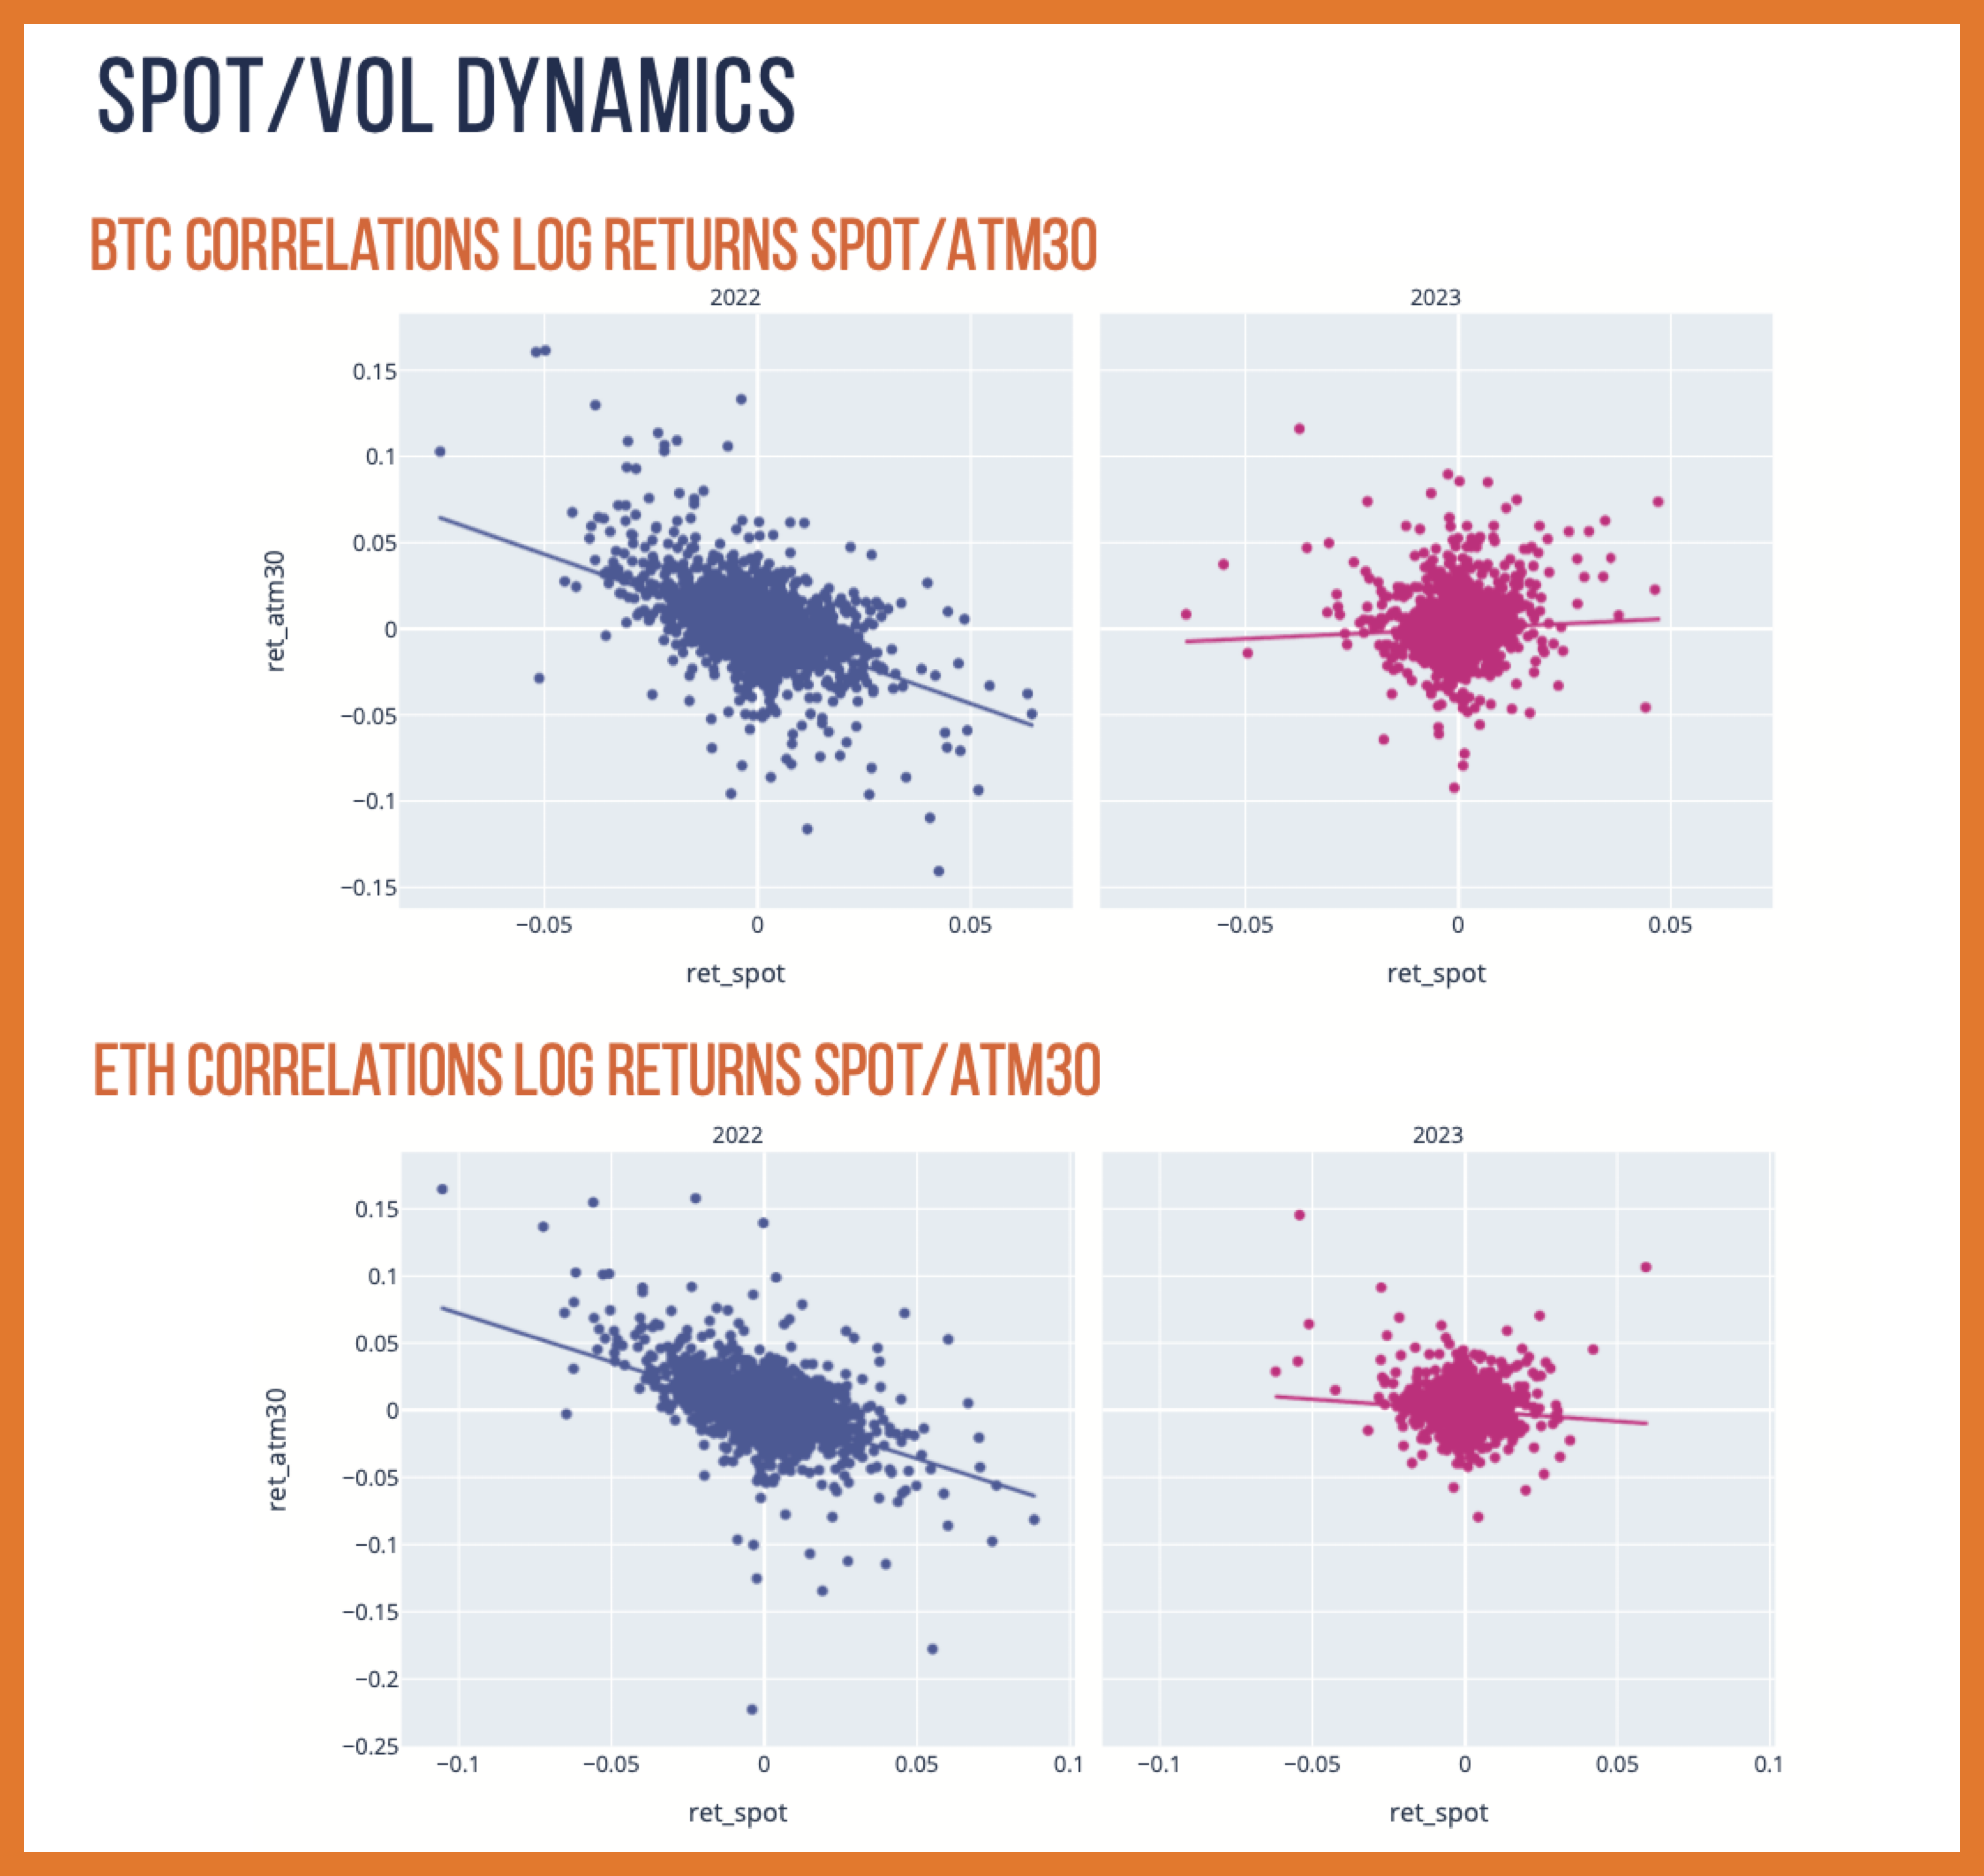
Comparing the scatterplot of spot price returns vs changes in 30-DTE “at-the-money” implied volatility, we see two significant trends here as well:
- In 2022, both BTC and ETH had nearly identical relationships with each other.
- 2022 displayed decidedly negative spot/vol regimes, while this year BTC displays a slightly positive spot/vol dynamic, while ETH’s negative spot/vol relationship is much more muted.
The divergence in spot/vol dynamics of tightly correlated assets is a fascinating event.
BETA & REALIZED VOLATILITY
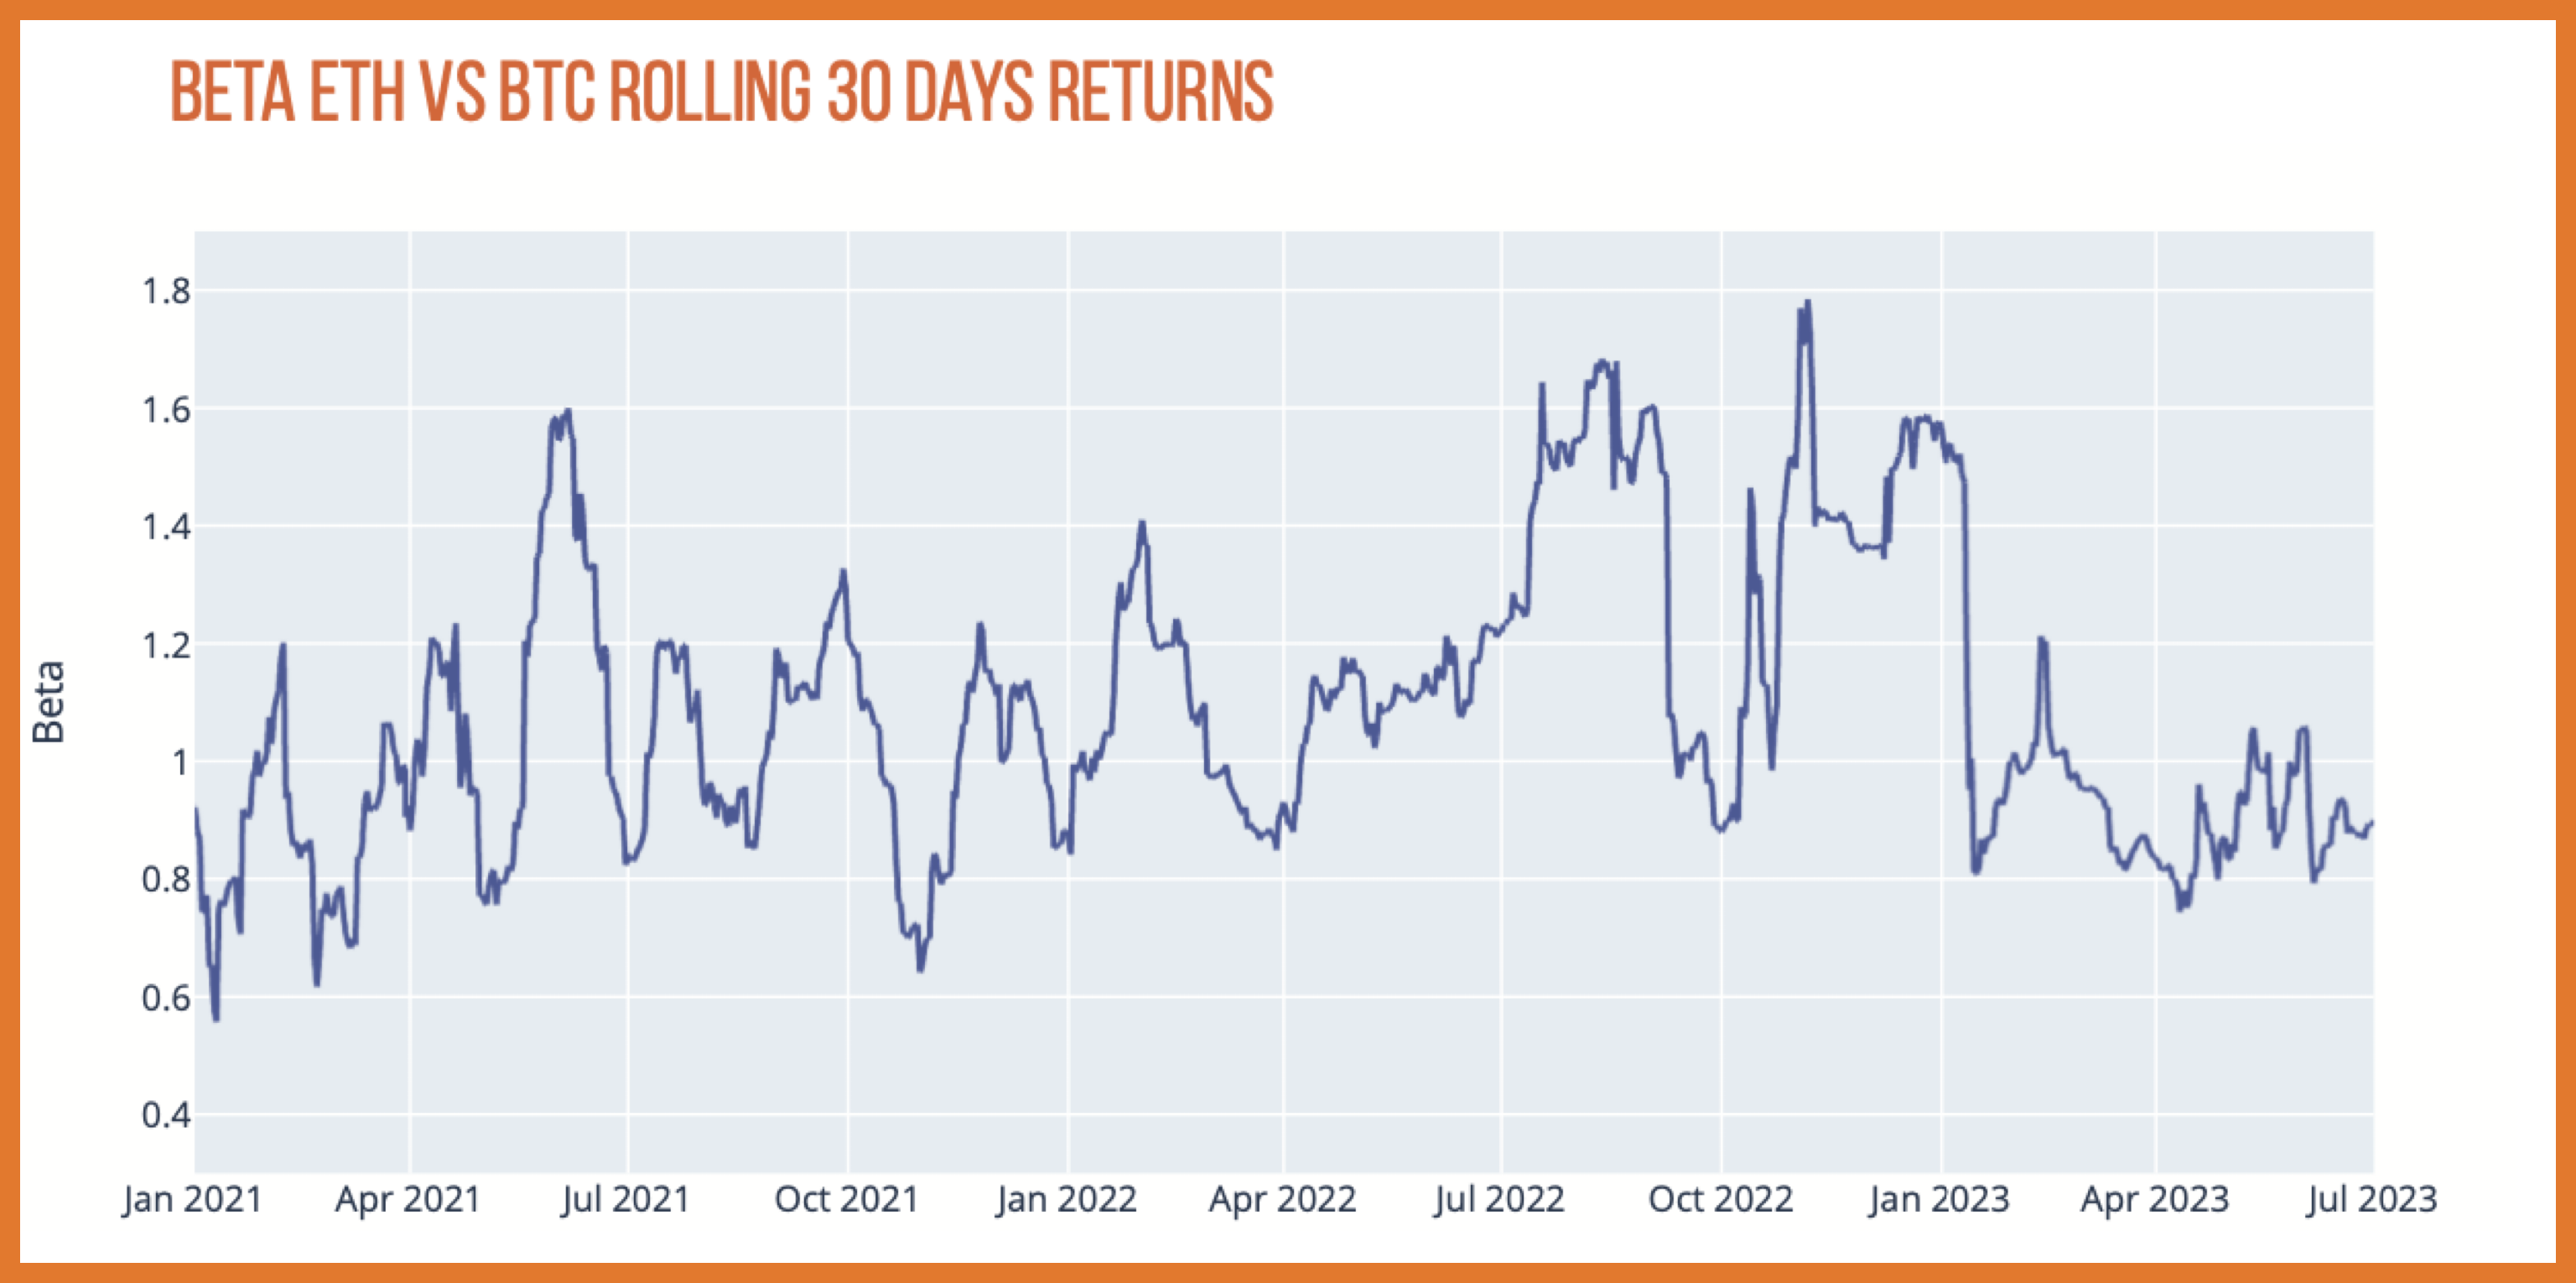
In order to explore the relative volatility of BTC and ETH, it makes sense to first measure the relationship in realized terms.
Here we look at the “beta” of ETH in BTC terms. Meaning if our beta value is greater than 1.00, ETH outpaces BTC’s move. Vice versa when we are under 1.00.
Historically speaking, we can see that ETH has normally had a much higher beta than 1.00; this trend stopped in 2023, especially in Q2 2023.
Now, not only is the beta between 0.80 and 1.00, but the volatility of the beta parameter has subdued, making our currently new beta environment also a stable one.

Looking at outright realized volatility, instead of beta, we can see a structural downward trend that has culminated in both BTC and ETH, with realized volatility becoming compressed, but ETH’s excess RV vanishing is what’s really interesting: that’s something that has only been true since mid- March 2023.
FLOWS
GAMMA PROFILE: DECODING OPTIONS FLOW
When we started to analyze option flows we realized that the taker direction of trades calculated by the Deribit engine was not always reliable under certain scenarios.
We wanted a more nuanced calculation for taker direction, one that could take into account all the types of trades hitting the order book. For example, some different and more complex rules needed to be used for block trades or spotting resting orders in the orderbook.
With that goal in mind, in early 2022 we released a new tool that has a unique algorithmic approach to direction detection.
In the end, we finished our algorithm with around 30 heuristics (high probability rules), to assess the real initiator’s trade direction.
These rules are in competition and each rule is assigned a weight. Results are aggregated for determining the final direction of the trade.
Think of a rules-based matrix grid, each rule giving a probability scoring the likely direction of the trade.


With Shapella a technical success and ETH rallying over $2.1k for a short period, a sense of calm and reduced uncertainty over ETH supply resulted and ETH IV retraced lower. Both assets settled into a tighter range for volatility as spot prices drifted.
This dynamic of selling covered calls against long ETH holdings has the potential to shift spot/vol dynamics - to a certain extent - as new buyers of spot ETH become simultaneous sellers of volatility.
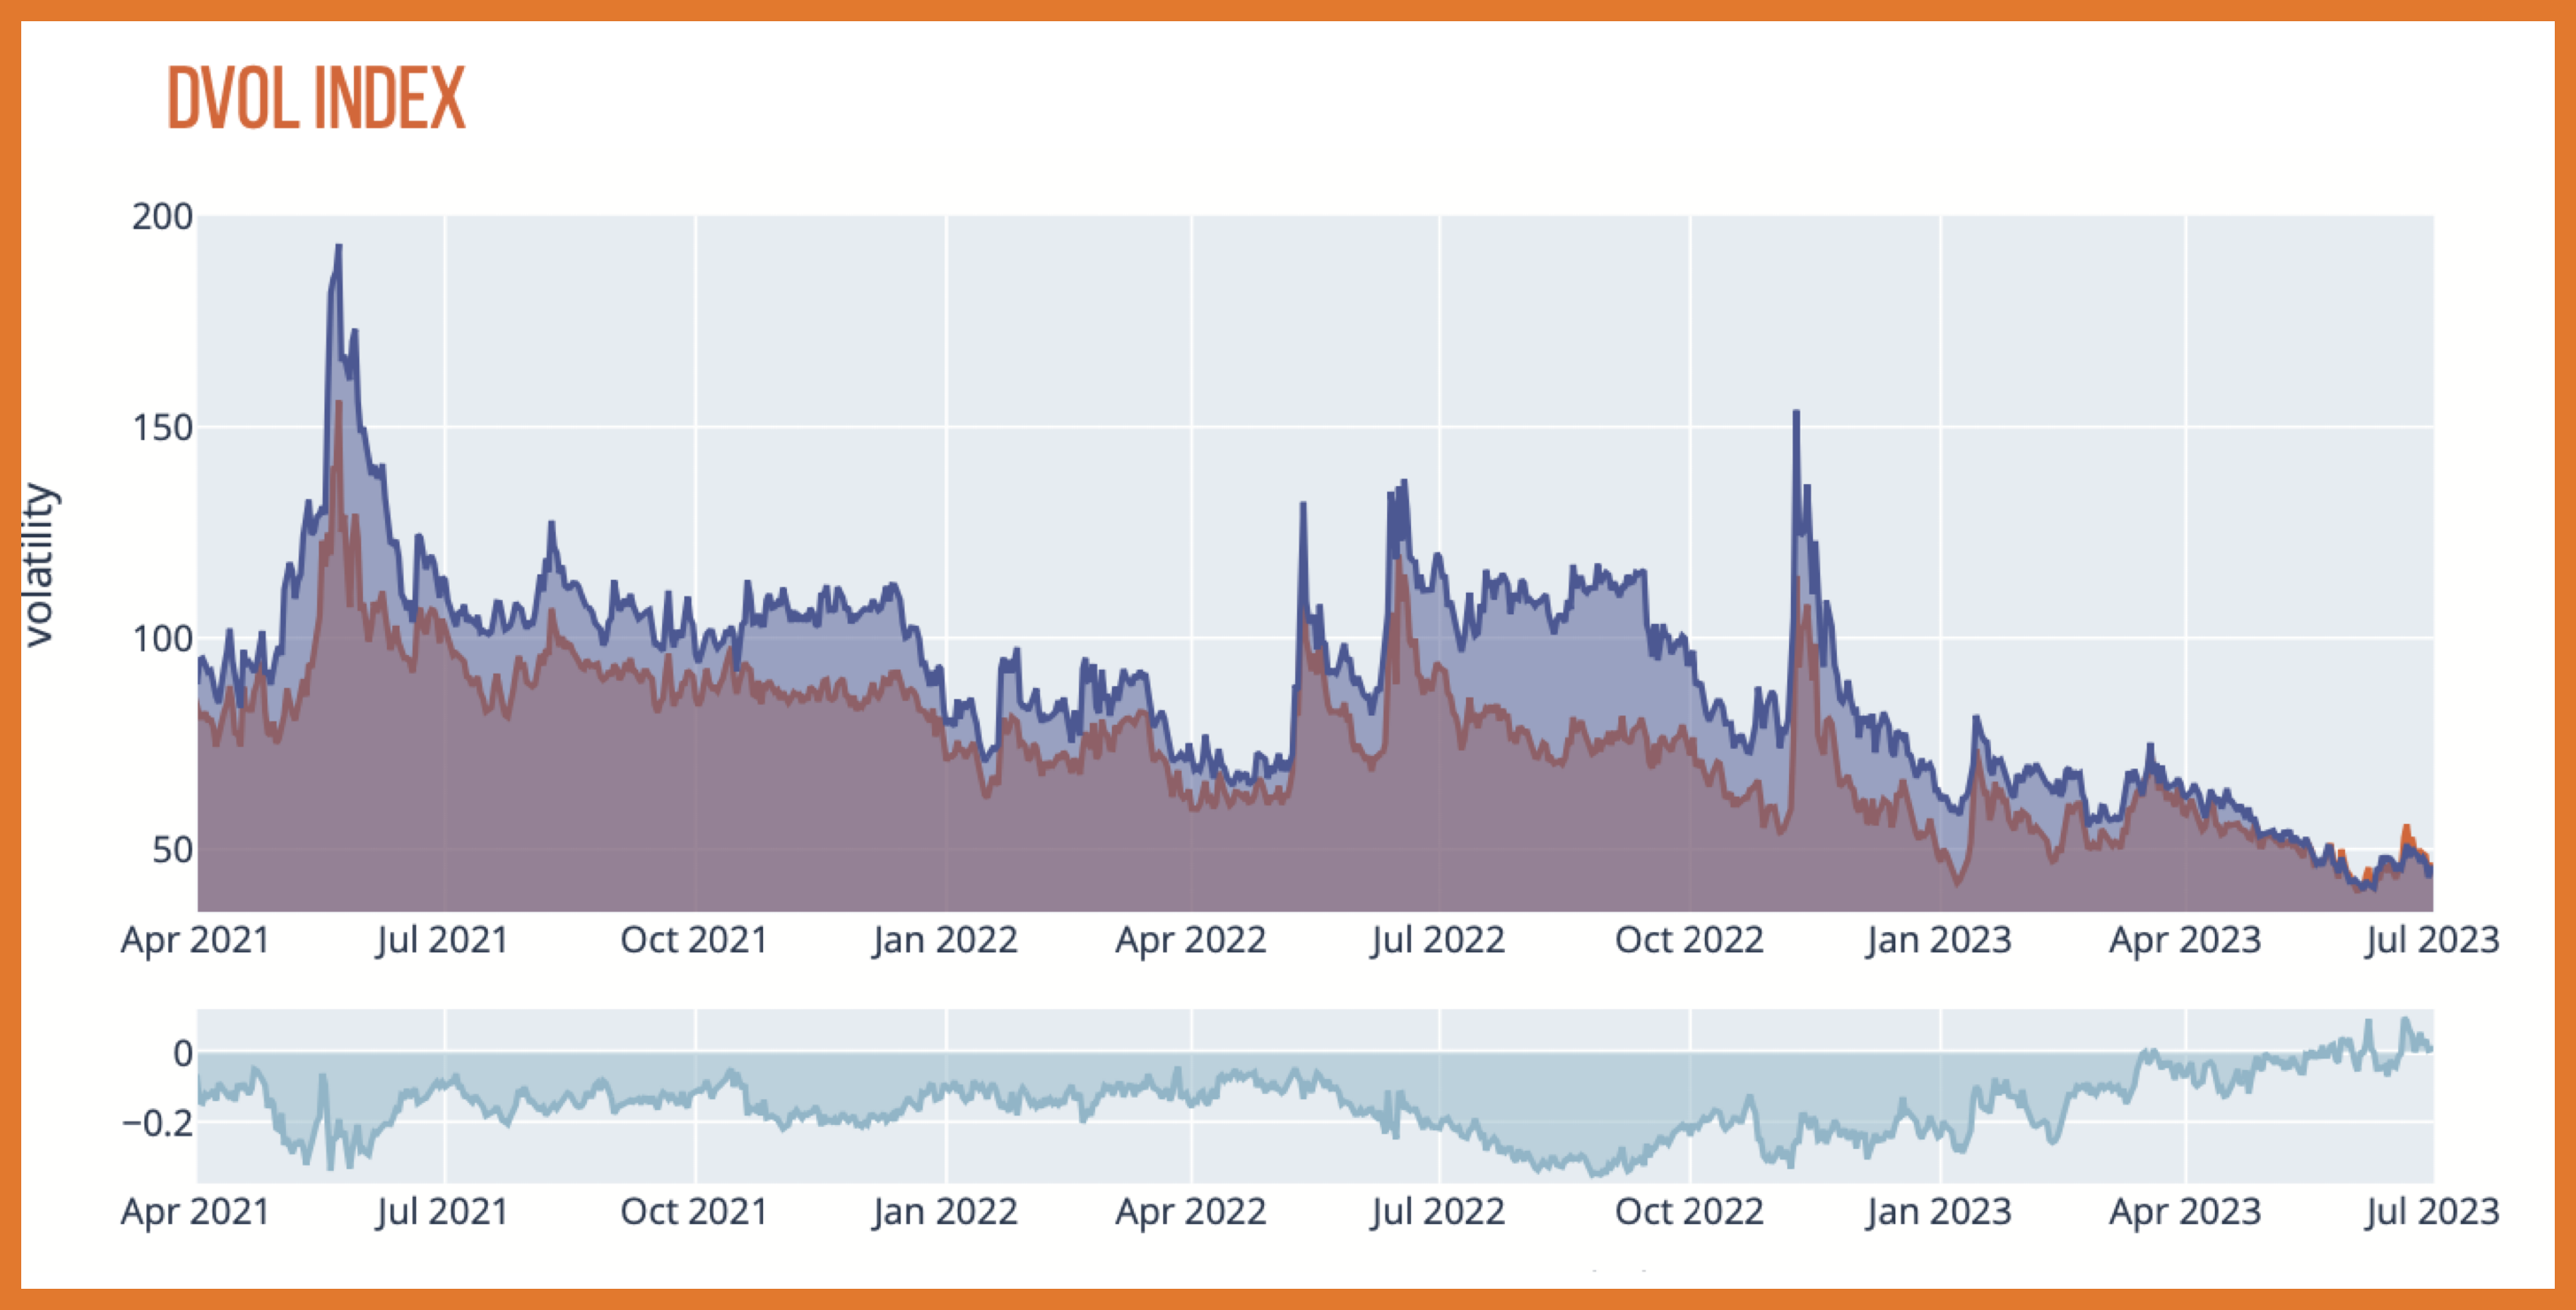
Finally, on the tradable product front, Deribit launched cash-settled futures for their DVOL index. DVOL index values first began to be published in March 2021. In April 2023 DVOL futures were launched.
We wrap up our report with an exposé around DVOL index metrics and data.
Trading DVOL
Some of this differential also came from profit taking in outright calls and call spreads for BTC, ahead of April FOMC on the same date.
While there was optimism for ETH, there was hesitation for BTC after the impressive year-to-date rally; BTC protection was bought targeting the $27k Strike via “Put-Flys” and “Risk-Reversals”.
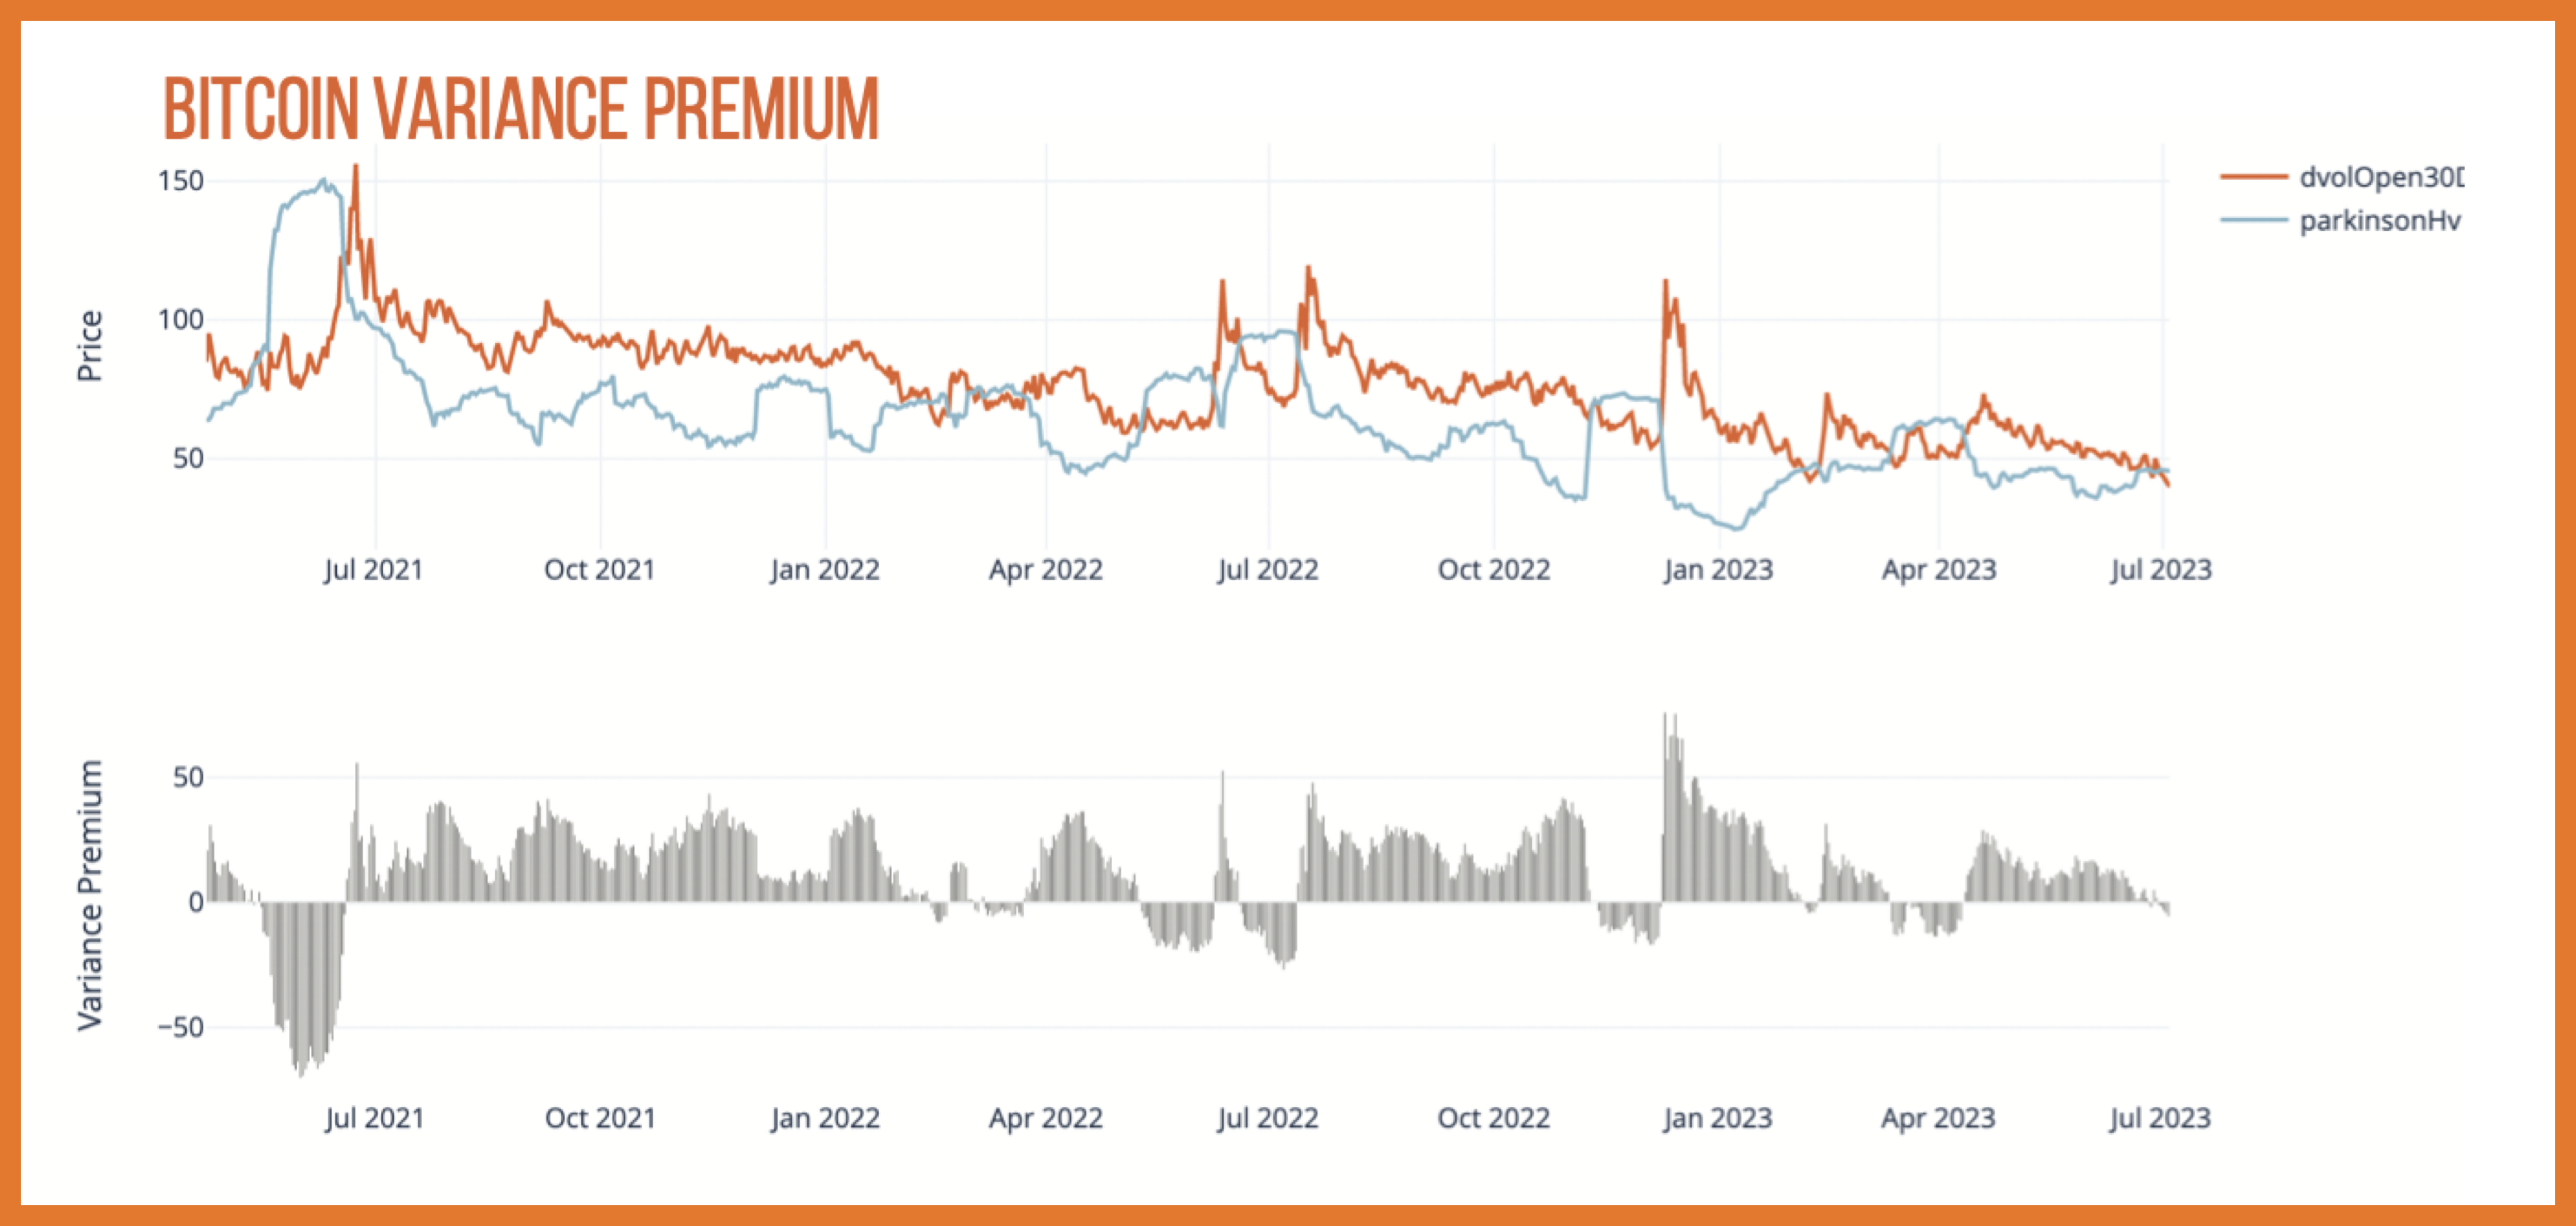
One of the clearest phenomena we can observe using DVOL to calculate the historical VRP - aligning RV with shifted DVOL IV - is the general tendency for Bitcoin options to be overpriced relative to realized volatility.
Only 25% of the time is the VRP less than +1.80 IV points and although the minimum and maximum VRP are both around the +/-70 IV point range, only 5% of the time is VRP -20 points or less. Alternatively, the median VRP value is +14 IV Points.
This clear trend suggests that the “base case” for crypto option traders is to lean towards short-vol strategies in crypto.
We showed this in our January 2023 report backtest. There is massive profitability in straddle-selling strategies, using simple rules-based delta hedging techniques.

There are a few theories why this extremely large VRP exists in crypto and BTC specifically.
- The crypto market was built by retail first, often with FOMO enthusiasm. This means that well-capitalized volatility sellers are generally outnumbered by enthusiastic volatility buyers when things start moving.
-
Another factor is due to the nature of institutional flows. Historically, fund managers supply call options by buying the underlying assets and selling “covered calls” against them. Until institutional players participate en masse in the crypto volatility, the supply of CC selling is limited.
Note: For the first time ever, we seem to be witnessing this trend in ETH and it has quickly crushed IV lower, to historically new relative volatility levels.
One of the most attractive components of Deribit’s DVOL index is that it incorporates option prices all along the skew.
Except for options with a delta smaller than the ABS(Δ5) cutoff, all other strikes are included in the calculation of the DVOL index. This means that the index value of DVOL includes the components of skew “curvature”.
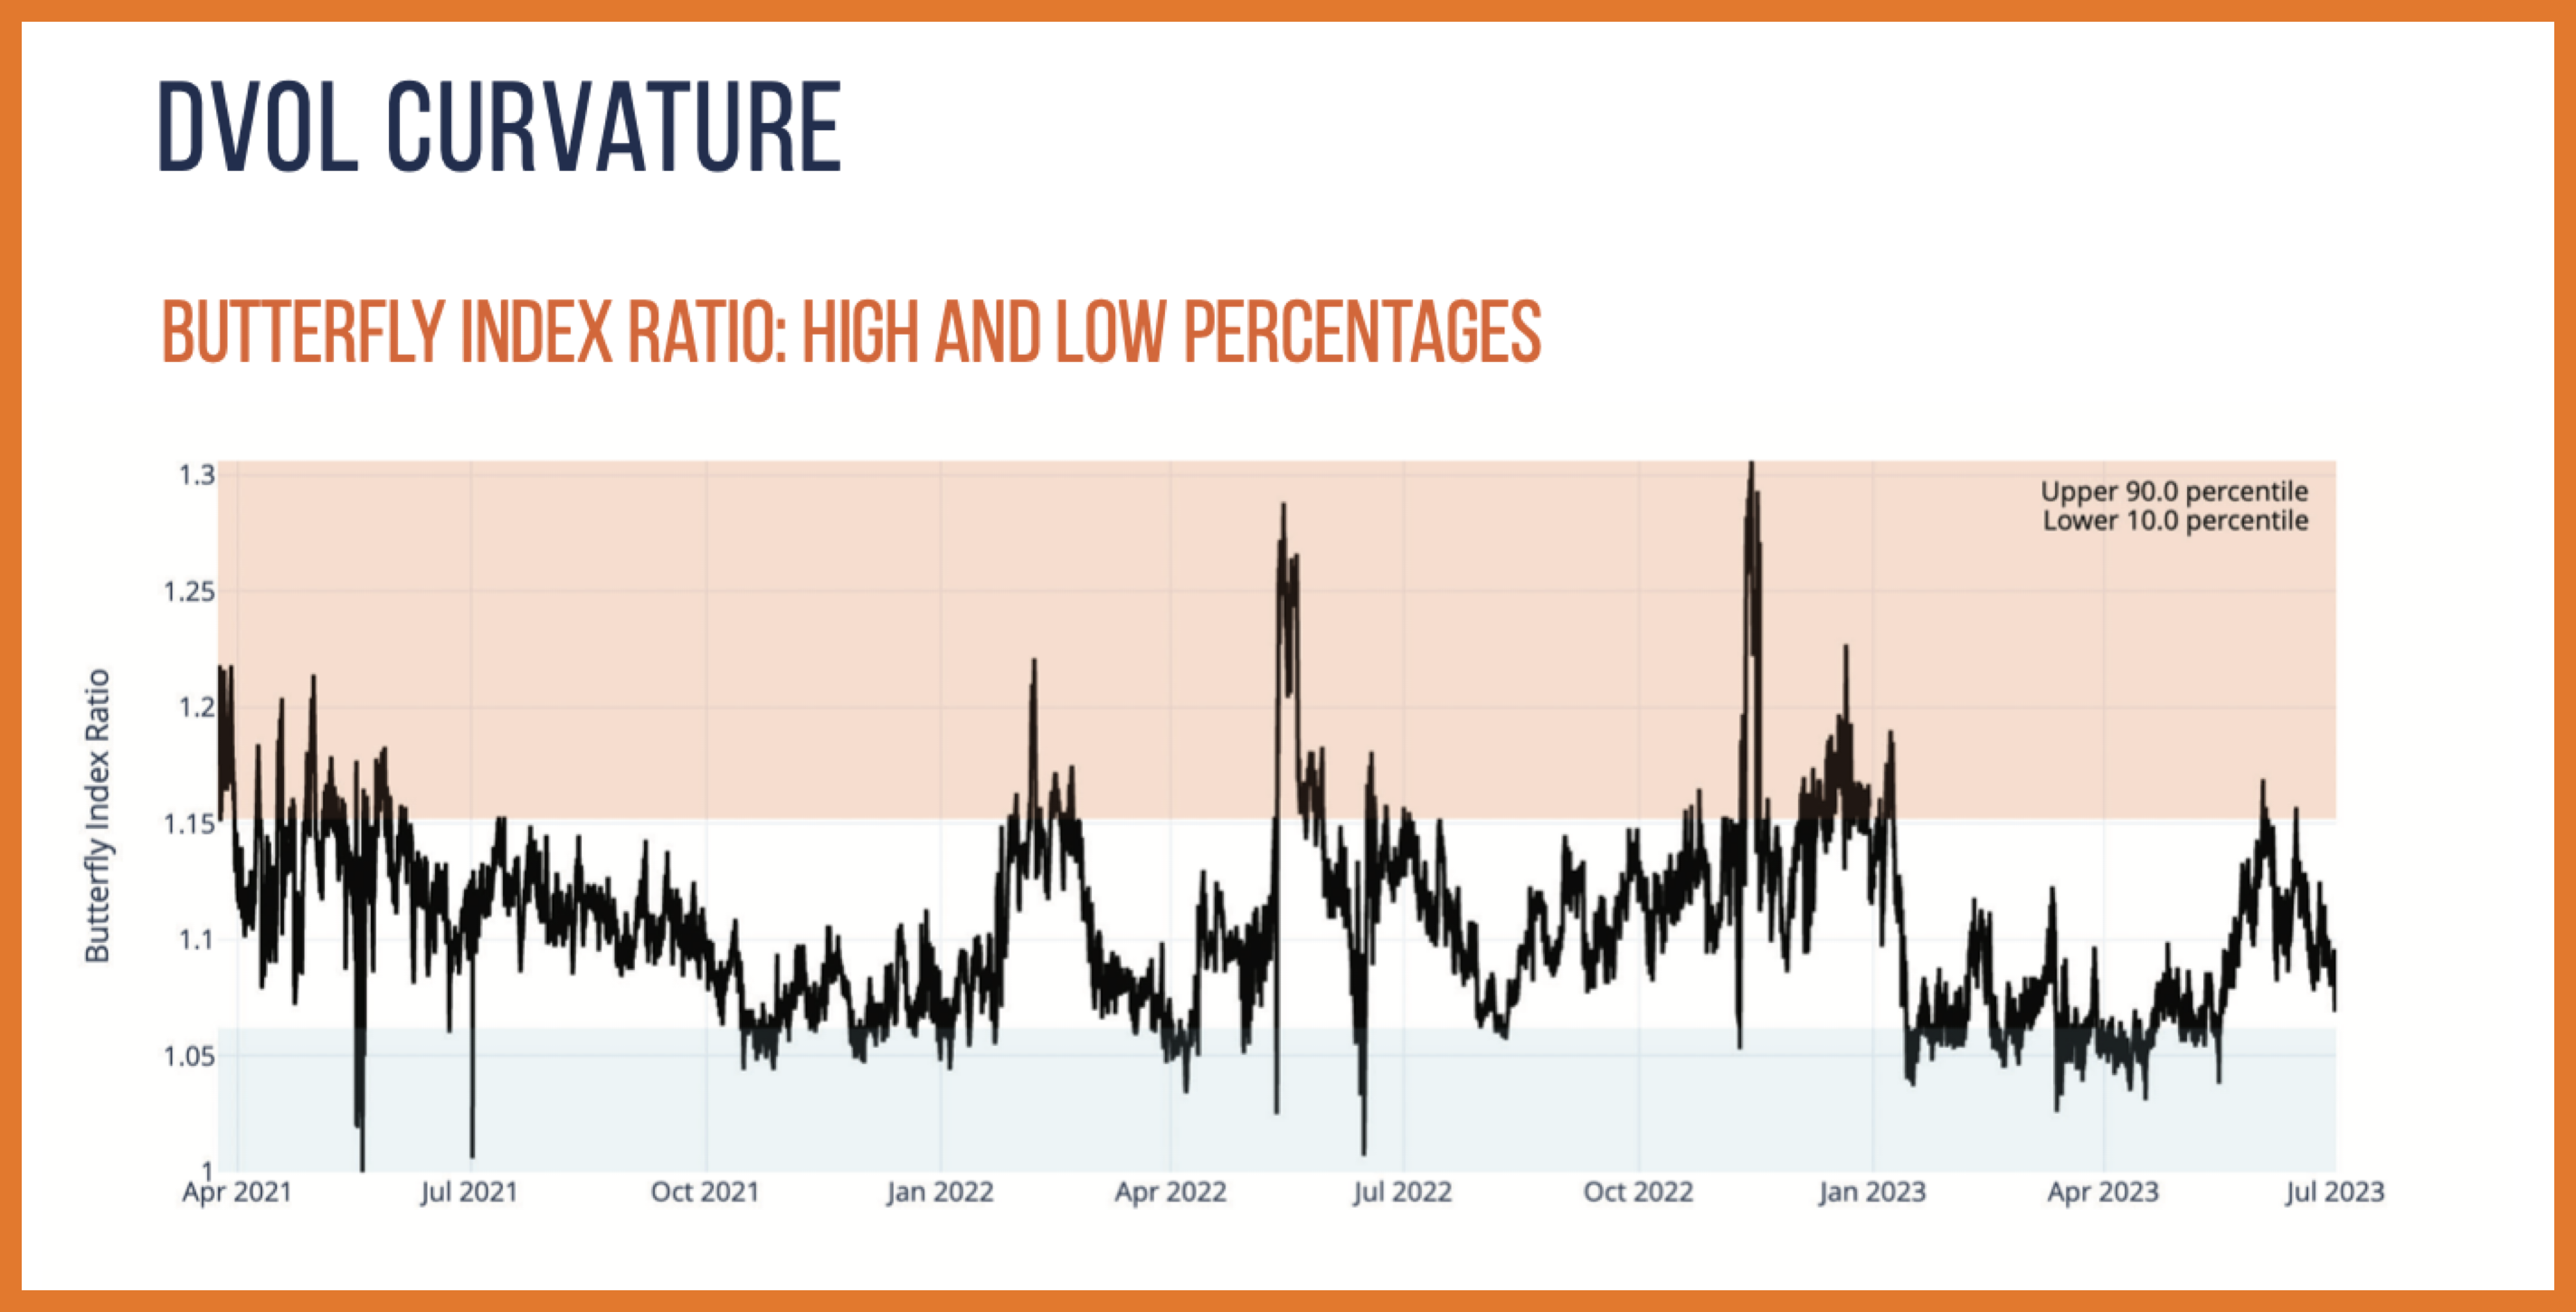
One interesting feature we built, here at Amberdata Derivatives, is the ratio of DVOL index value to 30- DTE ATM volatility.
This attempts to quantify the curvature value of the DVOL Index. We’ve also identified the extreme values of this relationship by imposing an up 90% percentile and lower 10% percentile bands.
One can imagine a scenario where the market is in a panic and traders buy “wing” options as insurance (such as the FTX meltdown). In this case, the “Butterfly Index” would peak, as the convexity of DVOL becomes extremely rich as wings are bid higher.
Another important consideration of this ratio index is that because DVOL targets constant “vega exposure”, different strikes will have different weights.
Lower strikes will have a heavier weight, while higher strikes will have a lower weight; this
causes DVOL curvature (and therefore the “Butterfly Index”) to carry an implicit “put bias”. This bias is heavily mitigated by the ABS(Δ5) cut-off but exists nonetheless.
To continue reading the full report, click here.
