Share this blog:
Earlier this week I created a Twitter Thread outlining my point of view on crypto volatility trading in response to a message I received this week. I thought it would make a great blog, so I am reproducing it here, enjoy!
Markets are volatile due to the last weeks fiasco. When Volatility is high this doesn't always indicate it is the right trade to make.
Historically speaking BUT everything needs to be taken into consideration.
Attractive component when vol trading is the mean reversion.
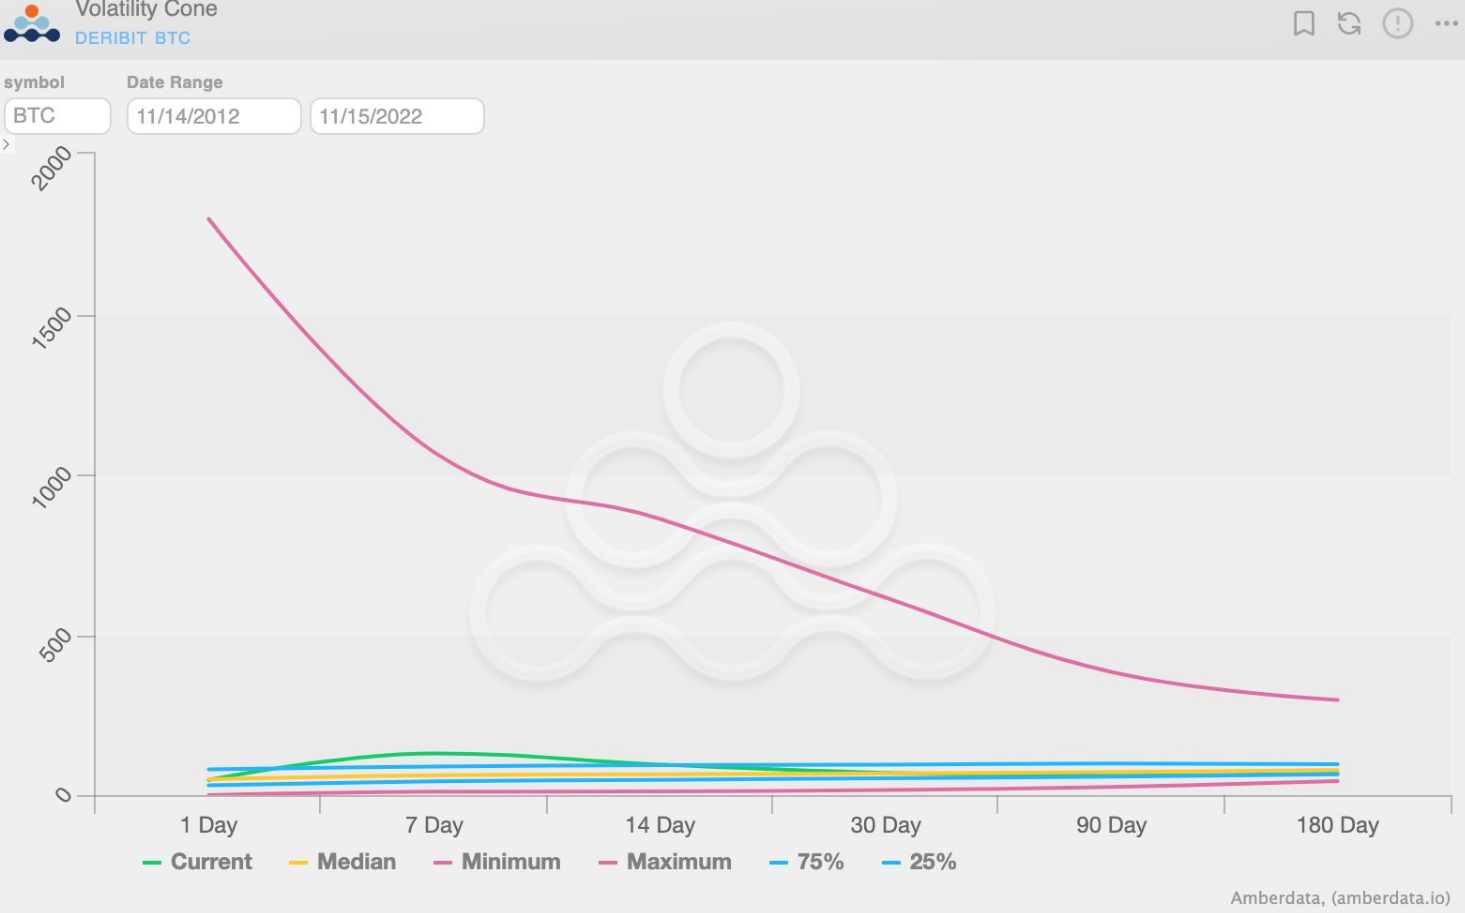
Chart (Volatility Cone) shows the 10yrs of BTC HV.
Chart (Volatility Cone) isolates the "interquartile range"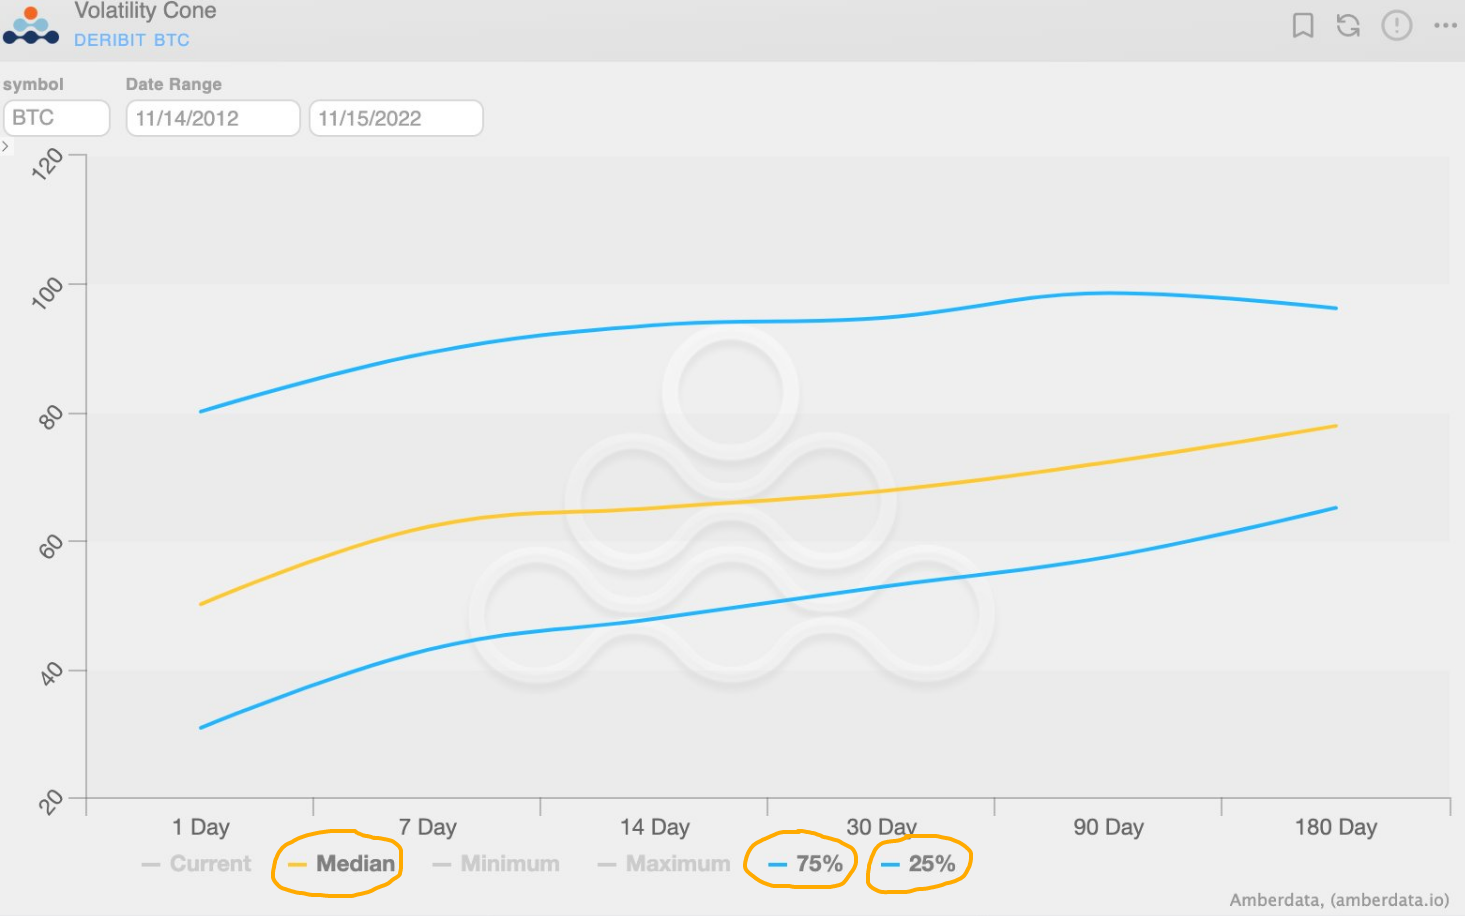
Always remember timing is crucial & the obvious trade is expensive to hold.
(Orange) represents short-vol. positions will "Rollup" and gain IV.
(Blue) represents LONG positions will "Rollup down" and love IV.
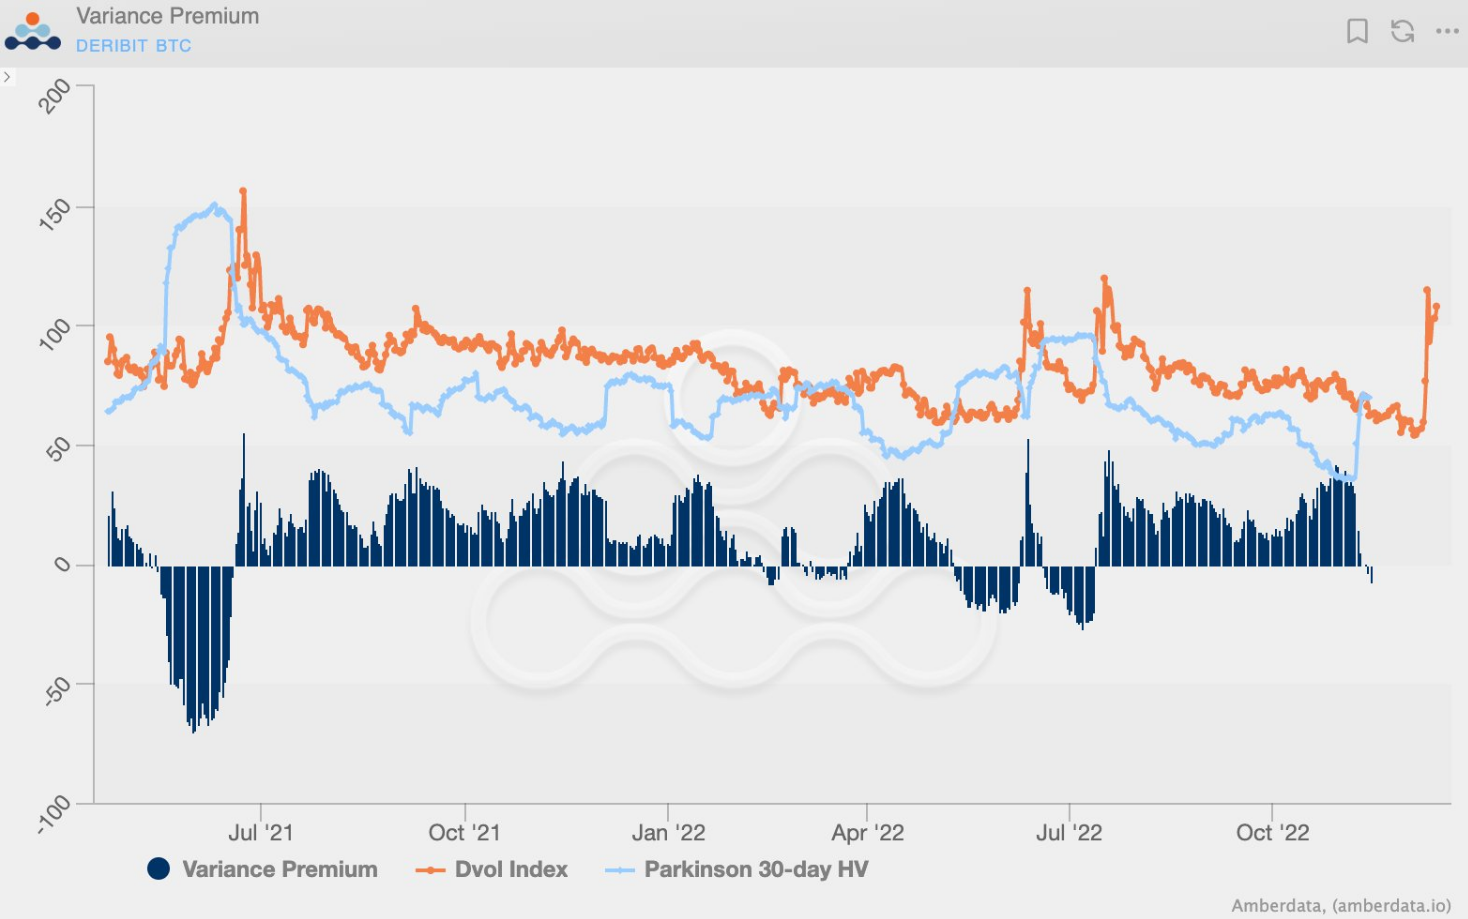
Chart (Variance Premium) showing us when vol. is high the VRP is negative which favors vol buyers. When vol is low, the VRP is positive which favors vol sellers.
Creating interesting market environments creates interesting trading strategies.
2017 VIX bounced between 9-17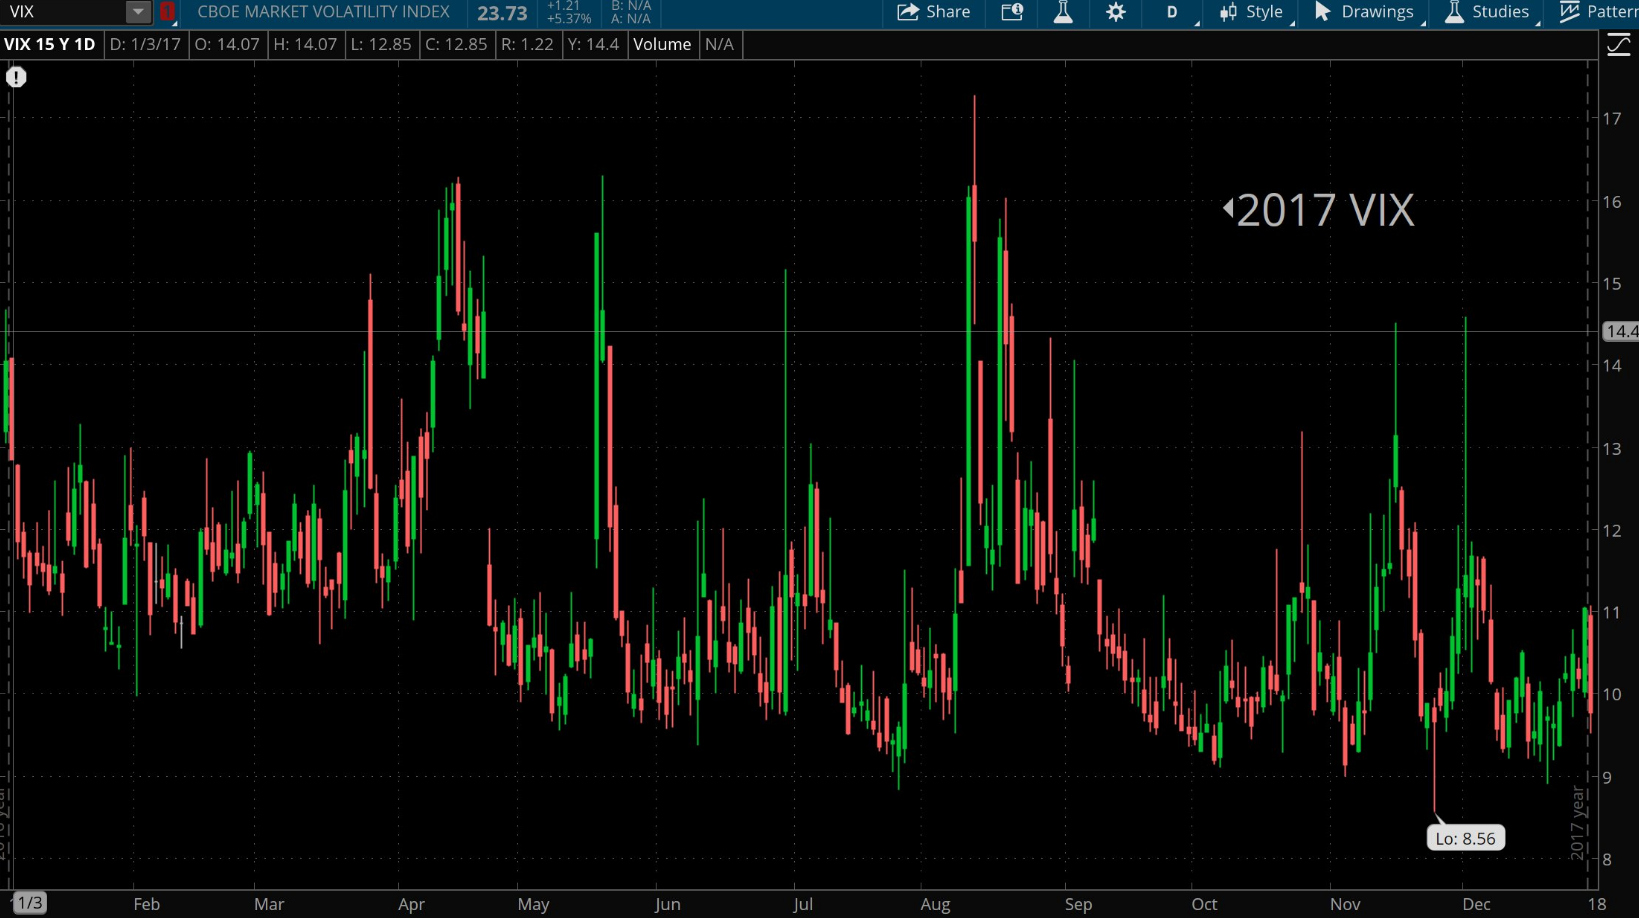
2017 UVXY falling below $500 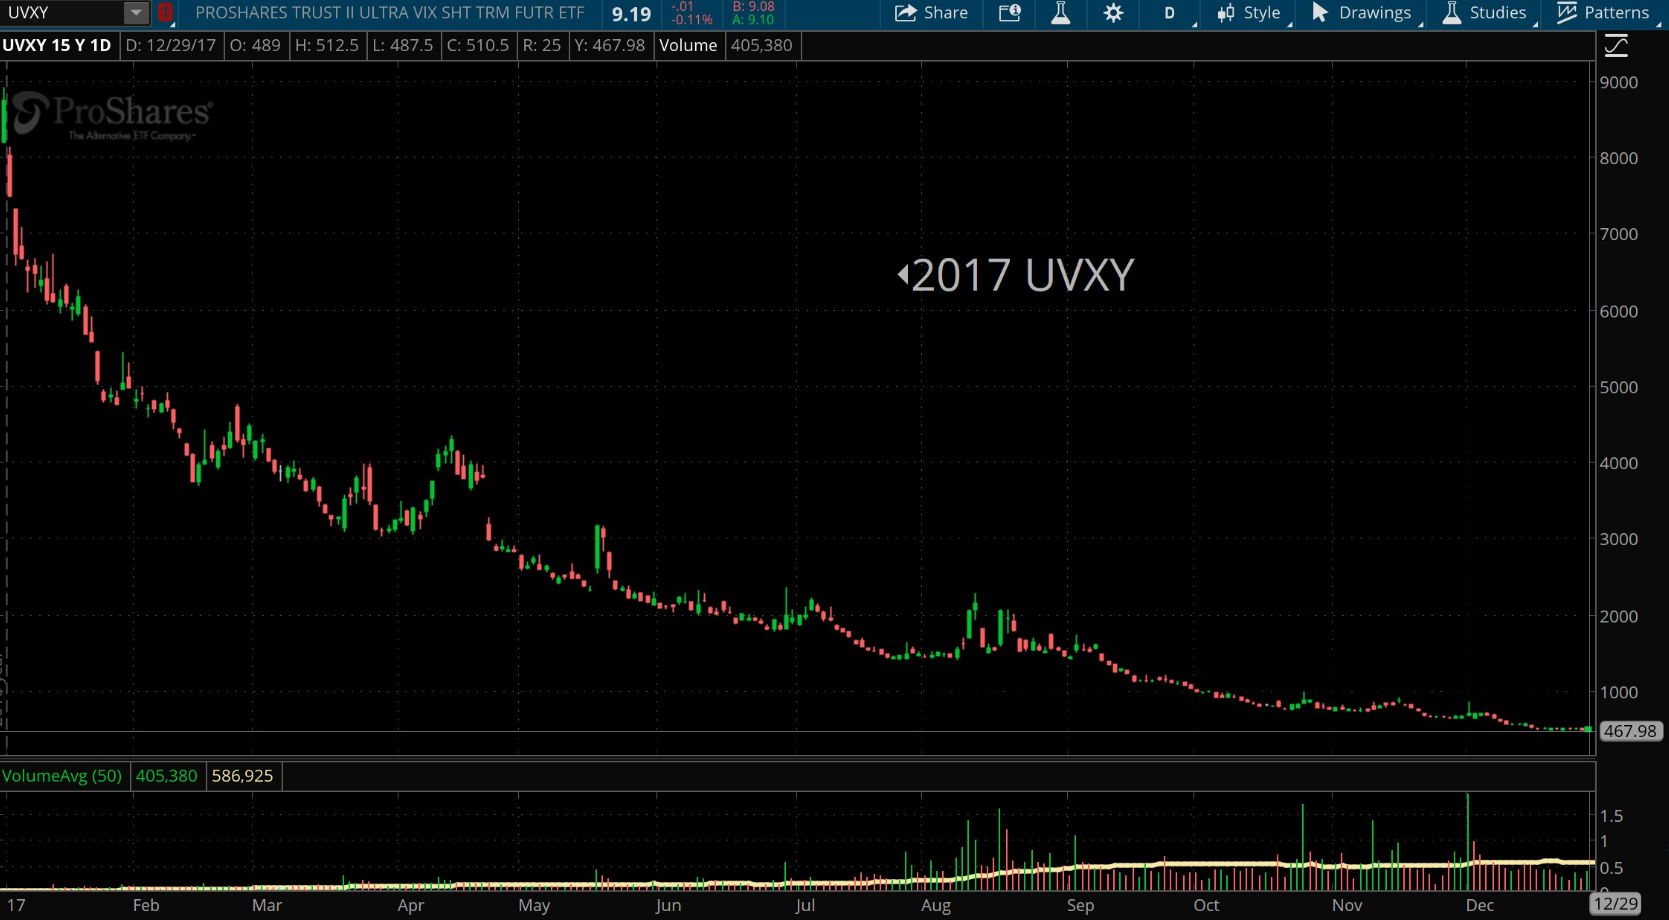
2020 VIX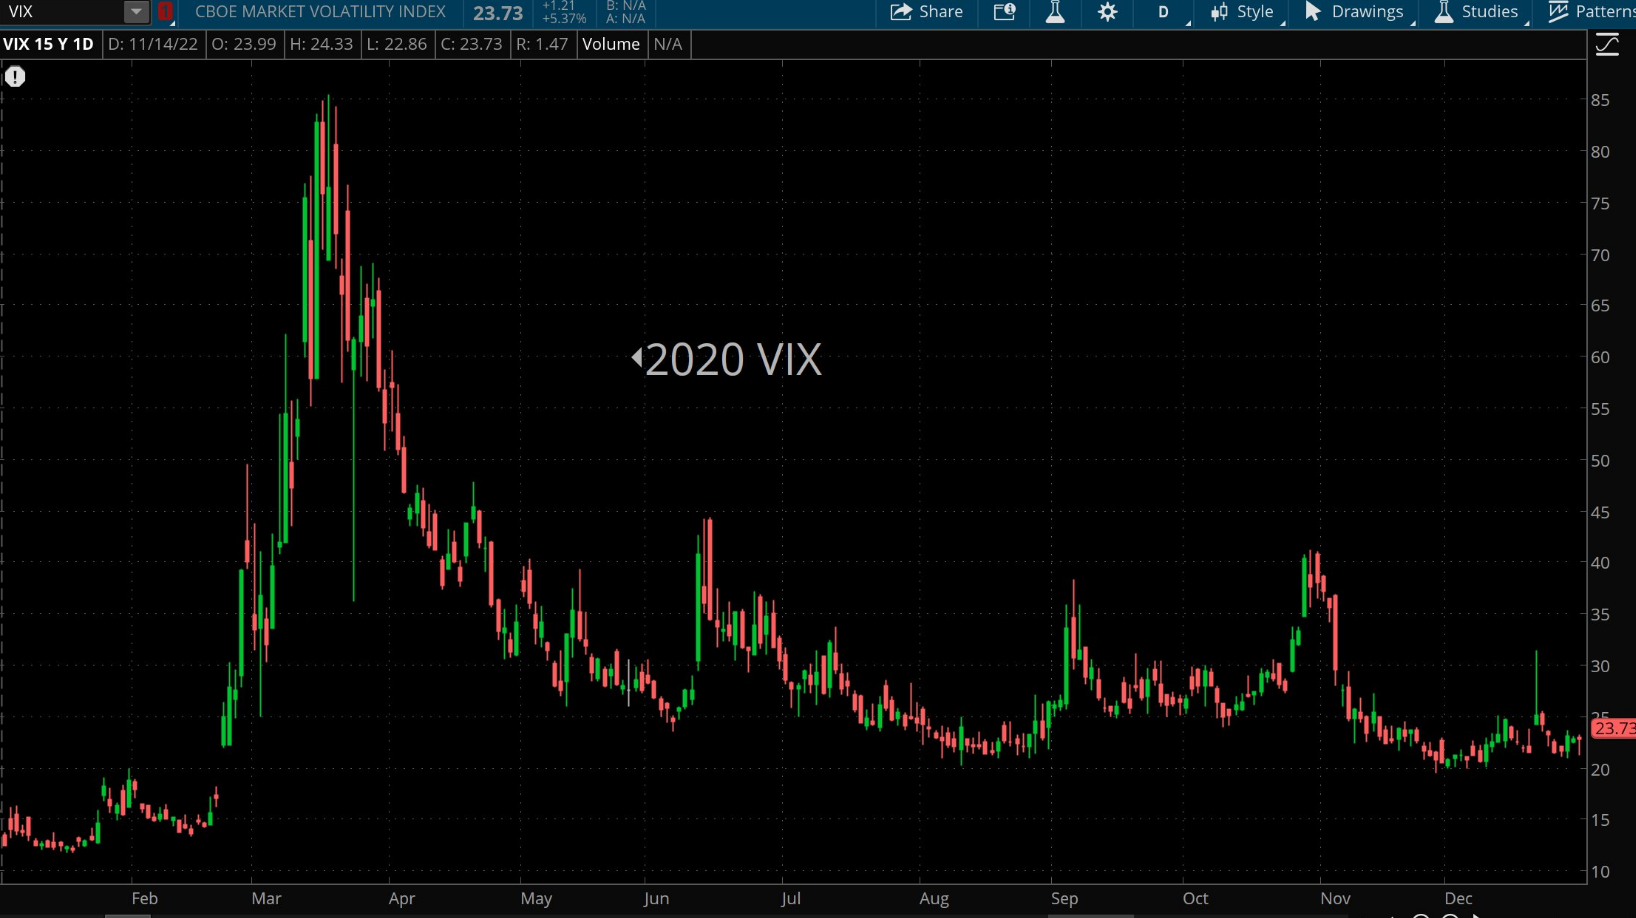
2020 UVXY falling below $120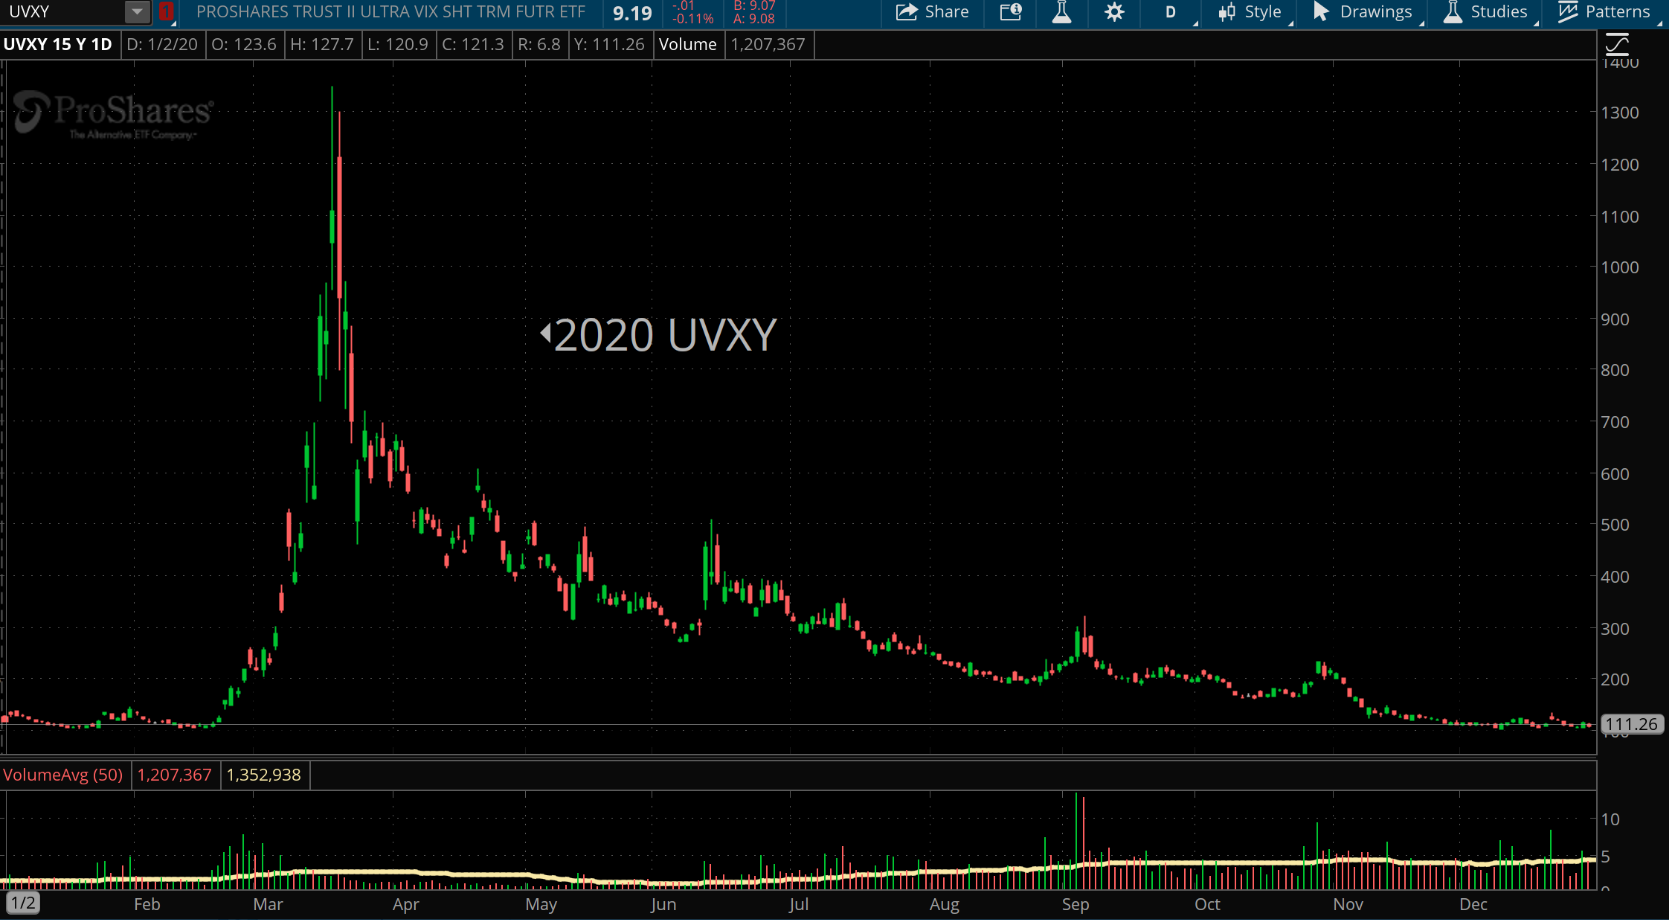
High Vol enviroments, short-vol, even if timing is perfectly barely match returns of shorting vol. The things to keep in mind when trading vol.
If you would like more in-depth analysis, subscribe to AD Derivatives Newsletter & launch our app to utilize our tools for your trading strategies!

