Share this blog:

USA Week Ahead:
-
Wednesday 8:15am ET - ADP
-
Wednesday 2pm ET - FOMC Rate Decision
-
Friday 8:30am ET- NFP
Disclaimer: Nothing here is trading advice or solicitation. This is for educational purposes only.
Authors have holdings in BTC, ETH, and Lyra and may change their holdings anytime.
![]()
CRYPTO OPTIONS MACRO THEMES:
This upcoming week will have a flurry of macro data points.
After that, the following week will be very quiet in terms of data.
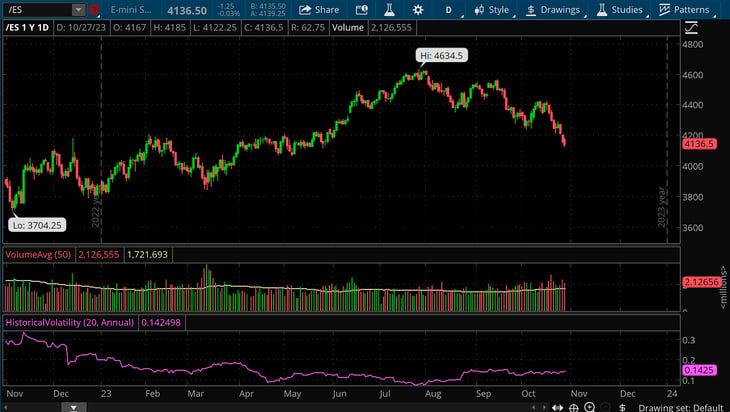
It seems that the war in the Middle East has continued to create some volatility, which was accented by a higher than expected GDP print last week.
Together, we’re seeing bonds continue to lose value, dragging stocks lower along with them.
VIX closed at 21% while 10-day realized volatility is around 14%.
Chart: (VIX Daily Chart 1-yr)
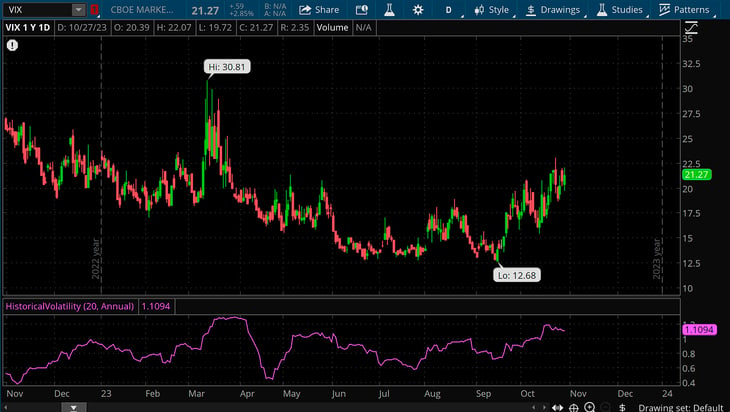
Chart: (/ZB bond futures Daily Chart 1-yr)
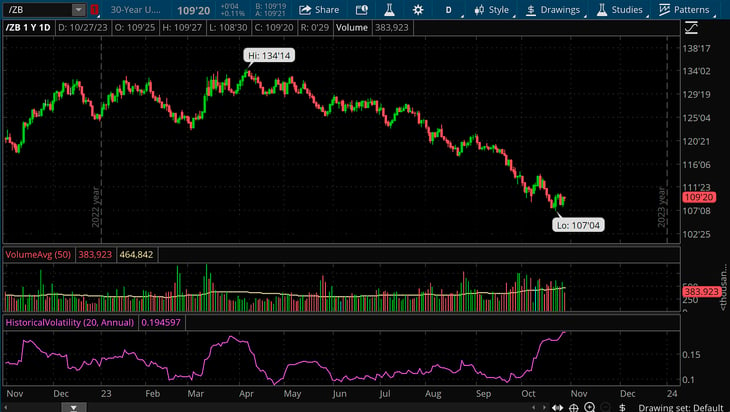
Chart: (S&P futures Daily Chart 1-yr)
PCE data last week was encouraging in terms of lower inflation.
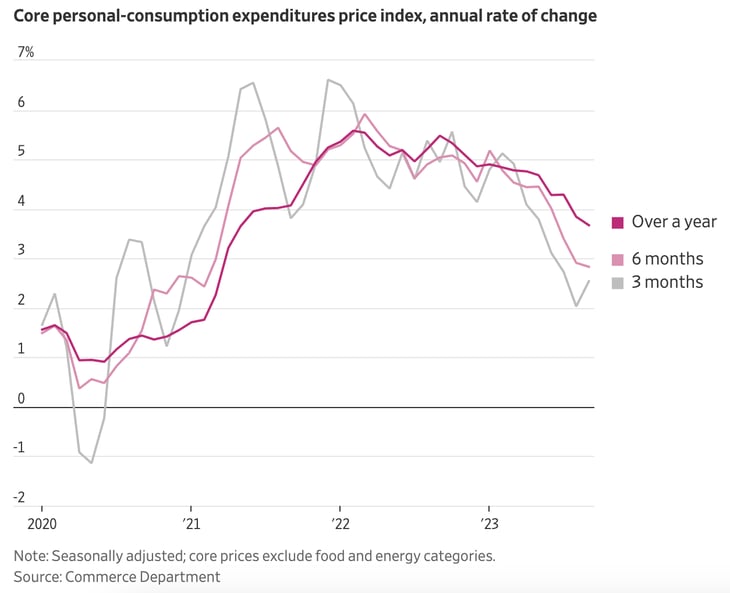
(WSJ)
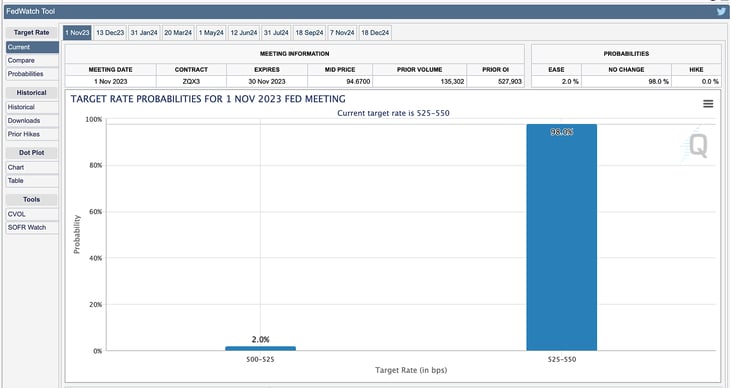
Altogether this means the FOMC event this week is certainly not going to involve a rate-hike.
Guidance wording around bond yields organically moving higher are likely going to have a dovish ring to it as well.
This could set the market up for a nice “relief rally” in stocks and lower implied volatility, post FOMC and NFP.
Chart: (CME Fed Watch Tool)
The Middle Eastern war is the main “wild card” I currently see. Should conflict cause oil prices to move substantially higher, that would be inflationary. Should the US government continue to be more financially involved, that would likely affect long term bond rates.
Together, that would create volatility and hurt risk assets, in my opinion. An outstanding risk to the “relief rally” thesis and narrative.
Outside of the US, we’re waiting for a BOJ YCC potential tweak on Tuesday 3am UTC time.

BTC: $34,775 (+13.1% / 7-day)
ETH :$1,824 (+8.4% / 7-day)
Bitcoin is where all the volatility trading action is currently found.
The term structure for BTC options currently resides above the 75% percentile YTD and is, therefore, elevated across the board.
Chart: (BTC ATM IV Term Structure vs YTD range)
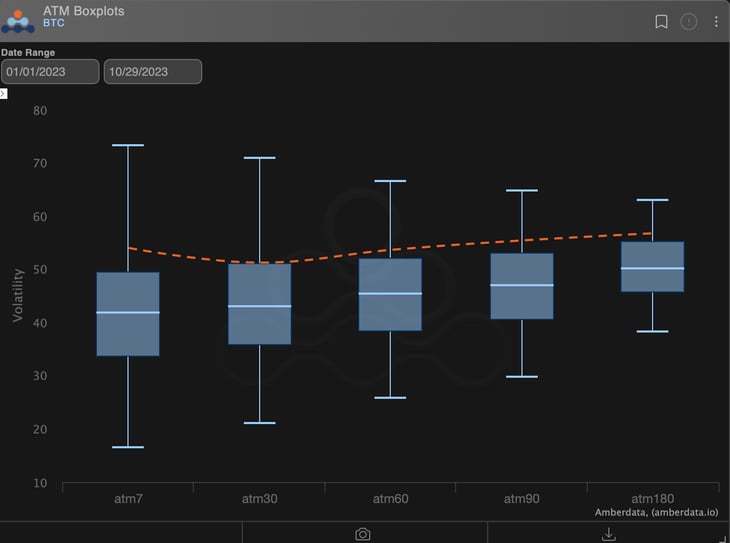
Chart: (4-yrs of Term Structure Richness)
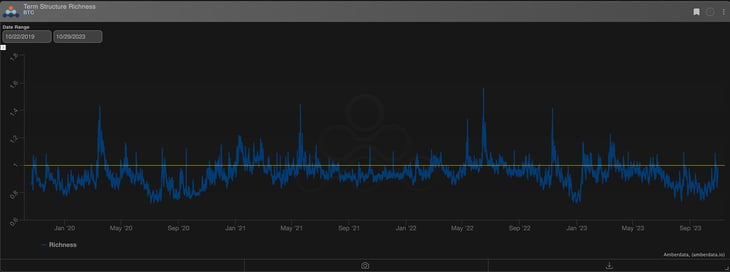
Looking at the current term structure, we rarely hang out at this flat level very long, especially due to a positive spot/vol rally.
Should the BTC rally fail to follow through to, say, $40k in a relatively quick fashion, I’d expect implied volatility to “relax” a bit here and flip the term structure back into contango.
Chart: (BTC GEX as of 10/29 midnight UTC)
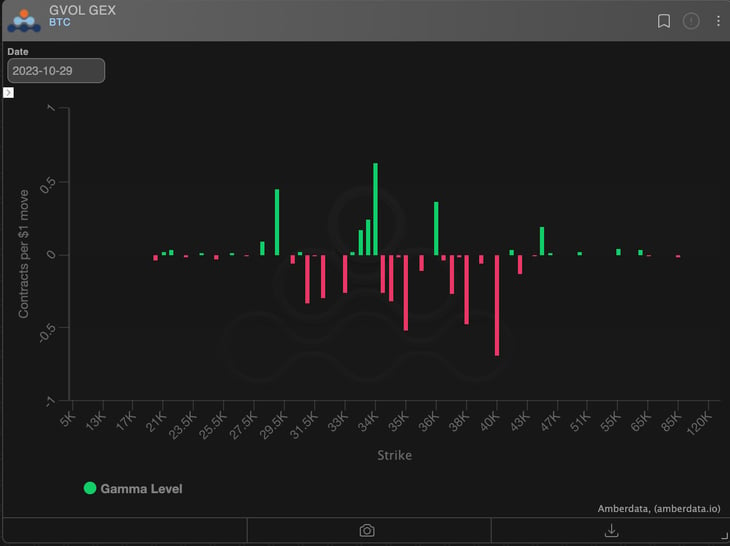
Dealers would love a bit of a BTC rally “pause” as they are very exposed to the upside strikes right now while owning optionality on the ATM Put side.
Historically, we have consistently seen 2 phenomena in BTC trading.
-
Traders will often FOMO into futures/perps/options, causing massive basis trading opportunities and vol/skew opportunities.
-
BTC can exhibit violent upside spot moves, like no one’s business.
Given a bit of an upside delta bias, but unwilling to buy the “top” of BTC vol and skew, I think there’s a few interesting structures.
Chart: (BTC YTD ∆25 RR-Skew)
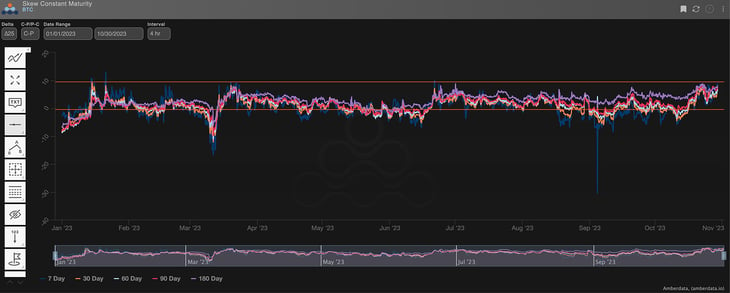
Chart: (BTC 30DTE ∆25 IV vs ATM IV)
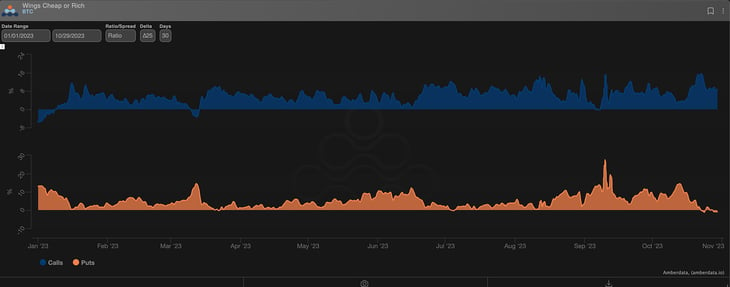
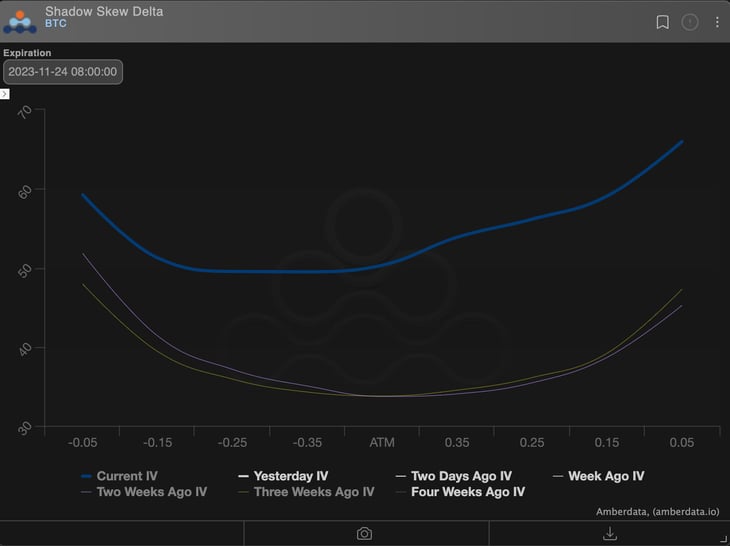
Chart: (11/24 NOV Expiration in Delta Space)
Doing the delta hedged ∆25d RR-Skew trade (Long the Put, short the Call, long the spot/perp/fut) is interesting here.
The current ∆25 put skew is flat against ATM IV, while the ∆25 Call is very high versus ATM IV.
Both of these relationships are at YTD extremes, while IV overall is relative high YTD.
This makes this structure interesting to me.

PROPRIETARY “GVOL-DIRECTION” FLOWS - @Gravity5ucks
The week has been dominated by two types of trade: profit-taking and closing of shorts went bad.
The impact of these flows is clearly evident when looking at the historical premium, reaching its relative all-time highs.
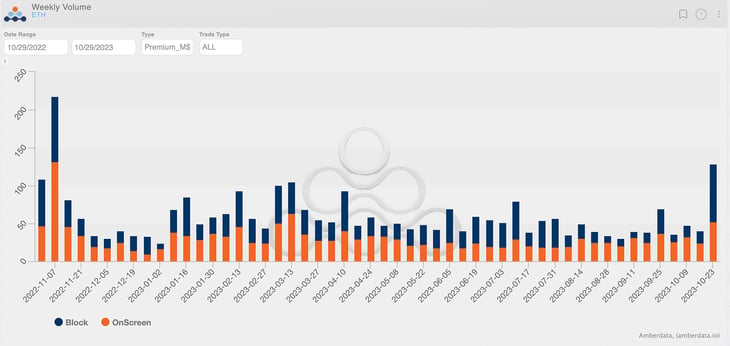
Bitcoin “quadrupling" Ethereum.
Chart: (BTC Weekly Volumes)
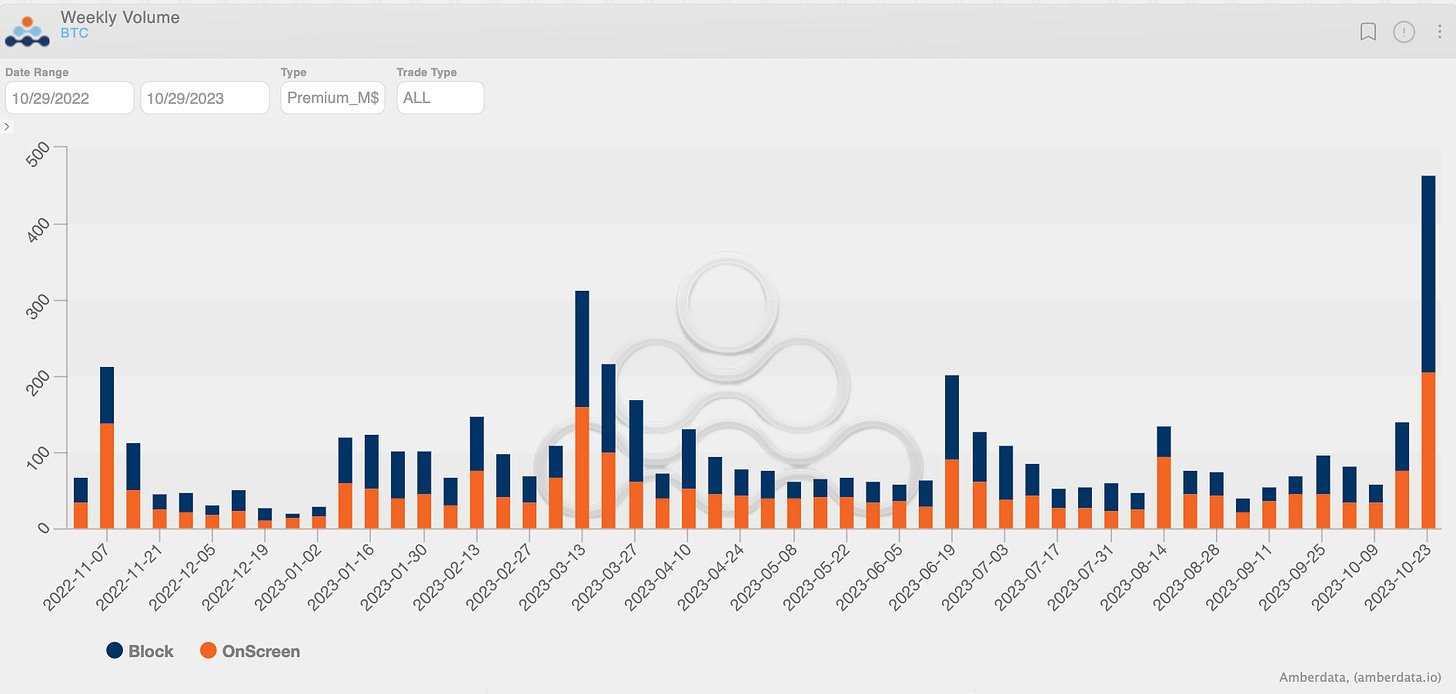
Chart: (ETH Weekly Volumes)
In weeks like this, it is crucial to distinguish between trades that have closed previous positions and new trades that have been opened.
The general sentiment indicates a continuation of the spot movement, with a partial renewal of positions following massive profit-taking.
Chart: (BTC Top trades)
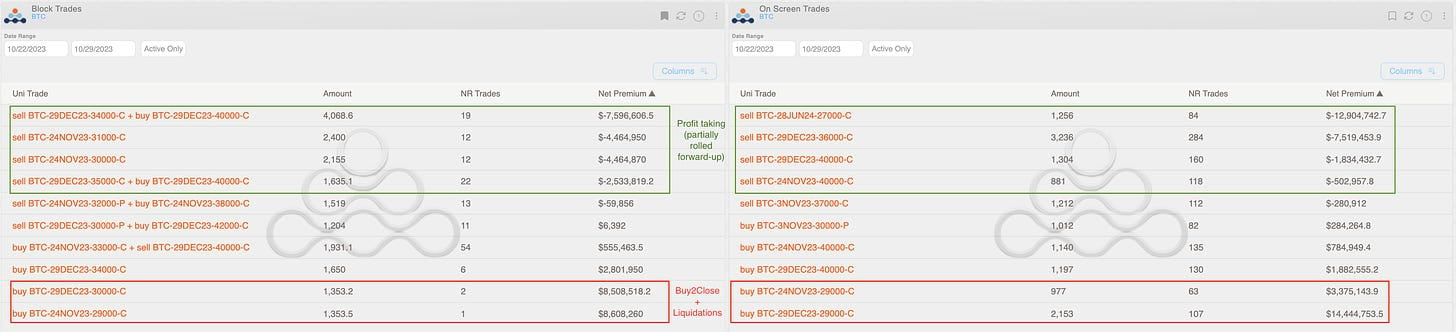
In addition to the rolled-up-forward trades (December at $40k), among the noteworthy new trades, we highlight the long risk reversals in November (-$32k put +$38k call) and December (-$30k put +$42k call).
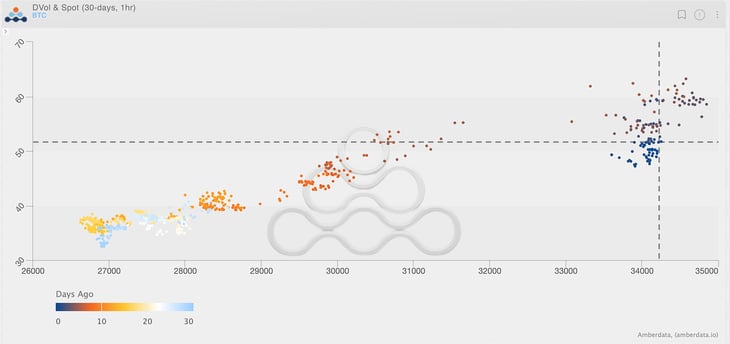
These structures are suitable in a regime of positive spot/volatility, with BTC spot-volatility correlation reaching all-time highs since 2020.
Chart: (BTC Spot/Vol Correlation)
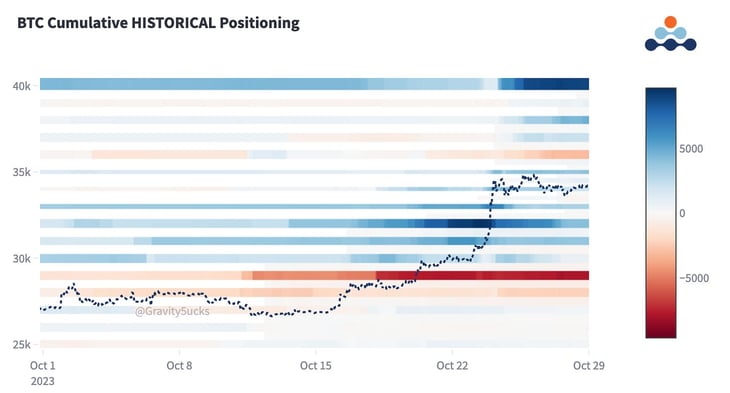
It will be interesting to observe the flow in the coming days to understand how traders will reposition themselves. To date, the most impacted level has been $40k.
Chart: (BTC Traders Positioning)

Paradigm's Week In Review
What a week!
Paradigm volumes reach new all-time highs 🔥
Strong positive spot-vol correlation creates excitement in options 📈
Profit taking in droves 💰
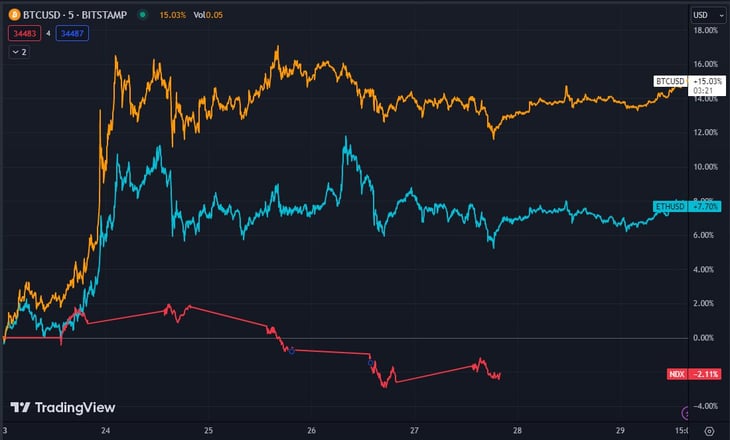
BTC +15.1% / ETH +7.7% / NDX -2.1%
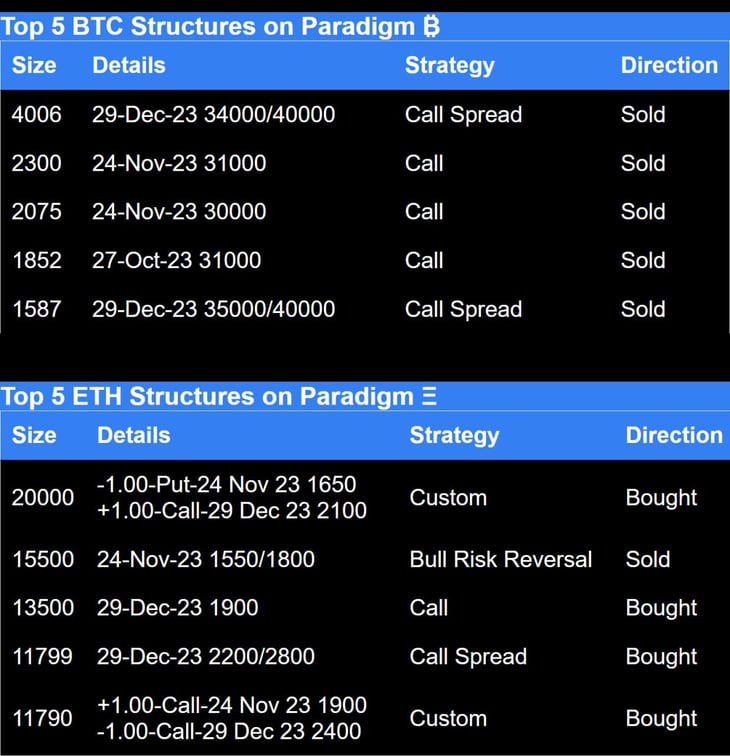
Paradigm Top Trades this Week
Taking profit on ITM calls and rolling strikes up via selling call spreads was the theme of the week.
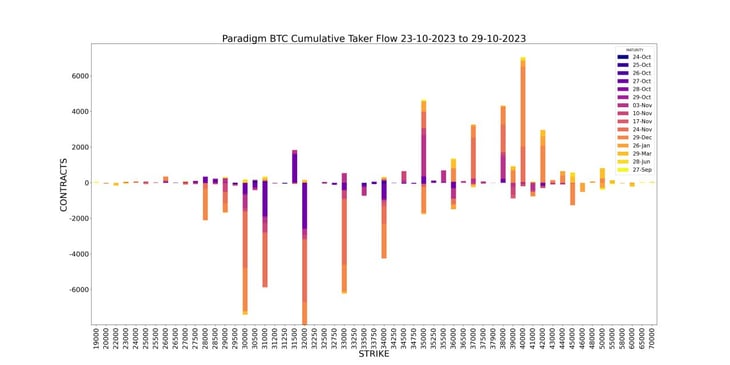
Weekly BTC Cumulative Taker Flow 🌊
Weekly ETH Cumulative Taker Flow 🌊

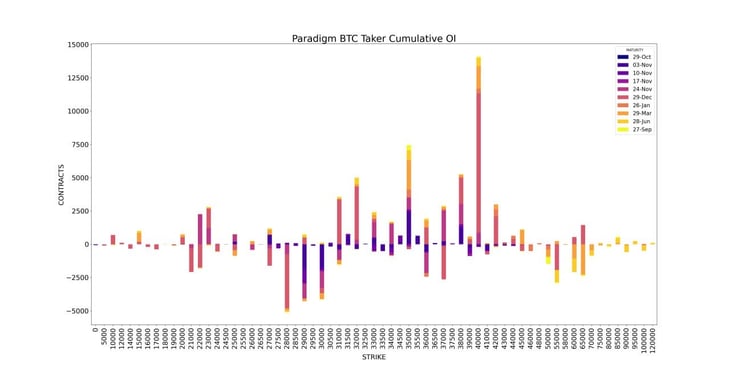
BTC Cumulative OI
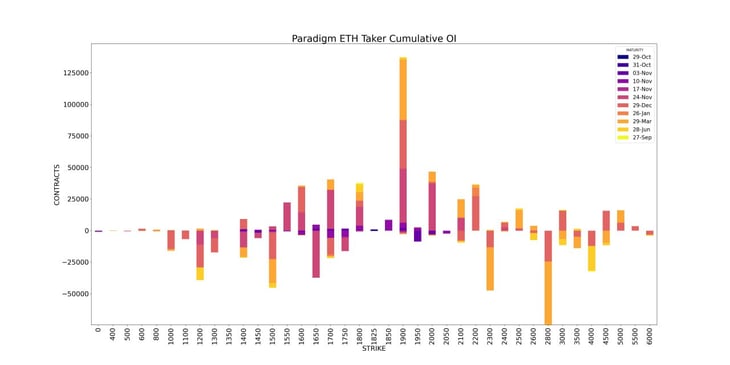
ETH Cumulative OI
Paradigm volumes set a new all-time high 🚀
Paradigm x Bybit Podcast - Bybit's TradeGPT is a GameChanger for Traders
Check it out 👇
Paradigm x Signal plus partnership.
Seamlessly access deep block liquidity and trade options exchange order books all in one place 🫡
Get started here👉 https://t.co/m5bKQarTCf
As always, you can hit us up from the below:
Hit us up on Telegram! 🙏
Paradigm Edge: Daily Commentary✍️ http://pdgm.co/edge
24/7 Support: http://pdgm.co/tgsupport
Sign up now! 👉 https://pdgm.co/3BLEw1Y
Bybit x Paradigm Futures Spread Trade Tape:
https://t.me/paradigm_bybit_fspd
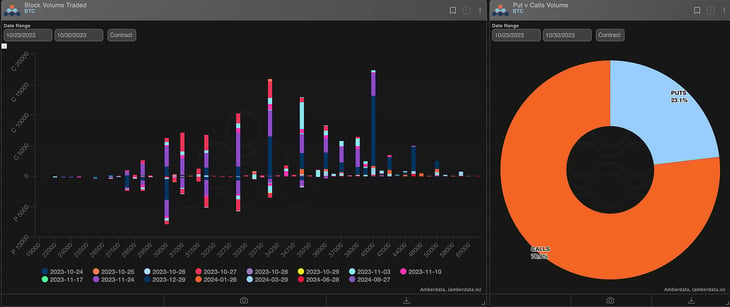
BTC
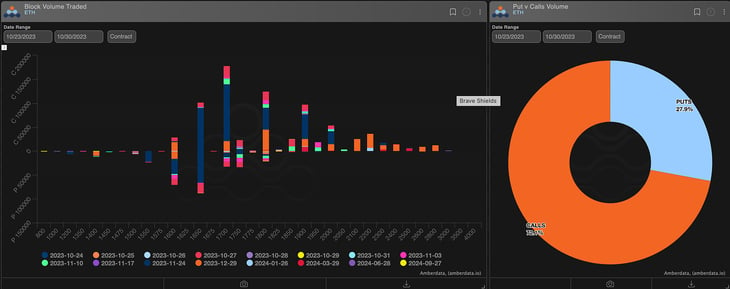
ETH

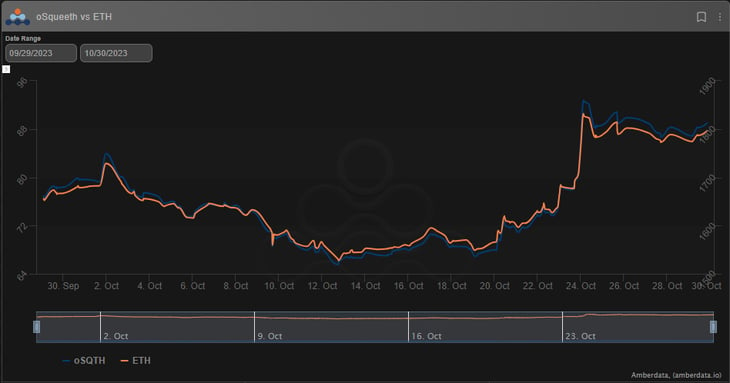
The Squeethcosystem Report
Crypto markets found their way lower throughout the week. ETH ended the week +10.38%, oSQTH ended the week +20.96%.
Volatility
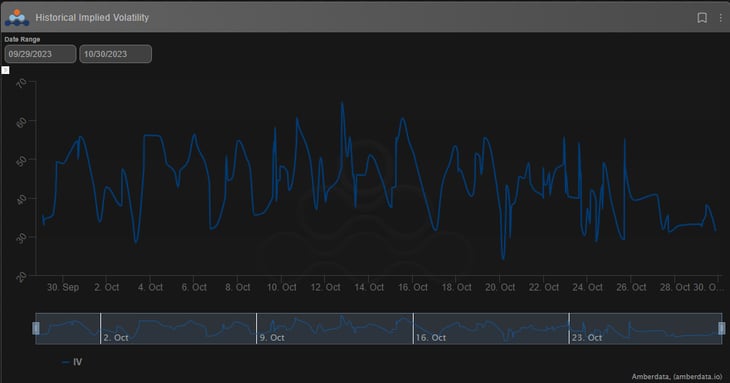
oSQTH IV continued to trade in a large range from the mid 20s - mid 50s.
Volume
The 7-day total volume for oSQTH via Uniswap oSQTH/ETH pool was $394.67k
October 20th saw the most volume, with a daily total of $128.45k traded.
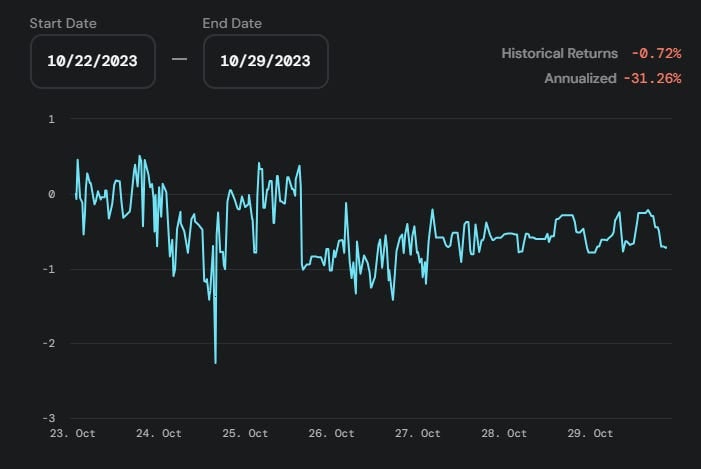
Crab Strategy
Crab saw declines during the week ending at -0.72% in USDC terms.
Twitter: https://twitter.com/opyn
Discord: discord.gg/opyn
AMBERDATA DISCLAIMER: The information provided in this research is for educational purposes only and is not investment or financial advice. Please do your own research before making any investment decisions. None of the information in this report constitutes, or should be relied on as a suggestion, offer, or other solicitation to engage in, or refrain from engaging, in any purchase, sale, or any other investment-related activity. Cryptocurrency investments are volatile and high risk in nature. Don't invest more than what you can afford to lose.
