Share this blog:

USA Week Ahead:
-
Tuesday 8:30am ET - CPI
-
Wednesday 8:30am ET - PPI
-
Wednesday 2p ET - FOMC
-
Thursday 8:30am ET - Jobless Claims & Retail Sales
-
Friday 8:30am ET - Empire State Manufacturing
Disclaimer: Nothing here is trading advice or solicitation. This is for educational purposes only.
Authors have holdings in BTC, ETH, and Lyra and may change their holdings anytime.
![]()
CRYPTO OPTIONS MACRO THEMES:
Last week we saw some major volatility in traditional asset classes.
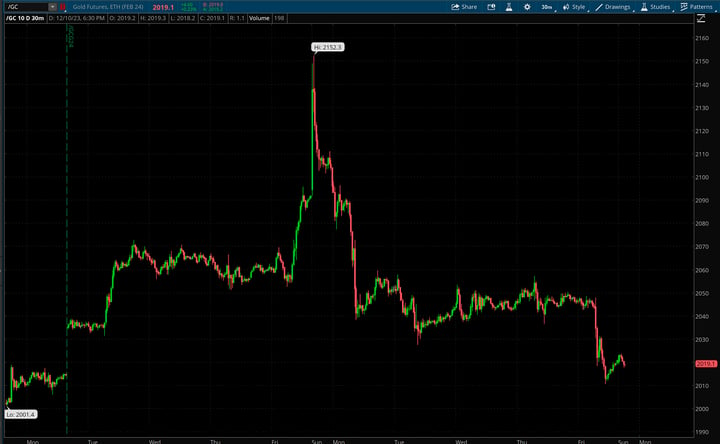
Gold, an asset with around 15% annualized volatility, saw a Sunday night open with a 5% price range last week.
Chart: (Gold 1hr - ThinkOrSwim)
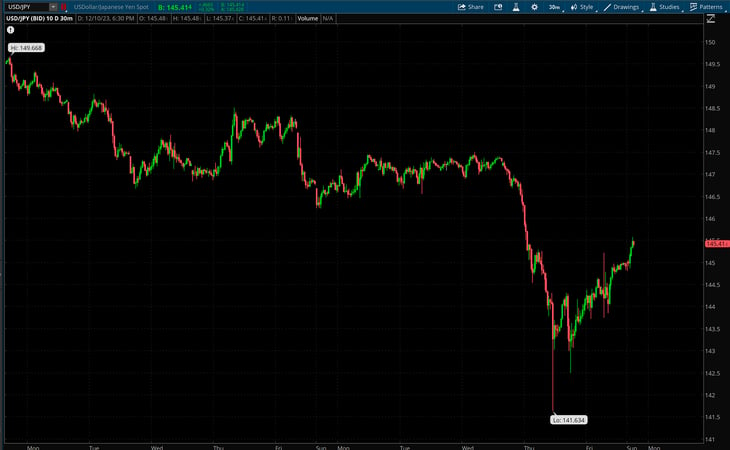
Then Thursday USD/JPY saw about a 4% daily range. This is an asset class with the currently high implied vol. of 10%.
Chart: (USD/JPY 1hr - ThinkOrSwim)
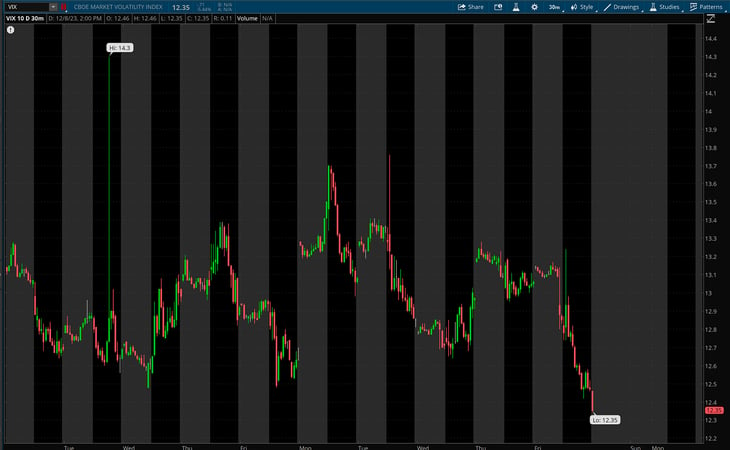
Needless to say, these moves are massive for both assets. What’s interesting is that the impact was nearly non-existent for equity volatility. VIX continues to remain weak and head lower.
Chart: (VIX 1hr - ThinkOrSwim)
Finally, Friday we saw the unemployment rate come in at 3.7% (vs 3.9% expected).
Again, not enough to move equity volatility.
This upcoming week we will have CPI and FOMC rate decision. The current appetite for duration seems strong and I’d expect rates to resume their move lower into the EOY, as funds rebalance their duration exposure.
Assuming that’s right, lower rates are bullish for equities and bearish for equity volatility.

BTC: $43,382(+7.8% / 7-day)
ETH :$2,328 (+5.3% / 7-day)
The massive rally in BTC this week had a counter-intuitive affect on the volatility surface week-over-week.
Despite BTC rallying from sub-40k to $44k, we can see that the EOY volatility skew has relaxed a lot.
Chart: (Dec 29th BTC option skew, delta space)
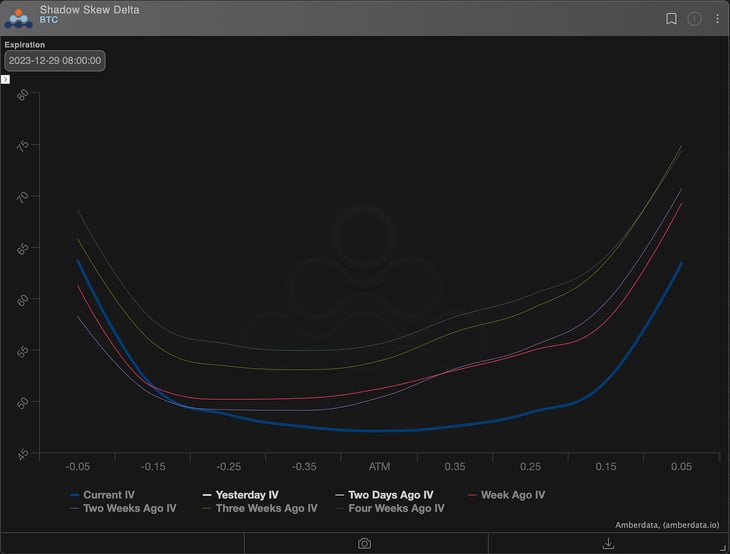
Notice that the current EOY skew (blue) saw a parallel shift lower in volatility vs 3-weeks ago (yellow) and a call-wing tilt down vs 1-week ago (red).
It’s interesting to see option traders begin to price a slow down in the upside spot momentum.
Chart: (Deal Gamma inventory)
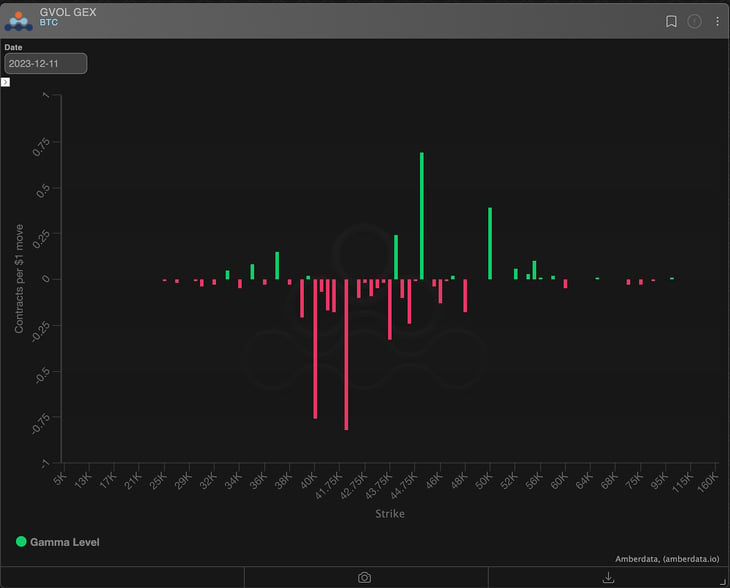
Dealer inventory is very short between 39k-45k, but about flat from 45k-50k.
Clearly a lot of traders used call-spreads for long positioning and sold 45k and 50k for the short leg of the spread.
But the appetite for optionality above $45k is nearly non-existent.
Chart: (Term Structure Richness BTC)
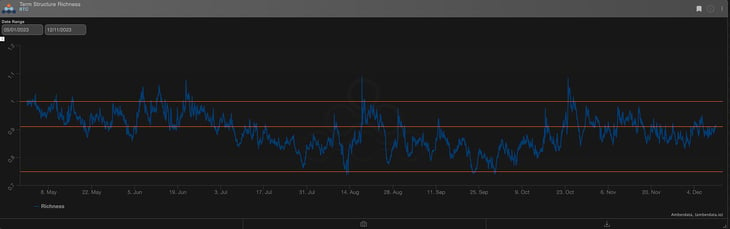
The term structure remains relatively rich. The relaxation of the EOY skew hasn’t translated in a drop in the implied volatility term structure.
The front-end has room to run lower, should things calm down.
Getting above 1.00 has been very short-lived recently and I would discount the probability of that happening into the EOY.

PROPRIETARY “GVOL-DIRECTION” FLOWS - @Gravity5ucks

The week started with the spot below $40k, and in two days, it reached $41.5k (Monday) and then $44k (Tuesday), remaining unchanged for the rest of the week.
This price action led to distinct phases of options flow:
-
Take profit
The strikes of ITM contracts added spice to the positions, prompting quick profit-taking (in hindsight, “too quick” given the remaining optionality and the ongoing spot movement).
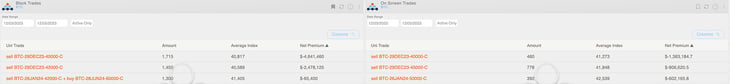
Notable among the rollovers is the buy of $60k calls for June.
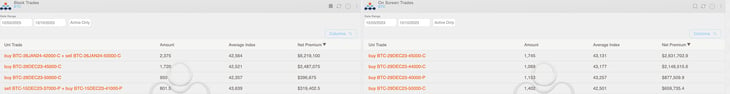
Chart: (BTC Weekly Top Trades)
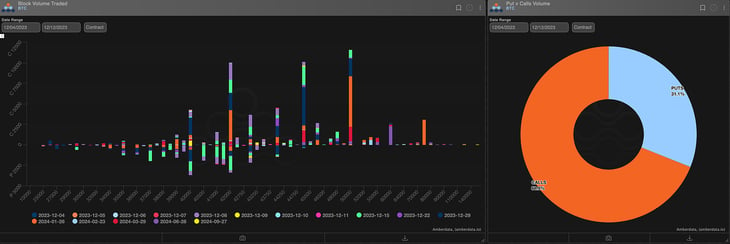
In weeks of profit-taking, I like to look at trading volume in terms of premium transacted:
Chart: (BTC Weekly Trades)
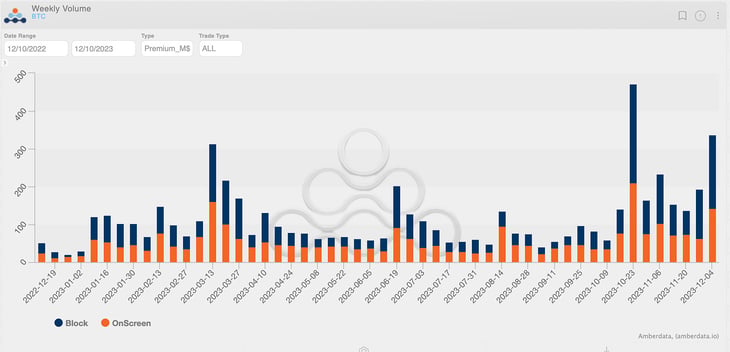
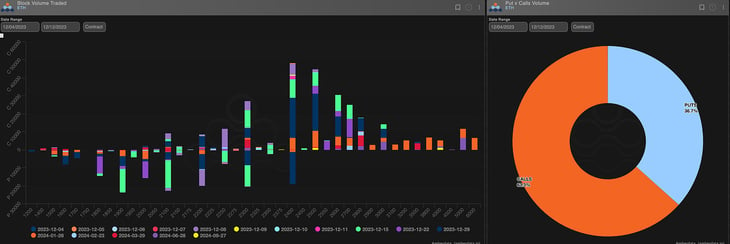
Chart: (ETH Weekly Trades)
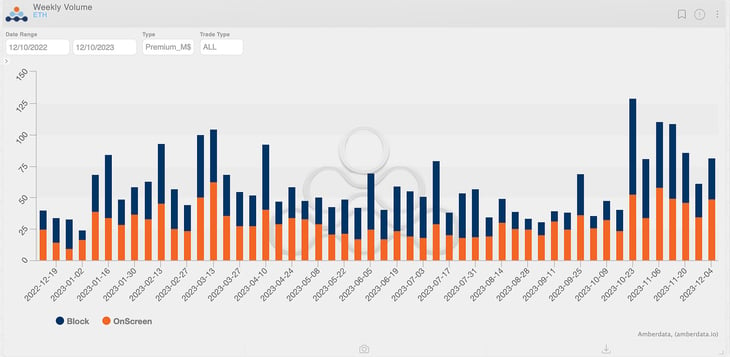
The impact of this type of flow in Bitcoin compared to total volumes, and in relative terms towards ETH, is quite evident.
It explains much of the divergent positioning of traders between the two coins, resulting in... quadrupling!
-
Reorg
After the profit-taking hangover subsided, new positions in continuation of the bullish movement were opened: long naked calls and a call spread with over $6 million in premium.
Chart: (BTC Weekly Top Trades)
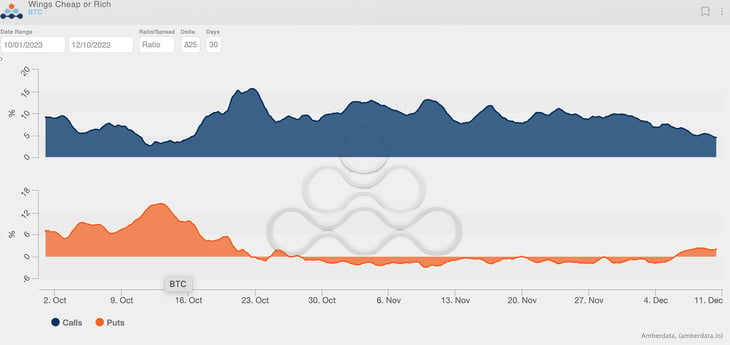
However, the uncertainty that the bullish momentum might have lost some strength prompted the opening of some put positions.
While not very pronounced, the impact on the 30-day put skew (relative to ATM) was felt, with values reaching highs not seen since October.
Chart: (BTC Wings cheap or rich)
-
Short vol
The $44k spot level seems to act as a magnet for the year-end. The massive straddle sold in December at the same strike has accumulated almost $90k in sold Vega.
Chart: (BTC Vega Heatmap)
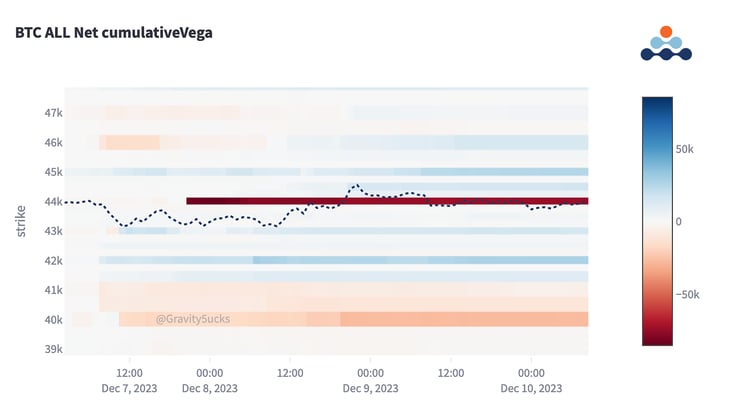
Being short-gamma until the end of the year and long vega on January remains my favorite trade.
For now, the January IV is disappointing. I share some hypotheses on why in this tweet:
As I mentioned a few weeks ago, during the Christmas holidays, it's better to be onscreen.

Paradigm's Week In Review
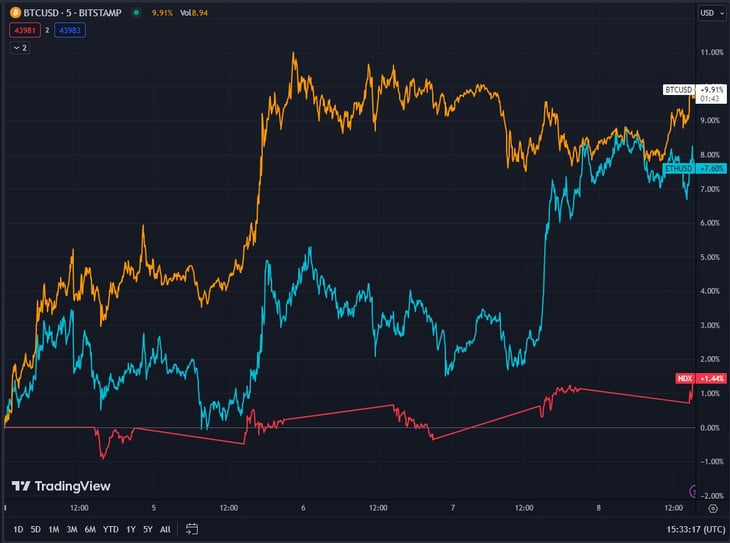
Risk on week in Crypto and Macro
BTC +9.9% / ETH +7.6% / NDX +1.4%
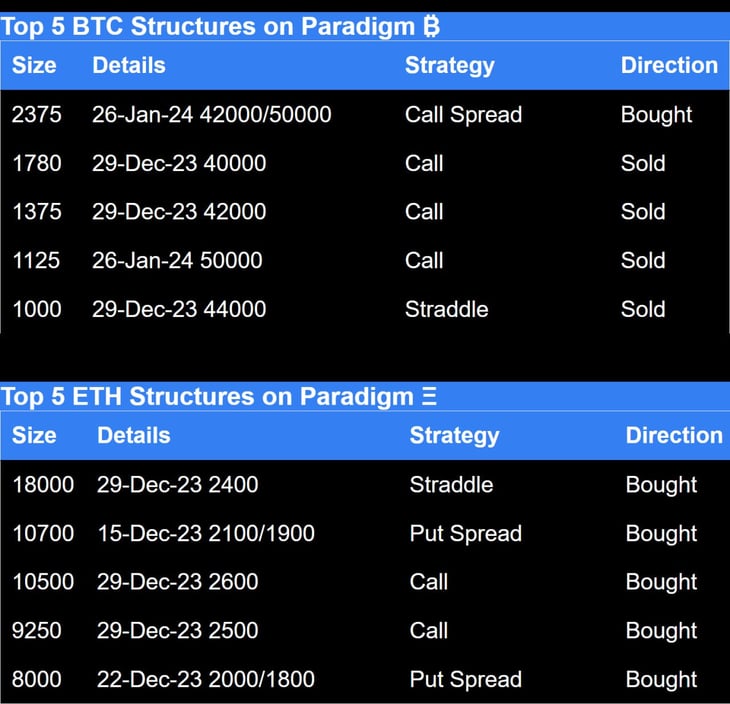
Paradigm Top Trades this Week 👇
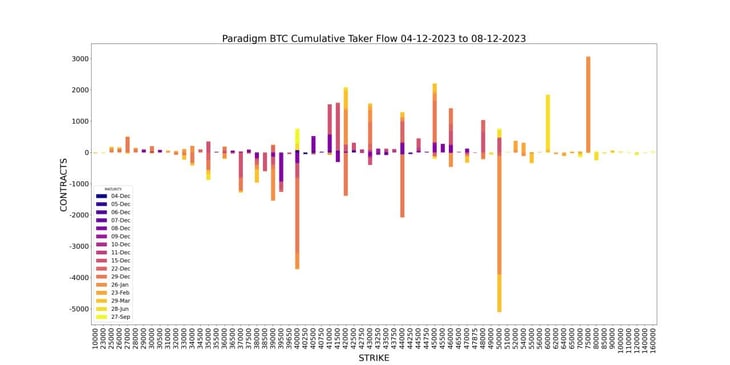
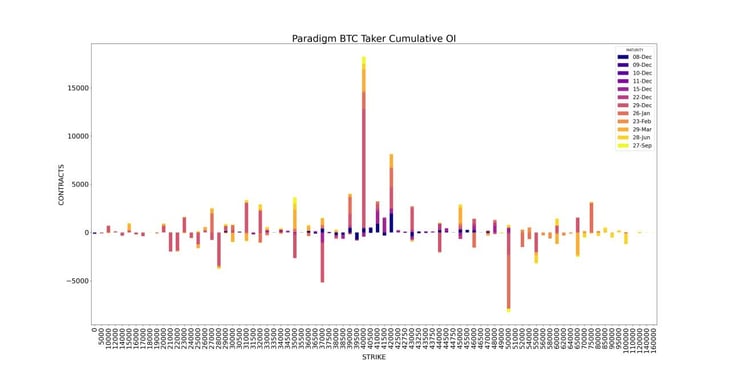
Weekly BTC Cumulative Taker Flow 🌊
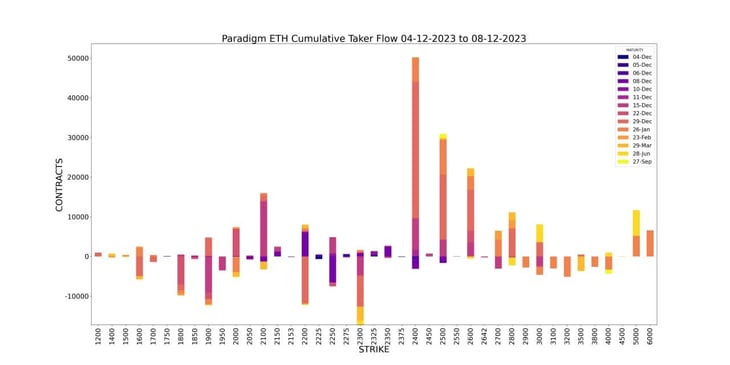
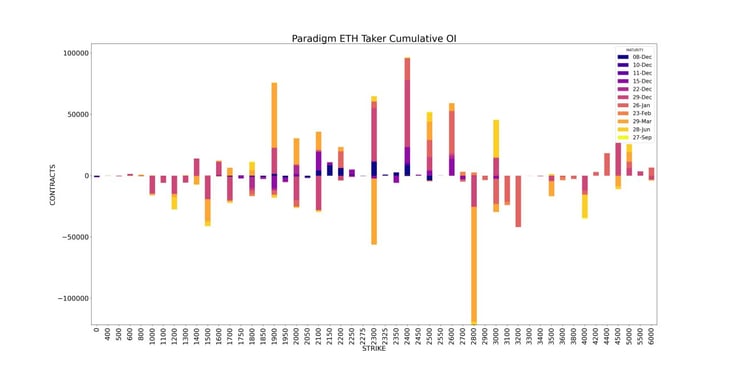
Weekly ETH Cumulative Taker Flow 🌊
BTC Cumulative OI
ETH Cumulative OI
We are pioneers in the @Starknet ecosystem 👇
🥇 First to pilot 20 Million Cairo Steps / Block on Mainnet
🥇 First to Quantum Leap (New Rust Sequencer)
🥇 First App Chain on Starknet
As always you can hit them up below:
Hit us up on Telegram! 🙏
Paradigm Edge: Daily Commentary ✍️ http://pdgm.co/edge
24/7 Support: http://pdgm.co/tgsupport
Sign up now! 👉 https://pdgm.co/3BLEw1Y
BTC
ETH

The Squeethcosystem Report
Crypto markets found their way higher throughout the week. ETH ended the week +8.79%, oSQTH ended the week +18.08%.
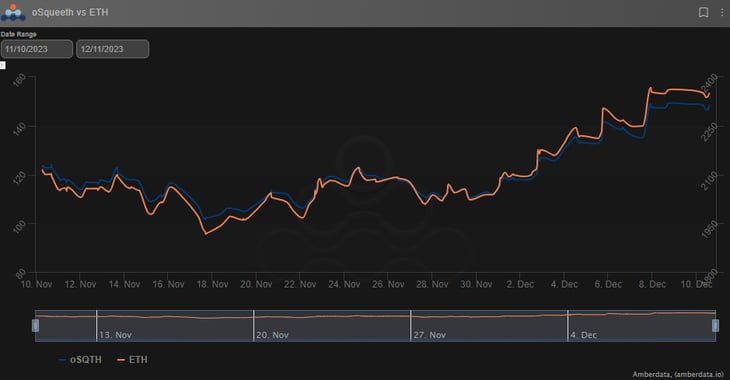
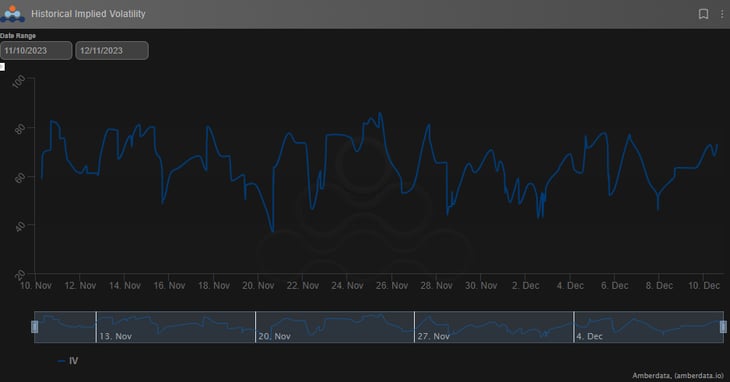
Volatility
oSQTH IV continued to remain volatile, trading in the mid 50s to the high 70s most of the week.
Volume
The 7-day total volume for oSQTH via Uniswap oSQTH/ETH pool was $448.14k
December 10th saw the most volume, with a daily total of $159.41k traded.
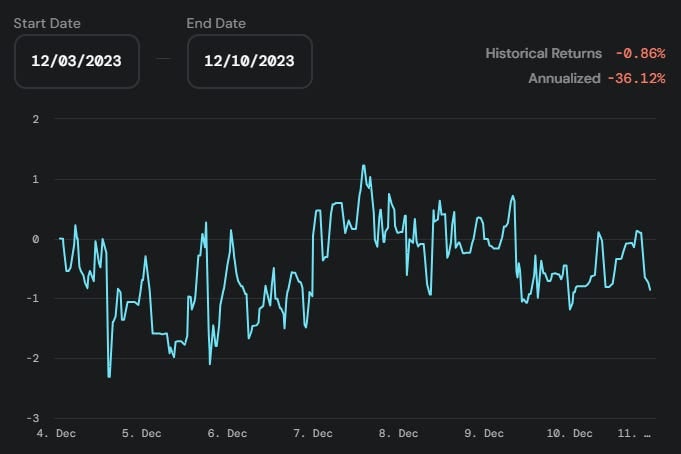
Crab Strategy
Crab saw declines during the week ending at -0.86% in USDC terms.
Opyn Twitter: https://twitter.com/opyn
Opyn Discord: discord.gg/opyn
