Share this blog:

Thailand has joined the digital asset ETF wave after approving its first spot Bitcoin ETF this week. The country’s version of the SEC gave the green light to One Asset Management (ONEAM), though the fund will be limited to institutional investors for the time being. In the United States, the US SEC’s Salt Lake City, Utah office is closing its doors – the same office behind the Debt Box lawsuit. The lawsuit alleged several charges against the crypto company though it ended in the agency filing a dismissal after a federal judge sanctioned them for “gross abuse of power”.
Spot Market
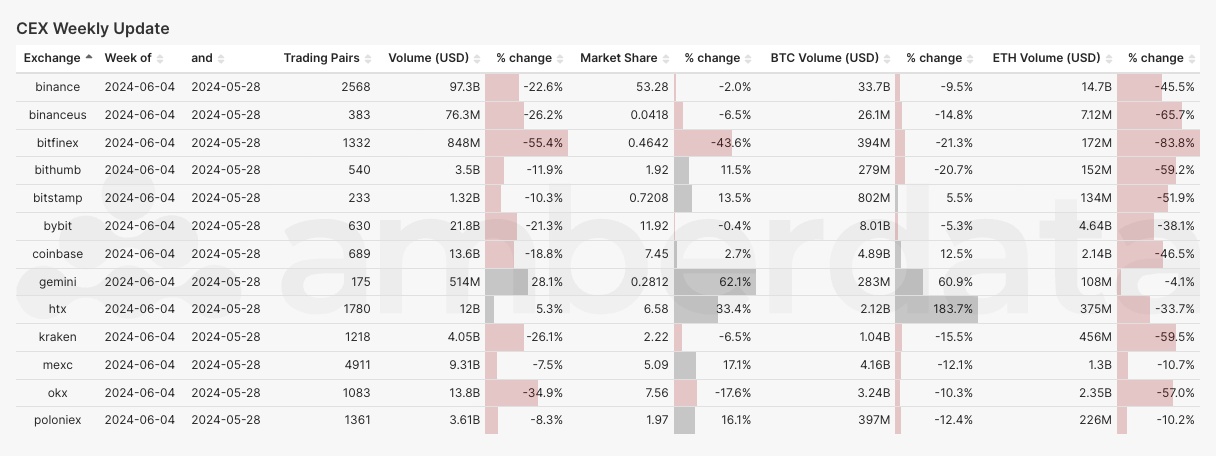
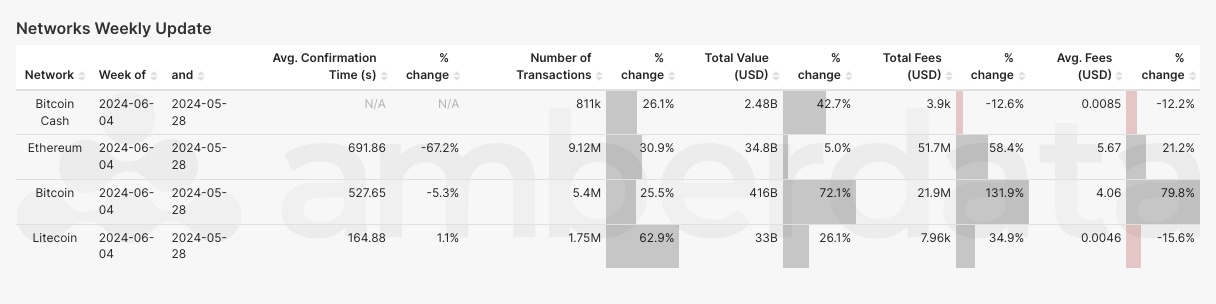
Centralized Exchange (CEX) comparisons from weeks 5/28/2024 and 6/04/2024
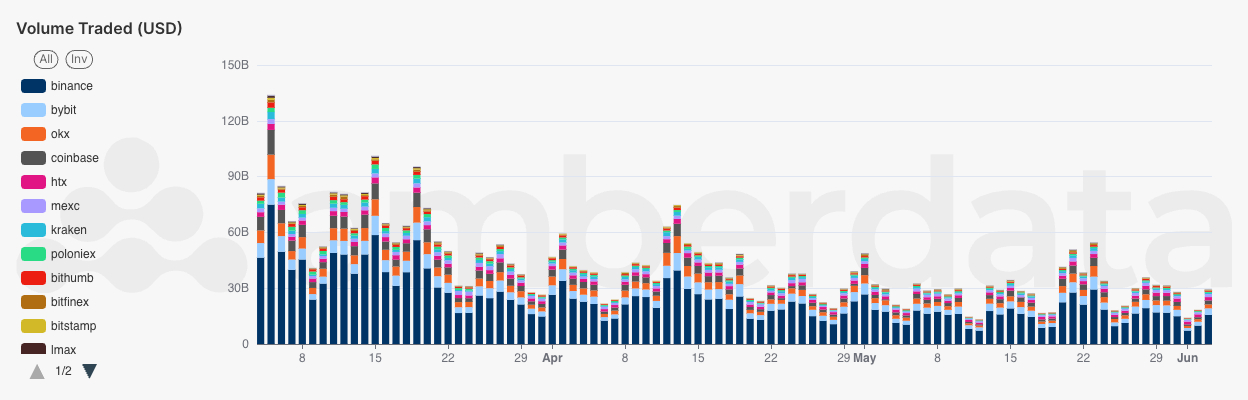
Spot trade volume by exchange since March 2024
Spot trading volume has stabilized across centralized exchanges since soaring in March earlier this year. The March boom was largely driven by memecoins, which took over Solana and Ethereum L2s. Bitcoin Ordinals and Bitcoin Runes saw a windfall of activity as well.
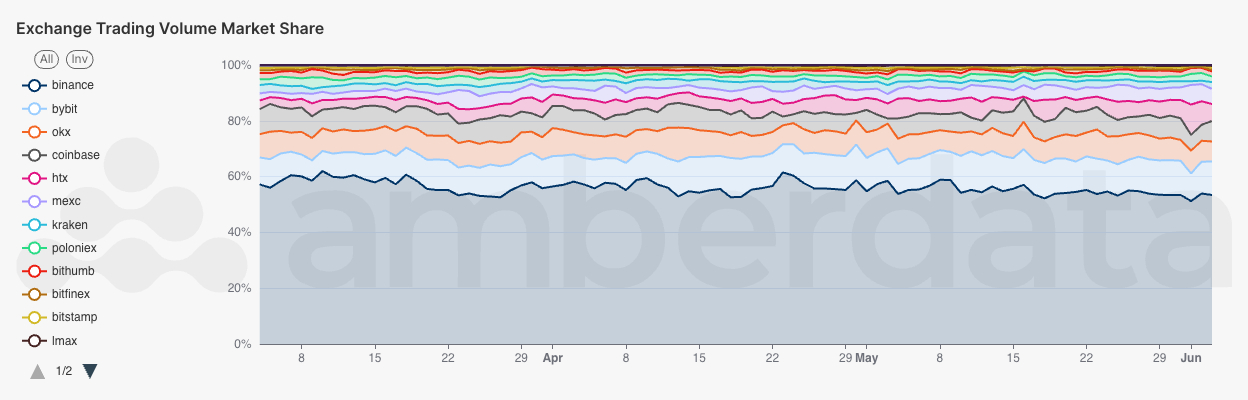
Trading volumes for USDT, USDC, and USD trading pairs across all centralized exchanges
As memecoin trading activity dropped since March highs, Binance was hit the hardest and dropped in daily trading volume market share by 4-5%. The world’s largest centralized exchange is often at the forefront of asset listings and frequently lists tokens such as memecoins before any other exchange. During the March rally, daily trading volume market share was as high as 61%.
DeFi DEXs
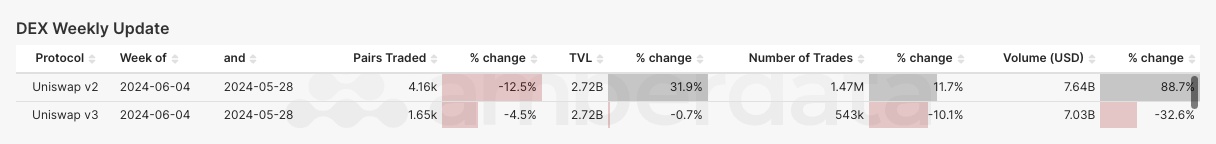
Decentralized Exchange (DEX) protocol from weeks 5/28/2024 and 6/04/2024
Uniswap v3 trading volume for top pools over the last 30 days
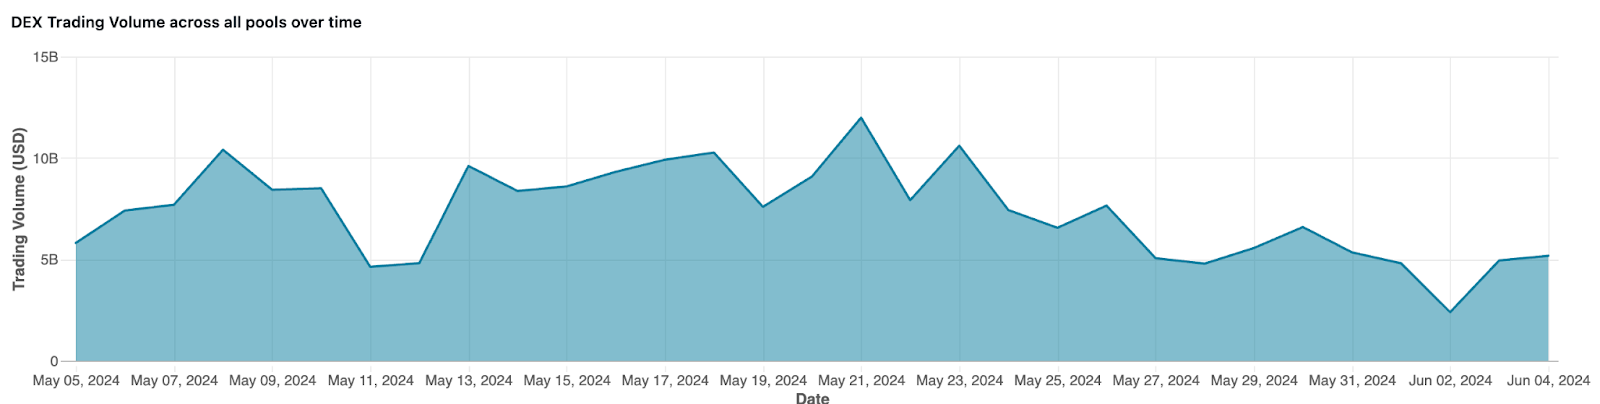
DEX trading has also settled off the backs of memecoin trading, with daily trading volumes falling well below $5 billion.
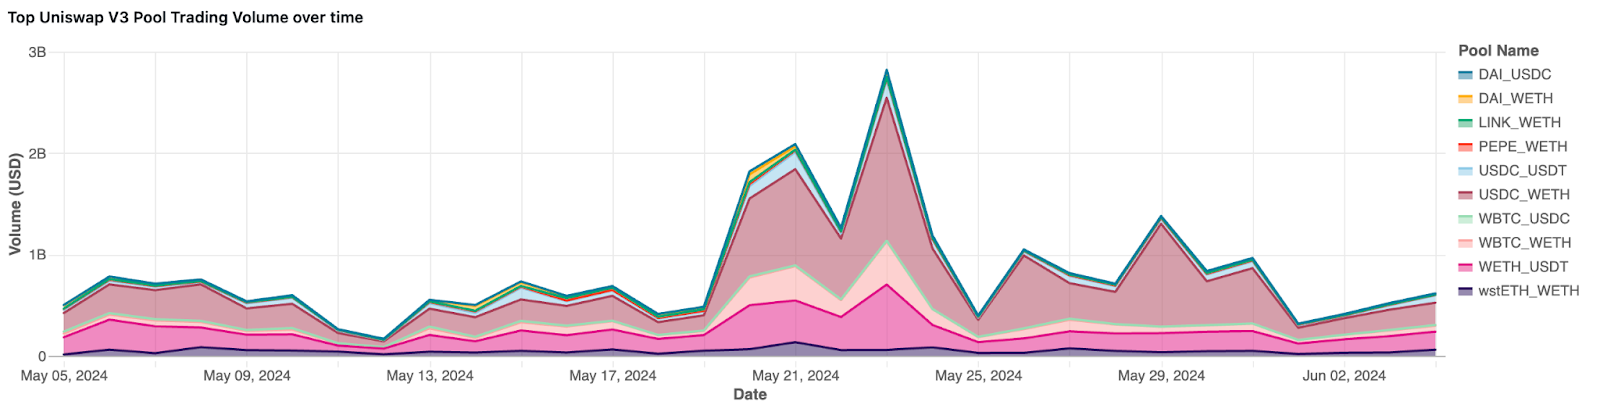
Uniswap v3 top trading pools trading volume for top pools over the last 30 days
Top trading pools this month included the usual pools USDC/WETH and WETH/USDT, but a few days in May included high volumes for WBTC/WETH. Trading volume spikes in this pool came around the same time as approvals in the US for spot Ethereum ETFs. This was likely traders moving their WBTC that had been held throughout the spot BTC approvals back into WETH on speculation that the ETFs would push underlying token prices upwards.
DeFi Borrow/Lend
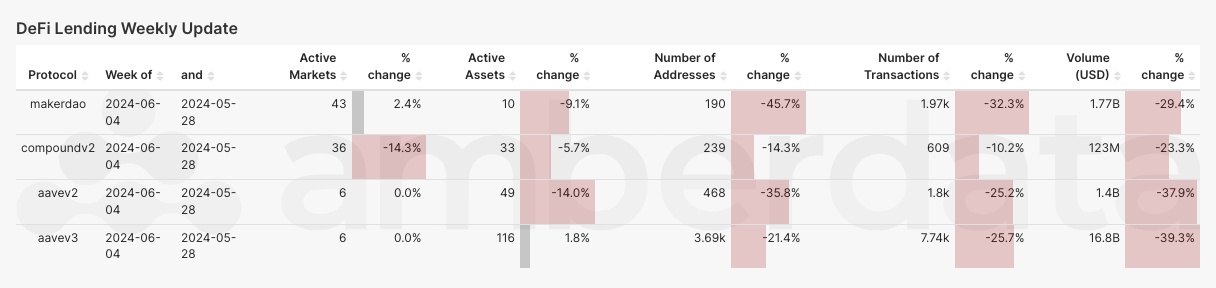
DeFi Lending protocol comparisons from weeks 5/28/2024 and 6/04/2024
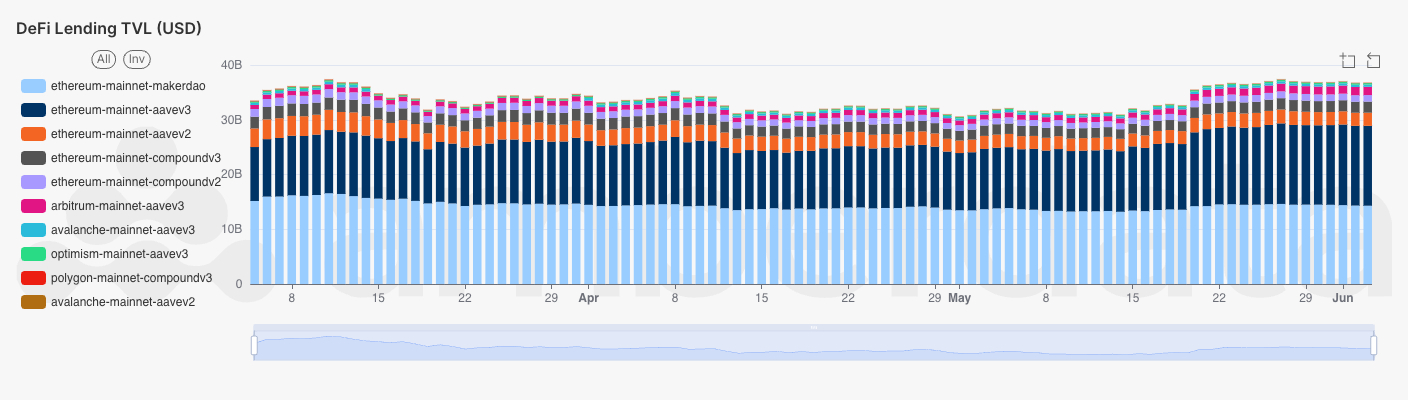
DeFi Lending protocol TVL by protocol and network
DeFi Lending TVL has been increasing over the last few weeks, probably in anticipation of Ethereum ETF approvals with depositors expecting price appreciation of underlying assets and adding collateral to future borrows.
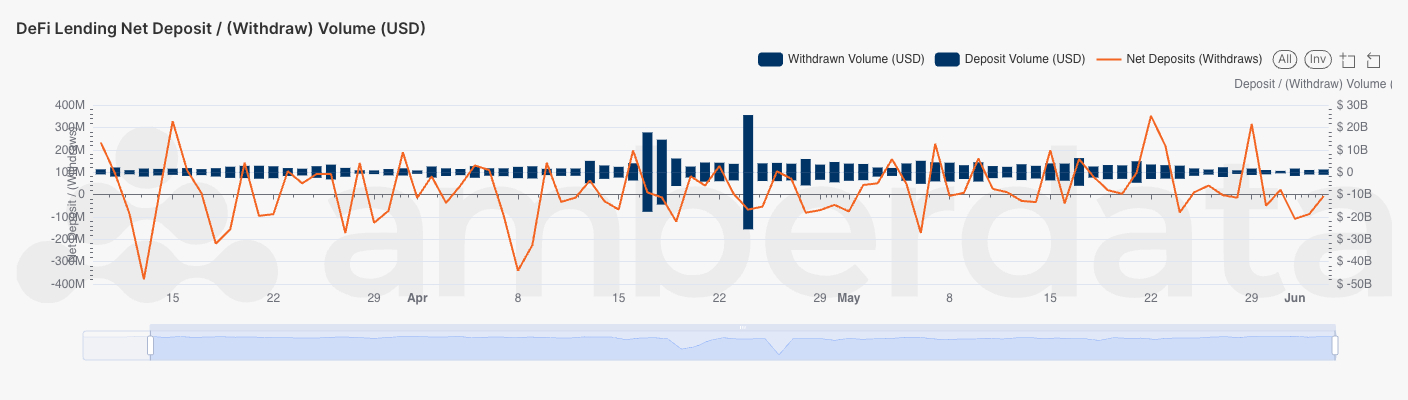
Deposit and Withdrawal volumes across DeFi Lending protocols
Interestingly, in only a few days net deposits were over $200 million. Those days saw extremely high deposit volumes.
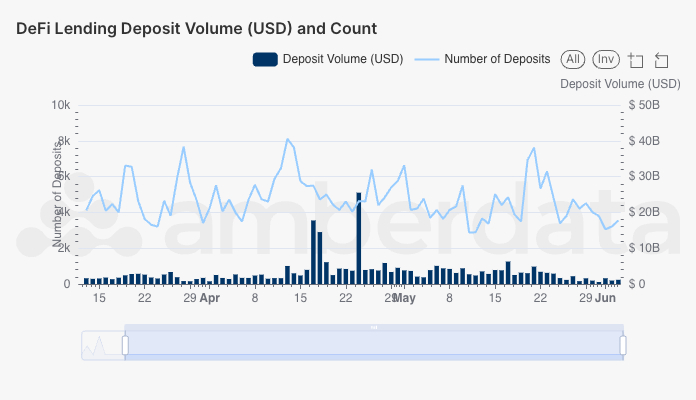
Deposit transaction counts and volumes across DeFi Lending protocols
Correlating these deposits with transaction counts shows us that these days only had a low number (and relatively low volume) of deposits, indicating that withdrawals are simply not happening.
Networks
Network comparisons from weeks 5/28/2024 and 6/04/2024
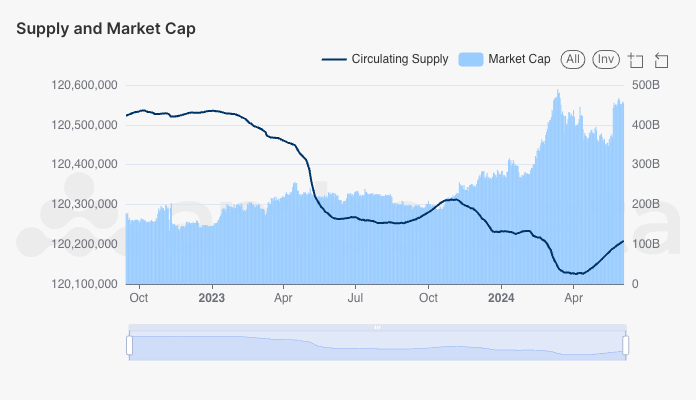
Ethereum Supply and Market Cap since September 2023
Ethereum’s circulating supply continues to ramp upwards, reversing the trend since the September merge. This may be a significant shift as the network has been burning circulating supply for several months and transaction fees have steadily declined for most activities. As Ethereum’s supply increases and prices continue to move upward, the market capitalization of the L1 network has more than doubled since October 2023.
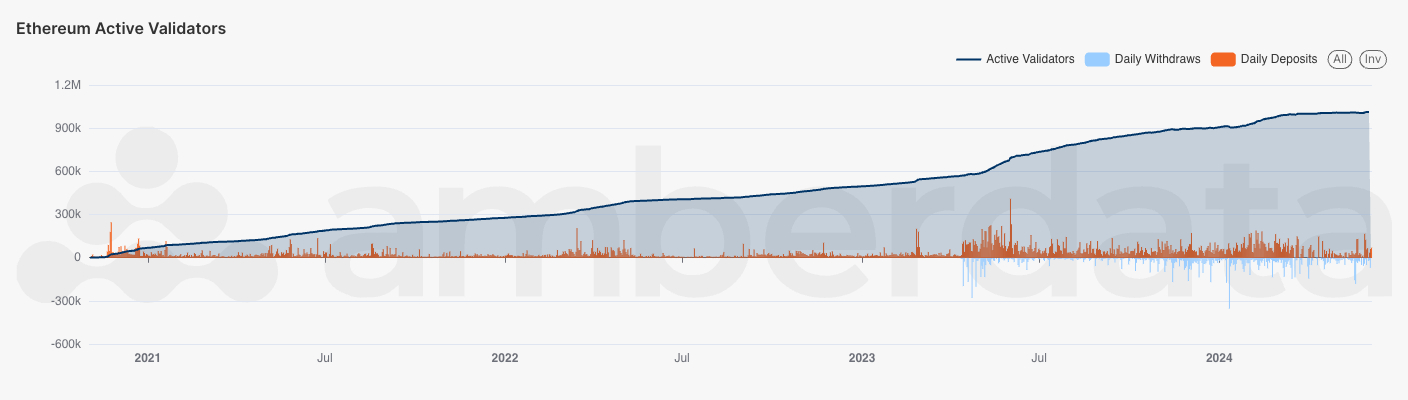
Ethereum active validators and validator changes since 2021
Another interesting perspective on Ethereum supply is that active validators have only grown since 2021. While some speculated that network validators would decline once withdrawals were made possible, the network has since seen a massive increase and added even more funds to the security layer. With spot Ethereum ETFs on a path to reality in the United States, it’ll be interesting to see how this trend continues and if we’ll see more institutional funds seeking value in liquid staking derivatives such as LDO or stETH.
Links
AmberLens: intelligence.amberdata.com
Recent from Amberdata
-
Fintech Magazine: Interview with Tongtong Gong
-
Amberdata: Consensus 2024 Key Takeaways
-
CryptoDaily: Analysts Predict Imminent Ethereum Bull Run Despite Short-Term Struggles
-
Decrypt: Ethereum Bull Run Imminent Following ETF Approvals: Analysts
Spot Market
Spot market charts were built using the following endpoints:
-
https://docs.amberdata.io/reference/market-metrics-exchanges-volumes-historical
-
https://docs.amberdata.io/reference/market-metrics-exchanges-assets-volumes-historical
Futures
Futures/Swaps charts were built using the following endpoints:
-
https://docs.amberdata.io/reference/futures-ohlcv-historical
-
https://docs.amberdata.io/reference/futures-funding-rates-historical
-
https://docs.amberdata.io/reference/futures-long-short-ratio-historical
-
https://docs.amberdata.io/reference/swaps-exchanges-reference
-
https://docs.amberdata.io/reference/swaps-funding-rates-historical
DeFi DEXs
DeFi DEX charts were built using the following endpoints:
DeFi Borrow/Lend
DeFi lending charts were built using the following endpoints:
Networks
Network charts were built using the following endpoints:
-
https://docs.amberdata.io/reference/blockchains-metrics-latest
-
https://docs.amberdata.io/reference/transactions-metrics-historical
-
https://docs.amberdata.io/reference/get-historical-transaction-volume
