Share this blog:

In this week’s Digital Asset Snapshot, we cover the fallout from recent market tremors, including the Bybit Hack, which comes amid persistent macroeconomic pressures that have driven Bitcoin’s price sharply downward. Our report details Bitcoin’s retreat from an all-time high near $109k in January to levels between $80k and $85k, as inflationary signals, rising Treasury yields, and geopolitical uncertainties reshape investor sentiment. We also examine how hedge funds unwound their lucrative arbitrage strategies—exacerbating the sell-off—and highlight Solana’s impending 3% token unlock alongside a notable decline in its memecoin market. These developments underscore the shifting dynamics across both traditional and digital asset landscapes, reflecting a broader move toward caution in an increasingly volatile environment.
News
- Macroeconomic Pressures and Bitcoin’s Price Decline: Bitcoin’s sharp fall is driven by rising inflation (with the US PCE at 2.5% YoY and Core PCE up 0.3% MoM), elevated 10-year Treasury yields, and renewed geopolitical risks, all of which are prompting a reallocation from volatile assets.
- Hedge Fund Arbitrage and ETF Unwind Impact on Bitcoin: Hedge funds capitalized on the basis trade during Bitcoin’s rally; however, as the futures premium narrowed, a rapid unwind of positions and significant ETF outflows intensified the downward pressure.
- Token Unlock Surge and Meme Coin Retreat Impact on Solana: Ahead of its March 1 unlock—releasing 3% of its supply—Solana faces additional challenges as declining activity in its meme coin market erodes speculative confidence.
- Bybit Breach Reveals the Largest Hack Ever Recorded: A security breach on February 21 led to the theft of nearly $1.5 billion in ETH, highlighting severe vulnerabilities and state-affiliated cyber risks.
Market Analysis
- BTC ETFs See First Net Decrease: Recent on-chain data reveals a dramatic shift from inflows to net outflows among ETF providers, signaling growing market caution.
- Cumulative Totals Held Remain Strong but at Levels Seen in November: Despite robust historical accumulation by major players, recent pullbacks indicate emerging hesitancy.
- Miner Positioning and Stress Indicators Point to Caution: Elevated miner outflows and spikes in capitulation metrics suggest defensive positioning amid the downturn.
- Large Increase in Exchange Traded Volume from Jan Lows: A surge in trading volumes reflects an urgent rush to exit positions as market volatility intensifies.
- Long-Short Ratios Show Possible Further Risks of Liquidations: Increasing long biases on exchanges, combined with looming events like the Solana unlock, heighten the risk of cascading liquidations.
News
Macroeconomic Pressures and Bitcoin’s Price Decline
Bitcoin’s recent decline has been shaped by a convergence of persistent macroeconomic pressures. After reaching an all-time high near $109k in January 2025, Bitcoin’s price retreated sharply to levels between $80k and $85k. This drop came as inflation continued to exert pressure on markets; the US Personal Consumption Expenditures (PCE) Price Index registered around 2.5% year-over-year, while the Core PCE—excluding volatile food and energy prices—climbed by 0.3% month-over-month. In response, the Federal Reserve signaled a cautious stance, opting to hold interest rates steady despite earlier easing, a move reflecting deep-seated concerns over inflation.
At the same time, the 10-year Treasury yield hovered between 4.4% and 5%, making traditional, risk-free assets more attractive compared to volatile investments like Bitcoin. Furthermore, Bitcoin’s price action has increasingly mirrored that of high-growth tech stocks; recent selloffs in indices such as the Nasdaq have been accompanied by corresponding declines in Bitcoin’s value. Geopolitical uncertainties—including renewed trade war threats and tariff proposals—have only added to investor anxiety. Even though Bitcoin’s rising dominance in the crypto market underscores its appeal as a reserve asset, these macro factors are forcing a reallocation of capital. Investors are now more inclined toward assets that offer stability in an environment where both traditional and digital markets face considerable headwinds.
Hedge Fund Arbitrage and ETF Unwind Impact on Bitcoin
Hedge funds have played a pivotal role in both driving and deepening Bitcoin’s recent price drop. During Bitcoin’s rally to around $109,000, many funds exploited the basis trade by purchasing spot Bitcoin through ETFs and shorting Bitcoin futures on the CME. This arbitrage became highly lucrative as the futures premium soared well above risk-free Treasury yields, especially when the 10-year note was trading near 4.4%–5%, and CME futures open interest surged to approximately $23 billion. However, as the gap between the futures price and the spot price narrowed to about 4%, nearly matching safe yields, the attractiveness of these trades diminished sharply.
This shift triggered a massive unwind of positions along with significant net ETF outflows over a single week. As funds rushed to exit their positions, ETF managers were forced to liquidate underlying Bitcoin holdings, adding further downward pressure that pushed prices below the $87k mark. Prominent market voices have warned that this unwinding could initiate a self-reinforcing cycle, potentially driving Bitcoin down to near $70k if the selloff intensifies. The episode highlights how intertwined Bitcoin has become with traditional financial instruments and sophisticated hedge fund strategies. In effect, the liquidity shock generated by the rapid unwinding of these arbitrage positions not only underscores Bitcoin’s structural vulnerability but also raises significant concerns about prolonged volatility as market participants reassess their exposure in an increasingly complex financial landscape.
Token Unlock Surge and Meme Coin Retreat Impact on Solana
Solana is preparing for a significant token unlock on March 1, where roughly 10–11 million SOL—around 2.3% of its circulating supply—will enter the market. This event follows previous unlocks that have added notable amounts of tokens into circulation, leading to market jitters. The influx, stemming largely from assets linked to the FTX bankruptcy estate, has already contributed to SOL’s price falling to multi-month lows. While some institutional investors have stepped in to absorb parts of this supply, the anticipation of increased sell pressure continues to unsettle traders and heighten volatility.
Alongside the unlock, Solana’s ecosystem is witnessing a decline in its once-vibrant meme coin market. Activity on platforms like Pump.fun has sharply decreased, and high-profile meme tokens—including those themed around Trump, Melania, and Libra—have suffered dramatic failures that have eroded investor confidence. This downturn in speculative projects mirrors broader market trends, where riskier assets have come under pressure, much like Bitcoin’s historical retreats during turbulent periods. While Bitcoin has demonstrated more resilience in the face of market corrections, Solana now faces the dual challenge of managing a large token unlock and a faltering meme coin segment. The combined effect of these factors is prompting cautious market sentiment, with many investors waiting to see if Solana can stabilize and recover amid these pressures.
Bybit Breach Reveals the Largest Hack Ever Recorded
On February 21, 2025, cryptocurrency exchange Bybit experienced a major security breach that led to the theft of nearly $1.5 billion worth of Ethereum (ETH), marking the largest digital heist in crypto history. Hackers exploited vulnerabilities by gaining access to a Safe developer’s computer and injecting malicious JavaScript into the user interface. This allowed them to disguise fraudulent transactions as routine transfers. As a result, approximately 401,000 ETH were illicitly redirected from Bybit’s Ethereum cold wallet to addresses controlled by the attackers. The stolen assets were subsequently moved through a labyrinth of intermediary wallets, involving token swaps, decentralized exchanges, and cross-chain bridges to obscure their origin.
Investigations have linked the attack to North Korea–affiliated cybercriminals, whose tactics mirror previous DPRK-backed crypto heists. This exploit highlights the growing sophistication of state-sponsored cyber attacks, employing social engineering and advanced laundering methods. In response, Bybit has partnered with blockchain forensic experts such as Chainalysis and law enforcement agencies while offering a recovery bounty to encourage the return of stolen funds. The incident underscores rising security challenges in the crypto market and emphasizes the urgent need for enhanced industry collaboration and vigilance against evolving digital threats. This event signals a turning point in security.
Market Analysis
BTC ETFs See First Net Decrease
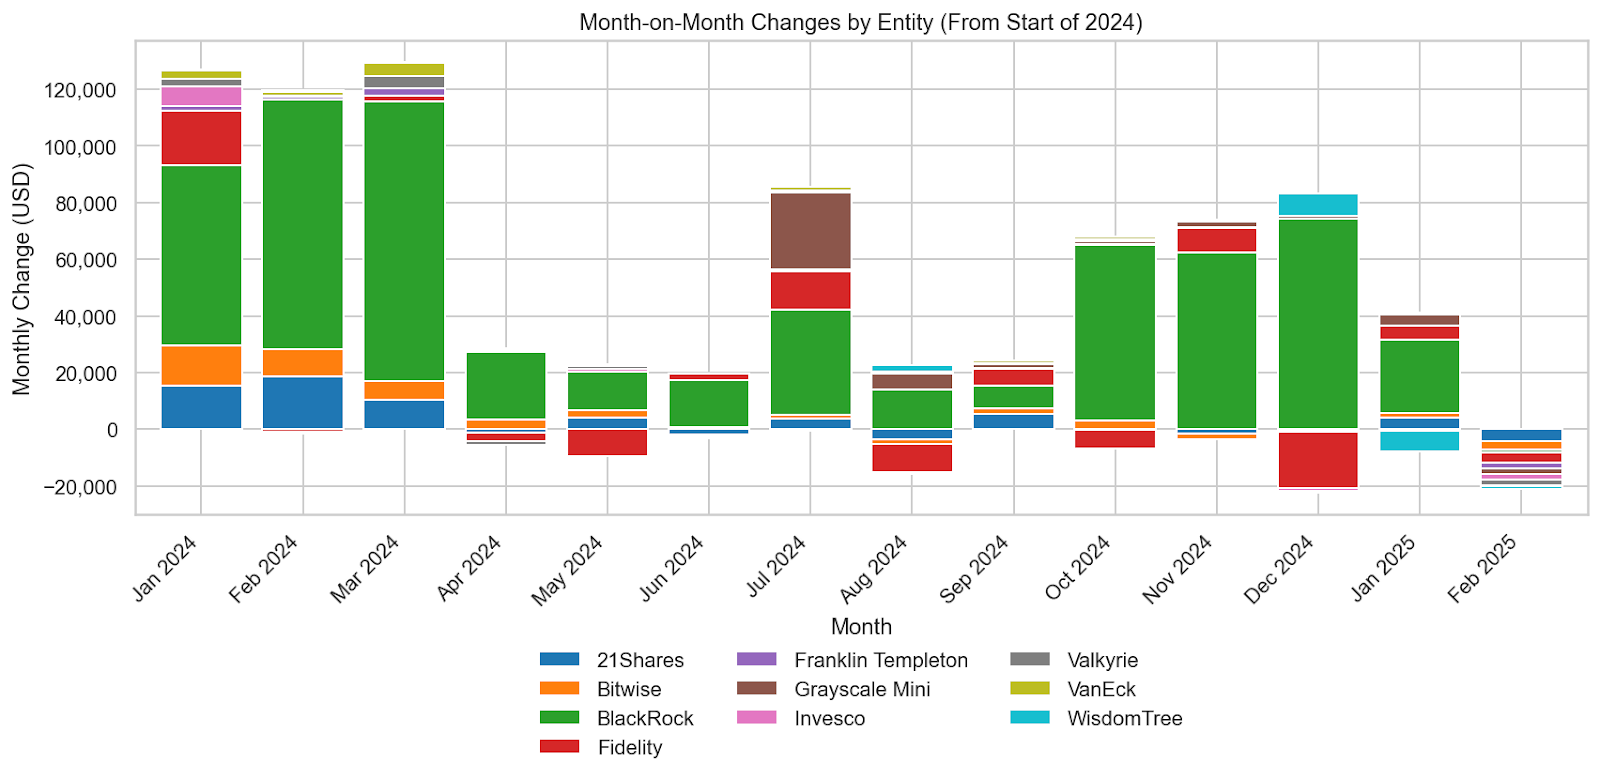
Across the three months ending December 2024, January 2025, and February 2025, the on-chain net flows for ETF providers experienced a dramatic shift. In December, the landscape was marked by robust inflows for several providers. For example, BlackRock posted an impressive inflow of roughly 74,140 BTC, while WisdomTree added about 7,840 BTC to its wallet. Other providers, such as 21Shares and Bitwise, showed more modest figures—recording inflows of nearly –400 BTC (a slight outflow that month) and –550 BTC respectively, though these numbers varied widely across the board.
January continued the positive trend, with many providers registering significant inflows. BlackRock, for instance, saw inflows drop to about 25,840 BTC, yet still remained a clear leader. Similarly, 21Shares experienced an inflow of around 4,110 BTC, Bitwise climbed to about 1,740 BTC, and Fidelity boosted its wallets by roughly 4,780 BTC. Even smaller players such as Grayscale Mini recorded an inflow of close to 3,870 BTC. These figures underscored strong market participation and a general appetite for accumulating positions, with most entities reporting net gains in BTC across their on-chain wallets.
February, however, marked an unprecedented reversal—the first net outflow observed in this series. Almost every provider saw flows turn negative. Notably, 21Shares swung from +4,110 BTC in January to –4,140 BTC in February, while Bitwise reversed from +1,740 BTC to –3,190 BTC. Fidelity also reversed its earlier gains, shifting from +4,780 BTC to –3,670 BTC. Even BlackRock, which had previously attracted significant inflows, recorded a modest outflow of –990 BTC. Additionally, Invesco’s wallet, which had seen a minor inflow of 170 BTC in January, plummeted to an outflow of –1,890 BTC, and Valkyrie worsened from –450 BTC to –2,070 BTC. This marked shift in February signals a potential reassessment by investors, as the notable reversals among leading providers could reflect evolving market sentiment or a tactical rebalancing of positions.
Cumulative Totals Held Remain Strong but at Levels Seen in November
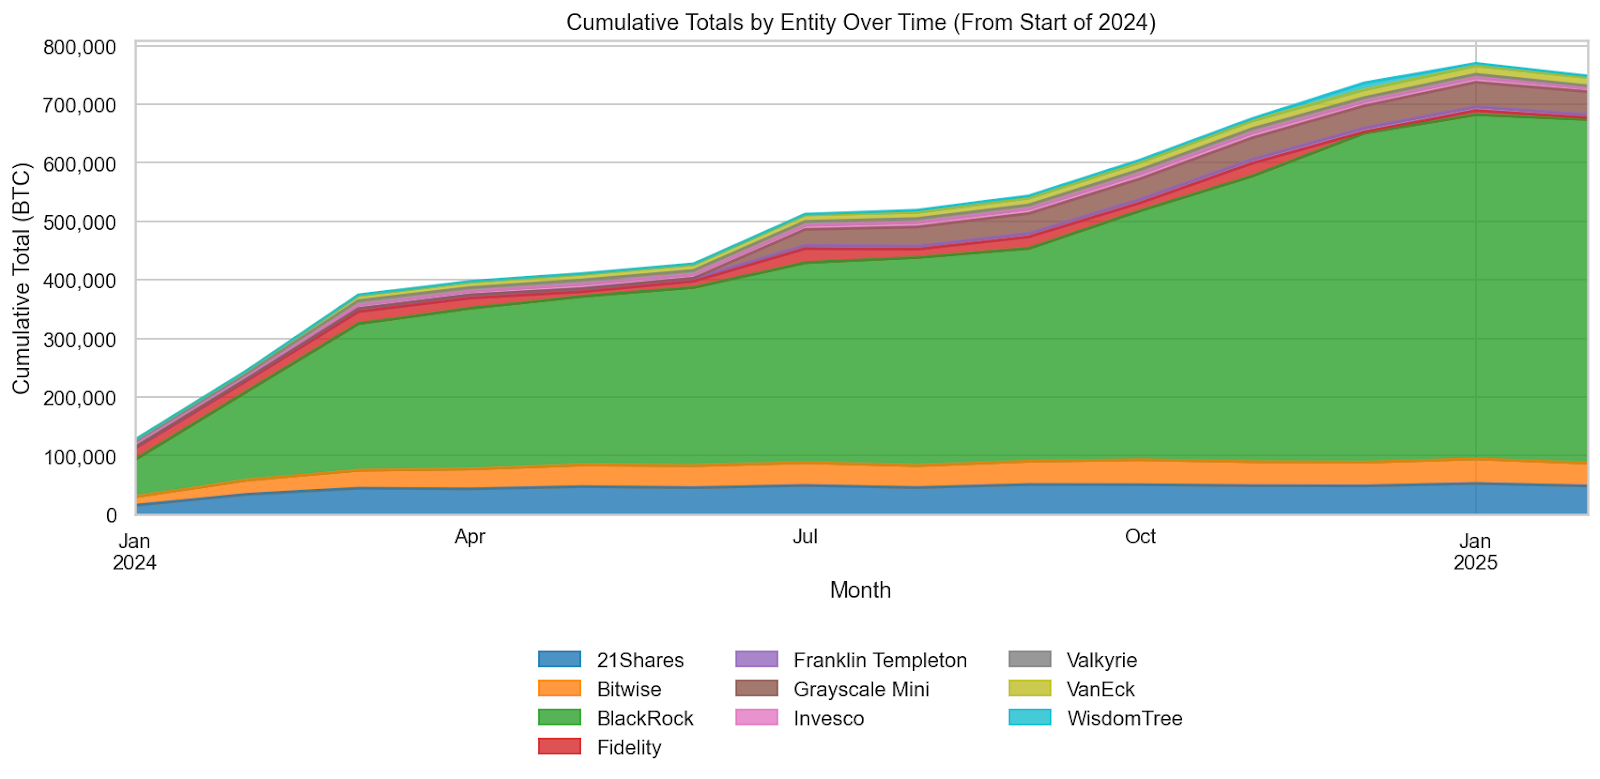
The cumulative totals tell a compelling story. Despite the robust holdings built up over 2024—with BlackRock nearing 588,020 BTC and 21Shares surpassing 52,450 BTC by January 2025—the early part of 2025 reveals a cautionary shift. While the overall figures remain strong, the declines in February are telling. For instance, 21Shares fell by roughly 4,140 BTC, and Bitwise dropped by about 3,170 BTC, signaling that investors are beginning to pull back. BlackRock, although still dominant, registered a modest retreat of nearly 990 BTC, which, while small in percentage terms, reinforces the emerging trend of cautious rebalancing.
This subtle pullback is not isolated; Fidelity’s cumulative holdings experienced a more pronounced contraction—dropping by approximately 3,670 BTC between January and February. Smaller providers like Invesco and Valkyrie also saw declines of around 1,890 BTC and 2,070 BTC respectively. In total, while the substantial cumulative balances underscore strong historical accumulation, the recent downward adjustments indicate weakening investor sentiment. This evolving dynamic suggests that even well-established positions are now subject to market uncertainty and strategic rebalancing.
Miner Positioning and Stress Indicators Point to Caution
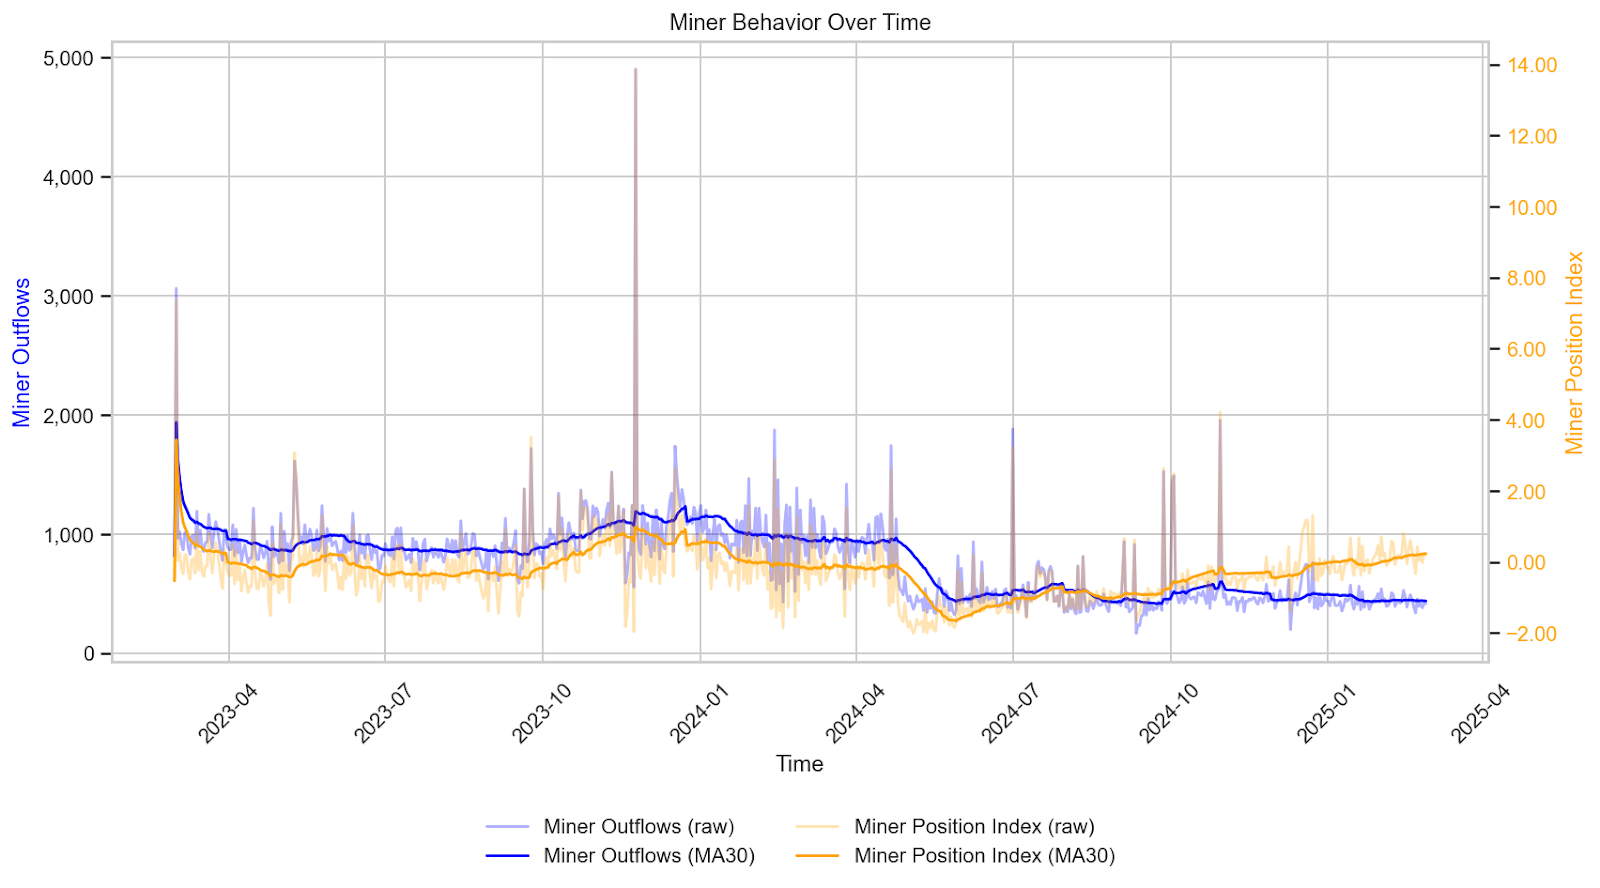
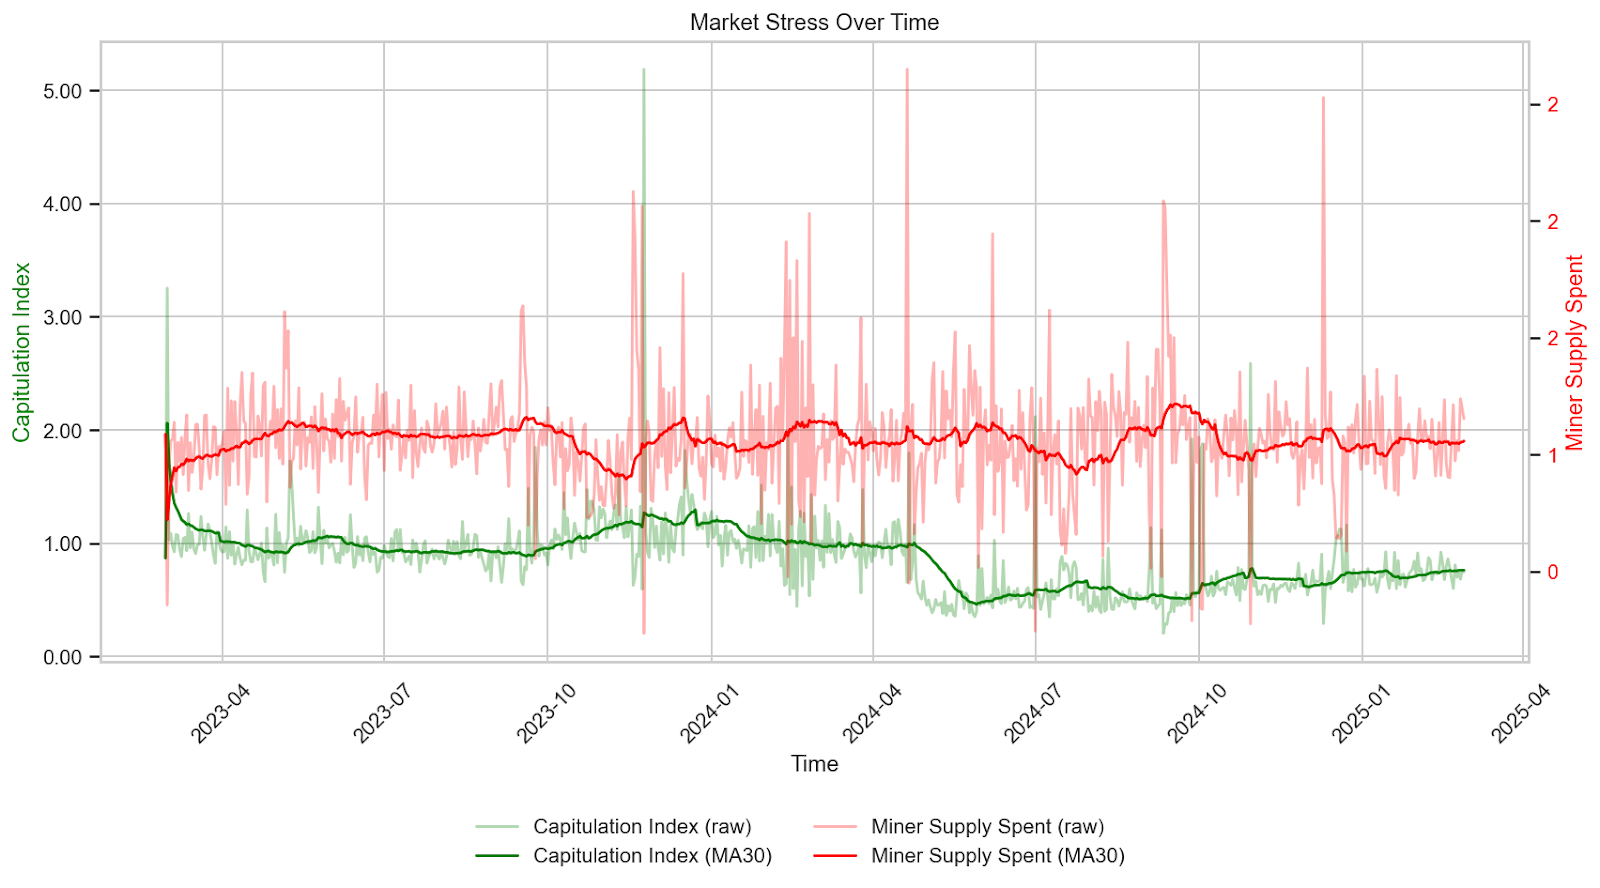
Recent miner data reveals critical shifts in sentiment amid the broader market downturn, as Bitcoin’s price recently tumbled from around $100k to approximately $80k at the 200-day moving average. In this context, “Miner Outflows”—which quantify the net daily BTC exiting miners’ wallets—have consistently hovered in the 400–500 BTC range, with spikes such as about 540 BTC on February 1. Simultaneously, the “Capitulation Index,” a gauge of miner distress where values near 1 indicate significant stress, has shown intermittent surges in February (peaking above 0.92 on select days), reflecting heightened unease. “Miner Holdings” (formerly the minerPositionIndex) offer insight into miners’ accumulated BTC reserves relative to historical trends; while their 30-day moving average shows a slight upward drift toward 0.23 by month’s end, the persistent high outflows and capitulation signals suggest that even as miners maintain strong holdings, they are increasingly predisposed to offloading BTC under mounting pressure. Furthermore, “Miner Supply Spent” remains relatively stable—its 30-day average lingering just above 1.05—indicating that operational liquidity management continues despite the bearish backdrop.
This recent BTC price drop to $80k is particularly telling when taken against these miner metrics. The market correction appears to have nudged miners into a more defensive posture, as evidenced by their ongoing outflows and elevated capitulation levels. Although miners have built robust reserves over time, the sustained selling pressure coupled with periodic spikes in the Capitulation Index suggests that they are bracing for further market volatility. Essentially, while miner holdings remain substantial, the current trends underscore a weakening sentiment; miners appear to be balancing long-term accumulation with tactical liquidity adjustments in response to the dramatic price correction.
Large Increase in Exchange Traded Volume from Jan Lows
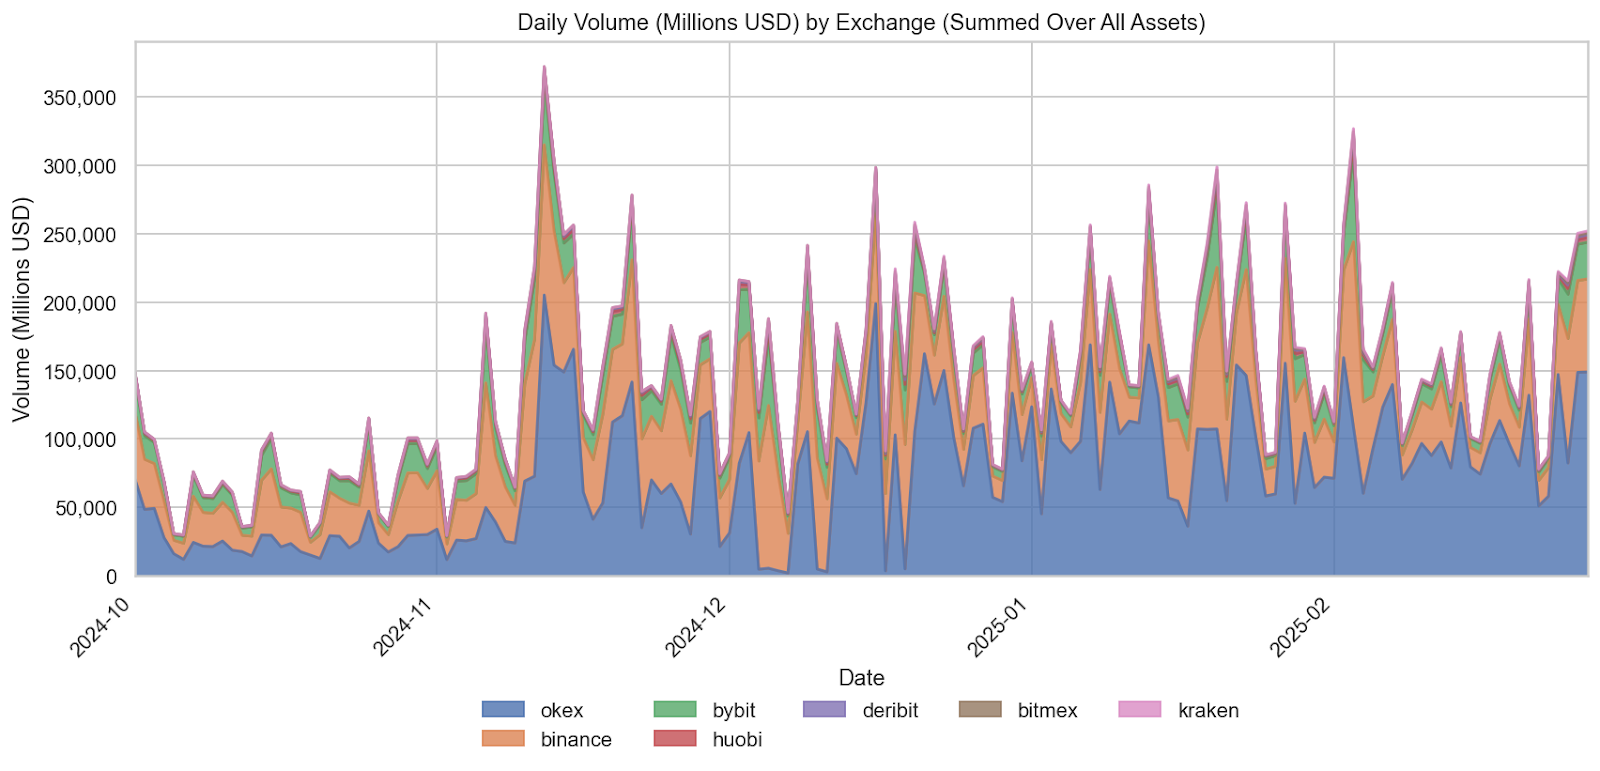
In February, major exchanges have seen daily traded volumes surge dramatically, with totals climbing from about $140 billion in January to peaks around $327 billion. This liquidity explosion comes as hedge funds begin unwinding their BTC positions amid a broader market correction that has seen Bitcoin’s price fall from approximately $100k to roughly $80k to the 200-day moving average. While this massive volume increase reflects a rush to exit positions and reallocate capital, it also underscores the heightened volatility and uncertainty currently gripping the market.
A notable element in this unfolding story is the spot versus futures hedge fund strategy. Typically, these funds engage in a basis trade by buying Bitcoin on the spot market while simultaneously selling Bitcoin futures contracts, aiming to profit from the price difference between the two markets. However, as the basis narrows and the arbitrage opportunity diminishes, many hedge funds are liquidating these positions. Although this strategy is not the primary driver of the recent volume surge, its unraveling adds another layer of pressure on BTC prices. Together, these dynamics highlight how institutional exits and strategic recalibrations are reshaping market sentiment and accelerating the current downturn.
Long-Short Ratios Show Possible Further Risks of Liquidations
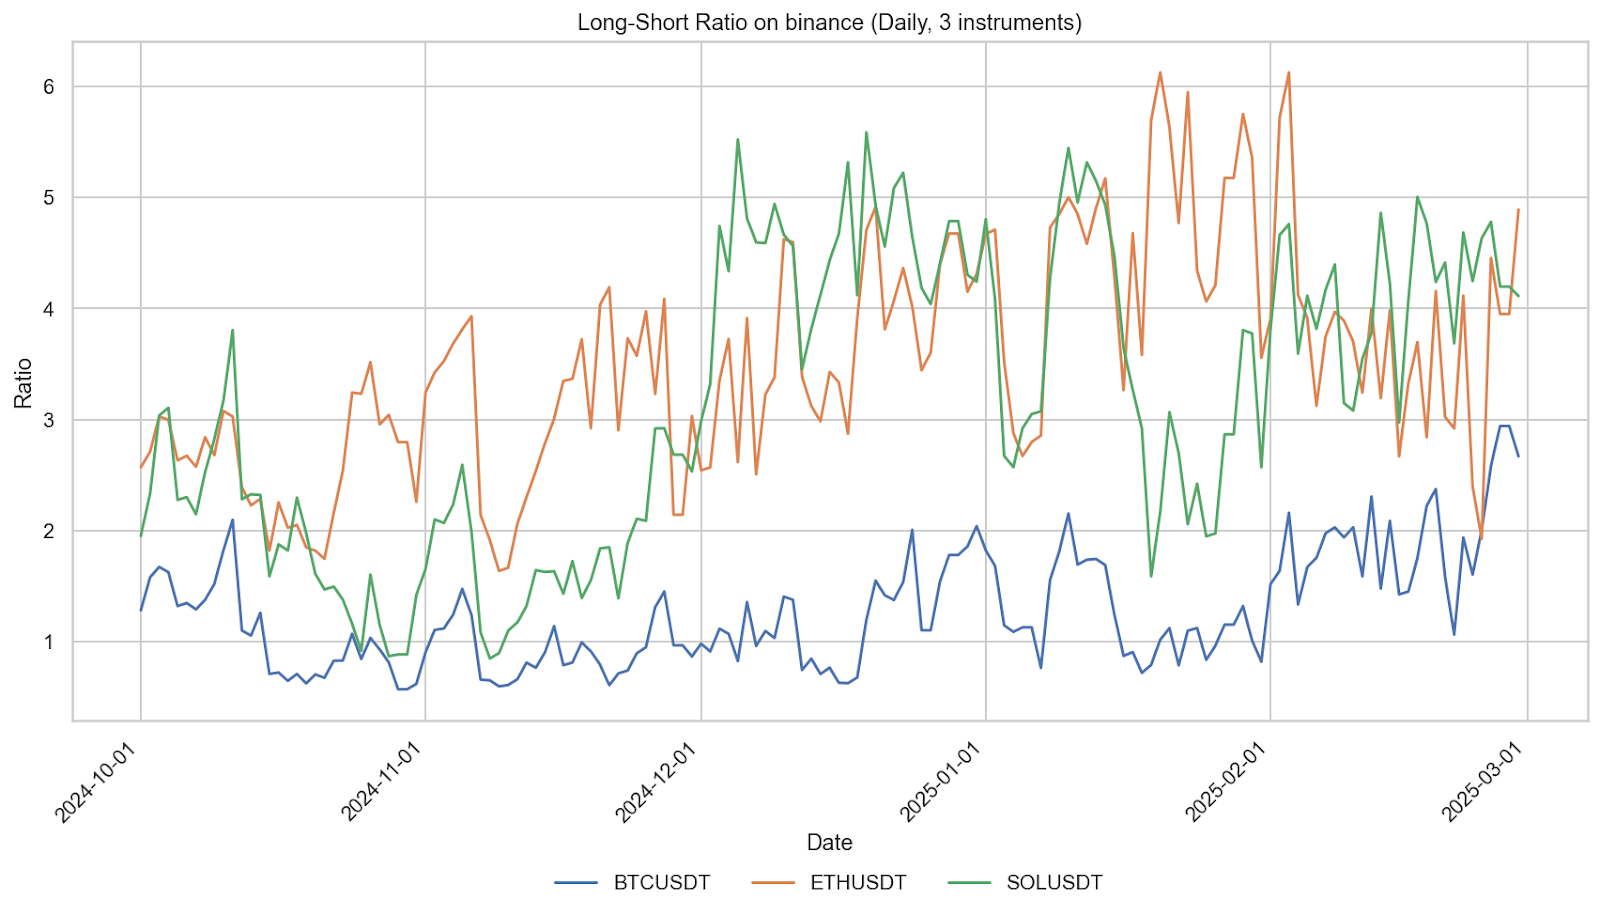
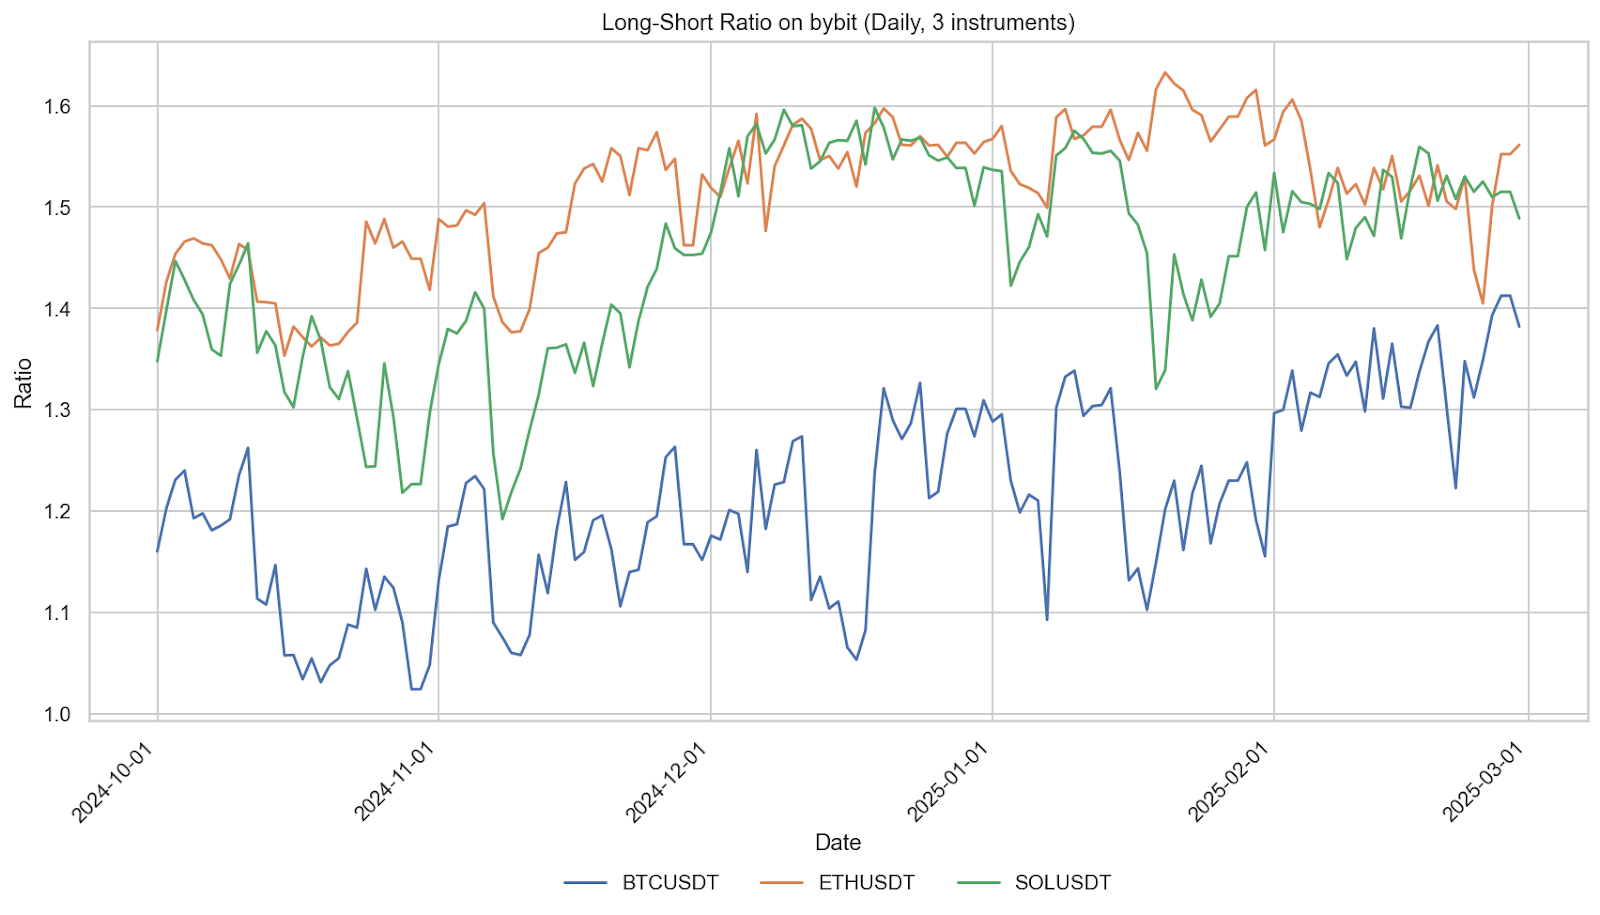
Long short ratios on Binance and Bybit have been trending upward in recent weeks, underscoring growing risk amid bearish market conditions. On Binance, the BTCUSDT long short ratio has surged from roughly 1.0–1.3 in late January to values exceeding 2.0 and even approaching 3.0 by mid-to-late February. Similar upward movements are evident for ETHUSDT and SOLUSDT, with SOL’s ratio particularly notable as it rebounded from a low near 1.6 in mid-January to over 4.7 by early February. Bybit’s ratios, while generally lower—hovering around 1.3–1.4 for BTCUSDT—also exhibit a gradual increase. These ratios indicate that traders are increasingly positioned on the long side relative to shorts. However, with this bullish bias amid a bearish environment, market participants face elevated liquidation risks if the trend reverses. The pressure is compounded by significant trading volumes and the unwinding of hedge fund positions, which have already contributed to BTC’s decline from $100 billion territory to roughly $80 billion at the 200-day moving average.
Adding to the volatility, a scheduled 3% supply unlock of Solana on March 1 is poised to inject further uncertainty into the market. The impending unlock, alongside the persistent bullish long bias in long short ratios, raises the stakes considerably. As traders become over-leveraged on long positions, any abrupt downturn in BTC or SOL prices could trigger a cascade of liquidations, draining liquidity from an already stressed market. In this environment, the convergence of aggressive long positions, hedge fund exit strategies, and looming supply events creates a precarious setup, increasing the likelihood of rapid price corrections and further amplifying market risk.
Links
AmberLens: intelligence.amberdata.com
Recent from Amberdata
- Amberdata: Crypto, Elections, and Derivatives: Predicting Market Reactions
- Amberdata: Altcoin Volatility Surface Methodology
- Amberdata: AD Derivatives Podcast Featuring Bulat Kaliev, CPO at BABB & ReDeFi
- Amberdata: Bridging TradFi, CeFi, and DeFi: Introducing Crypto ETF and Equity Options
- Amberdata: AmberLens Product Update: USD & EUR Stablecoin Dashboard Enhancements
- Amberdata: AD Derivatives Newsletter: Navigating BTC Volatility Amid U.S. Elections
Spot Market
Spot market charts were built using the following endpoints:
- https://docs.amberdata.io/reference/market-metrics-exchanges-volumes-historical
- https://docs.amberdata.io/reference/market-metrics-exchanges-assets-volumes-historical
- https://docs.amberdata.io/reference/get-market-pairs
- https://docs.amberdata.io/reference/get-historical-ohlc
Futures
Futures/Swaps charts were built using the following endpoints:
- https://docs.amberdata.io/reference/futures-exchanges-pairs
- https://docs.amberdata.io/reference/futures-ohlcv-historical
- https://docs.amberdata.io/reference/futures-funding-rates-historical
- https://docs.amberdata.io/reference/futures-long-short-ratio-historical
- https://docs.amberdata.io/reference/swaps-exchanges-reference
- https://docs.amberdata.io/reference/swaps-ohlcv-historical
- https://docs.amberdata.io/reference/swaps-funding-rates-historical
DeFi DEXs
DeFi DEX charts were built using the following endpoints:
- https://docs.amberdata.io/reference/defi-dex-liquidity
- https://docs.amberdata.io/reference/defi-dex-metrics
- https://docs.amberdata.io/reference/defi-impermanent-loss
DeFi Borrow/Lend
DeFi lending charts were built using the following endpoints:
- https://docs.amberdata.io/reference/defi-lending-protocol-lens
- https://docs.amberdata.io/reference/defi-lending-asset-lens
Networks
Network charts were built using the following endpoints:
- https://docs.amberdata.io/reference/blockchains-metrics-latest
- https://docs.amberdata.io/reference/transactions-metrics-historical
- https://docs.amberdata.io/reference/get-historical-transaction-volume

Disclaimers
The information contained in this report is provided by Amberdata solely for educational and informational purposes. The contents of this report should not be construed as financial, investment, legal, tax, or any other form of professional advice. Amberdata does not provide personalized recommendations; any opinions or suggestions expressed in this report are for general informational purposes only.
Although Amberdata has made every effort to ensure the accuracy and completeness of the information provided, it cannot be held responsible for any errors, omissions, inaccuracies, or outdated information. Market conditions, regulations, and laws are subject to change, and readers should perform their own research and consult with a qualified professional before making any financial decisions or taking any actions based on the information provided in this report.
Past performance is not indicative of future results, and any investments discussed or mentioned in this report may not be suitable for all individuals or circumstances. Investing involves risks, and the value of investments can go up or down. Amberdata disclaims any liability for any loss or damage that may arise from the use of, or reliance on, the information contained in this report.
By accessing and using the information provided in this report, you agree to indemnify and hold harmless Amberdata, its affiliates, and their respective officers, directors, employees, and agents from and against any and all claims, losses, liabilities, damages, or expenses (including reasonable attorney’s fees) arising from your use of or reliance on the information contained herein.
Copyright © 2025 Amberdata. All rights reserved.