Share this blog:
Introduction
Stablecoins, digital assets designed to mirror the value of fiat currencies, have become an integral part of the cryptocurrency trading ecosystem. They offer an oasis of stability in a market renowned for its wild price swings. But what happens when stablecoins drift away from their peg? Depegging events can introduce layers of volatility and trading opportunities that are unique to the cryptocurrency landscape. This report delves into the mechanics of depegging, the arbitrage opportunities that arise during these events, particularly concerning futures contracts and spot markets, and the inherent risks involved for traders. Leveraging Amberdata's APIs, we'll also explore analysis techniques through some plots to illustrate the market impact of depegging events and the opportunities that they present to traders.
Mechanics of Depegging
To understand depegging, it's crucial first to comprehend how stablecoins maintain their peg to fiat currencies like USD. Typically, this is achieved through a combination of reserves, algorithms, or collateral. In the case of fiat-collateralized stablecoins like Tether (USDT) or USD Coin (USDC), the issuing entity holds a reserve of real-world assets equal to the number of tokens in circulation. Algorithmic stablecoins, on the other hand, use smart contracts and varying issuance mechanisms to maintain their peg.
A depegging event is characterized by a significant deviation of a stablecoin from its normally pegged value. While both USDC and USDT aim to maintain a 1:1 peg with the U.S. Dollar, it's important to understand that these two stablecoins are not inherently pegged to each other. For instance, if USDT begins trading at $0.95 while USDC trades at $1.01, this divergence represents a depegging event between the two stablecoins. The chart below examines historical data, showcasing the close prices of USDC/USDT on major exchanges over the past two years. Although they generally trade closely to each other, there have been periods where USDC has traded at a premium or discount relative to USDT. These fluctuations create unique arbitrage opportunities for traders. Figure 1 illustrates the daily close prices of USDC/USDT, highlighting multiple instances where one stablecoin has deviated significantly from the other, signaling episodes of depegging.
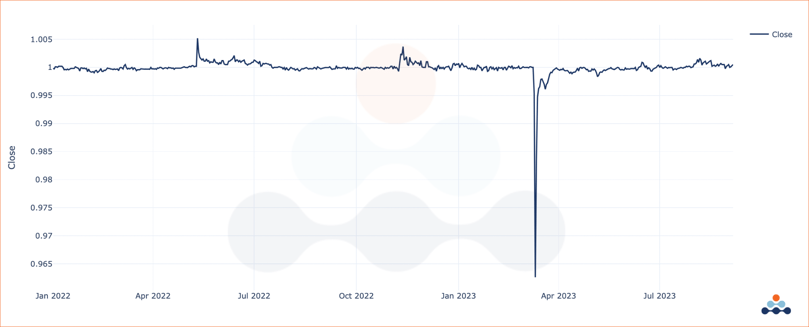
Figure 1 - USDC/USDT Close Prices Over Time (Bitfinex)
During depegging events, direct trading opportunities often emerge, especially when discrepancies arise between spot market prices of stablecoins. For instance, a depegging event might cause USDC to trade at a premium while USDT falls below its peg. Traders can exploit these price differences for potential gains. However, the opportunities are not as straightforward as they appear. Market variables like transaction costs, liquidity, and other underlying factors can significantly impact the profitability of these trades. Amberdata's API offers real-time and historical stablecoin data, aiding traders in identifying and navigating these complex trading scenarios more effectively.
Why Do Stablecoin Depegging Events Occur?
Depegging events are not random; they usually occur due to certain driving factors. Below are some of the primary reasons:
- Reserve Inadequacy: If traders start doubting the sufficiency of a stablecoin's reserve, they may start selling off, causing a depeg.
- Algorithmic Failures: Bugs or exploits in the smart contract can lead to depegging events for algorithmic stablecoins.
- Market Liquidity: A sudden surge in demand or supply can overwhelm the mechanisms keeping the coin stable, particularly if there is not enough liquidity in the market to absorb these shocks.
- Regulatory News: Announcements of regulatory scrutiny can trigger panic selling, temporarily causing a stablecoin to lose its peg.
- Macro-Economic Factors: Although less common, larger economic trends can also lead to a stablecoin deviating from its peg.
Direct Trading Opportunities Between USDC and USDT
The cryptocurrency landscape is a collection of complex markets. An illustrative example of this complexity arises during depegging events between stablecoins like USDC and USDT. To understand the nuances, let’s dive back into the previous example, in Figure 1, where USDC starts trading at the pegged price of $1.00, while USDT falls to $0.96. For many, this divergence creates an immediate impulse to buy USDT at a lower rate and sell USDC at a higher rate. However, while this trading strategy seems straightforward, it's fraught with intricacies and potential pitfalls.
Figure 2 serves as an eye-opener by delving into the trading volumes of USDC and USDT during the time of depegging. It reveals a dramatic increase in trading volumes, particularly for USDT, as market participants attempt to capitalize on the price differences. While increased volume can create more liquidity and potentially better entry and exit points, it can also lead to heightened volatility, making the timing of trades even more crucial. On the other hand, the increased volume could also signify heightened market activity or even panic selling or buying, which can exacerbate price volatility.
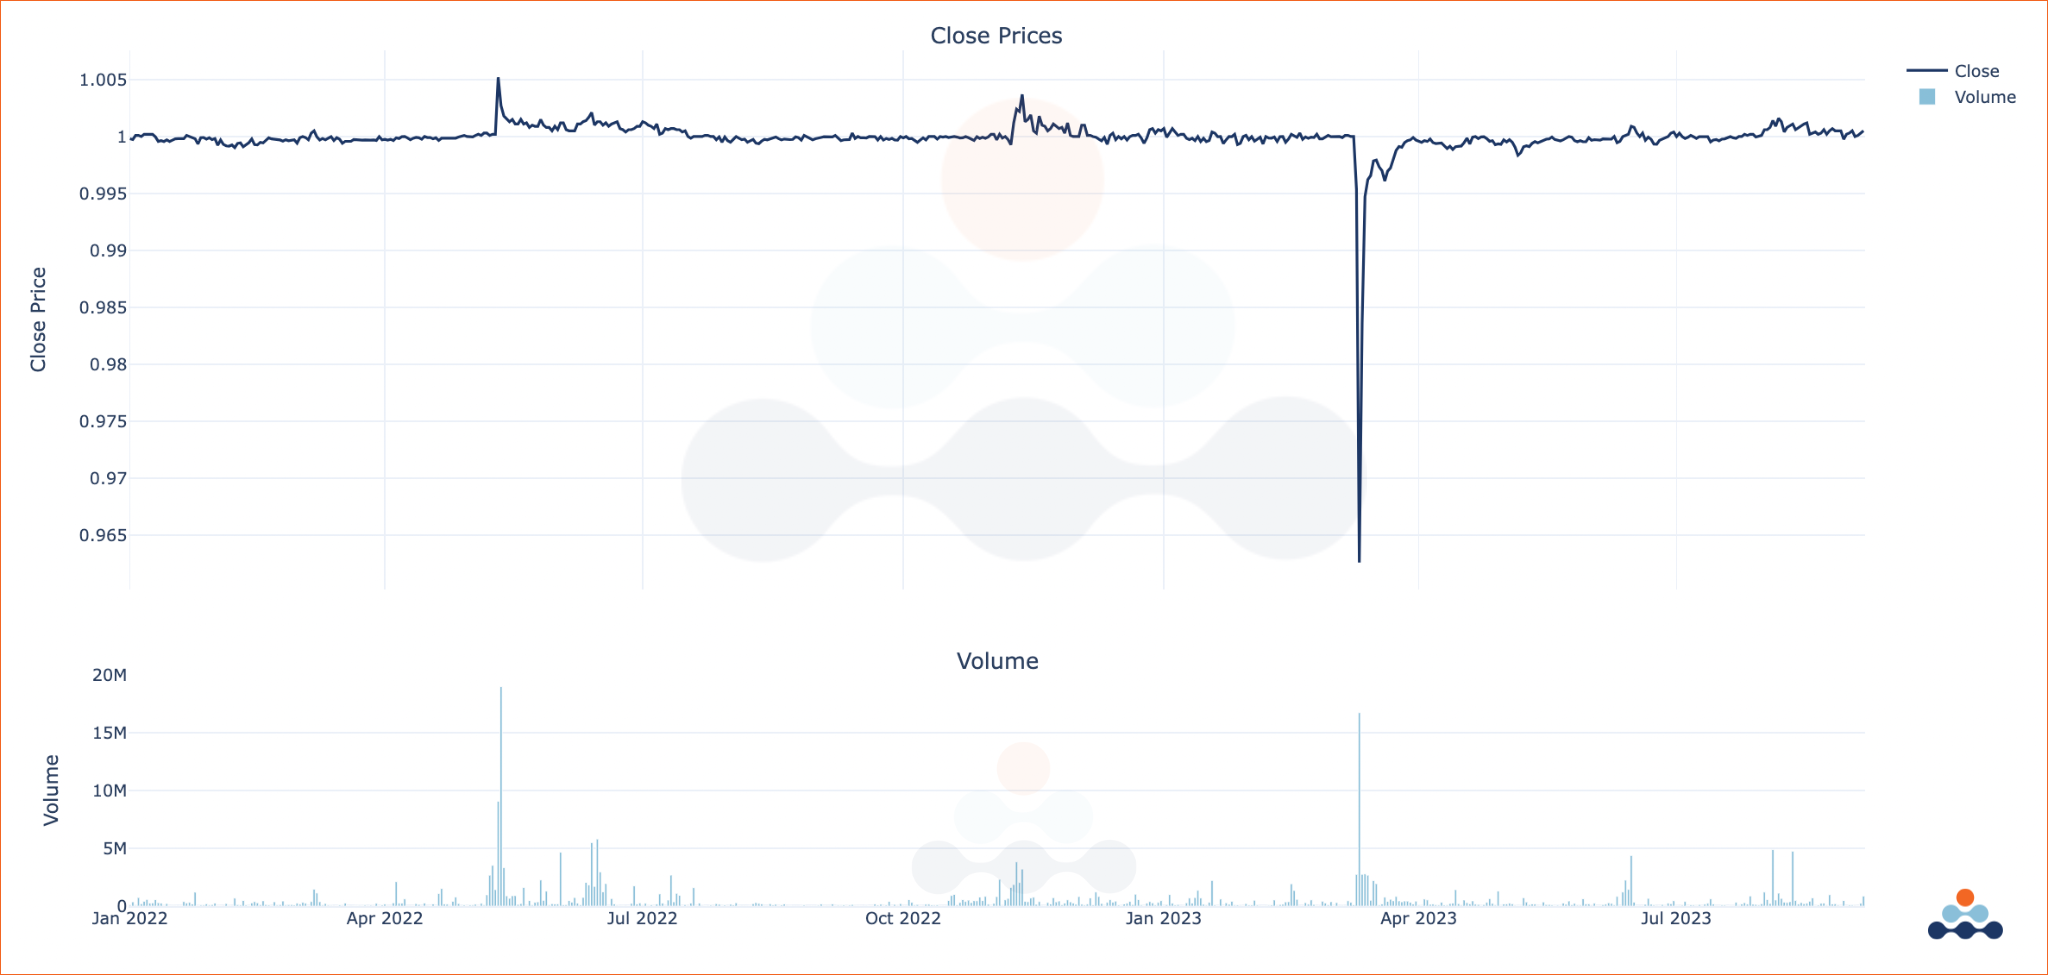 Figure 2 – USDC/USDT Close Prices and Volume Over Time (Bitfinex)
Figure 3 dives deeper into the complexities of the bid-ask spread. It plots the fluctuation in the spread between the bid and asks prices during the depegging event. What's crucial to understand is that the bid-ask spread is not merely a 'transaction cost' but also an indicator of market liquidity and volatility. During a depegging event, both liquidity and volatility can fluctuate significantly, making the bid-ask spread a vital factor to consider.
Figure 3 serves as a critical guide for traders to understand how the bid-ask spread can affect both the profitability and risk associated with trading. For example, if the spread is consistently wider during periods of high volatility, it becomes more challenging to execute large trades near the current market price without incurring significant costs. Ultimately, the trader faces increased expenses when attempting to capitalize on trading opportunities during such volatile periods.
To further elaborate on the relationship between the bid-ask spread and market conditions, Figure 3 includes a time series that shows how the spread changes over time, particularly in relation to market volatility. This additional layer of analysis demonstrates that the bid-ask spread tends to widen during periods of heightened market volatility, confirming the intuitive notion that it becomes riskier and potentially more costly to trade during such times. Notice how during nearly every depegging event, in Figure 3, the bid-ask spread widens amongst USDC/USDT on Bitfinex. The market withdraws liquidity during the depegging event, ultimately making it more expensive for traders to enter transactions.
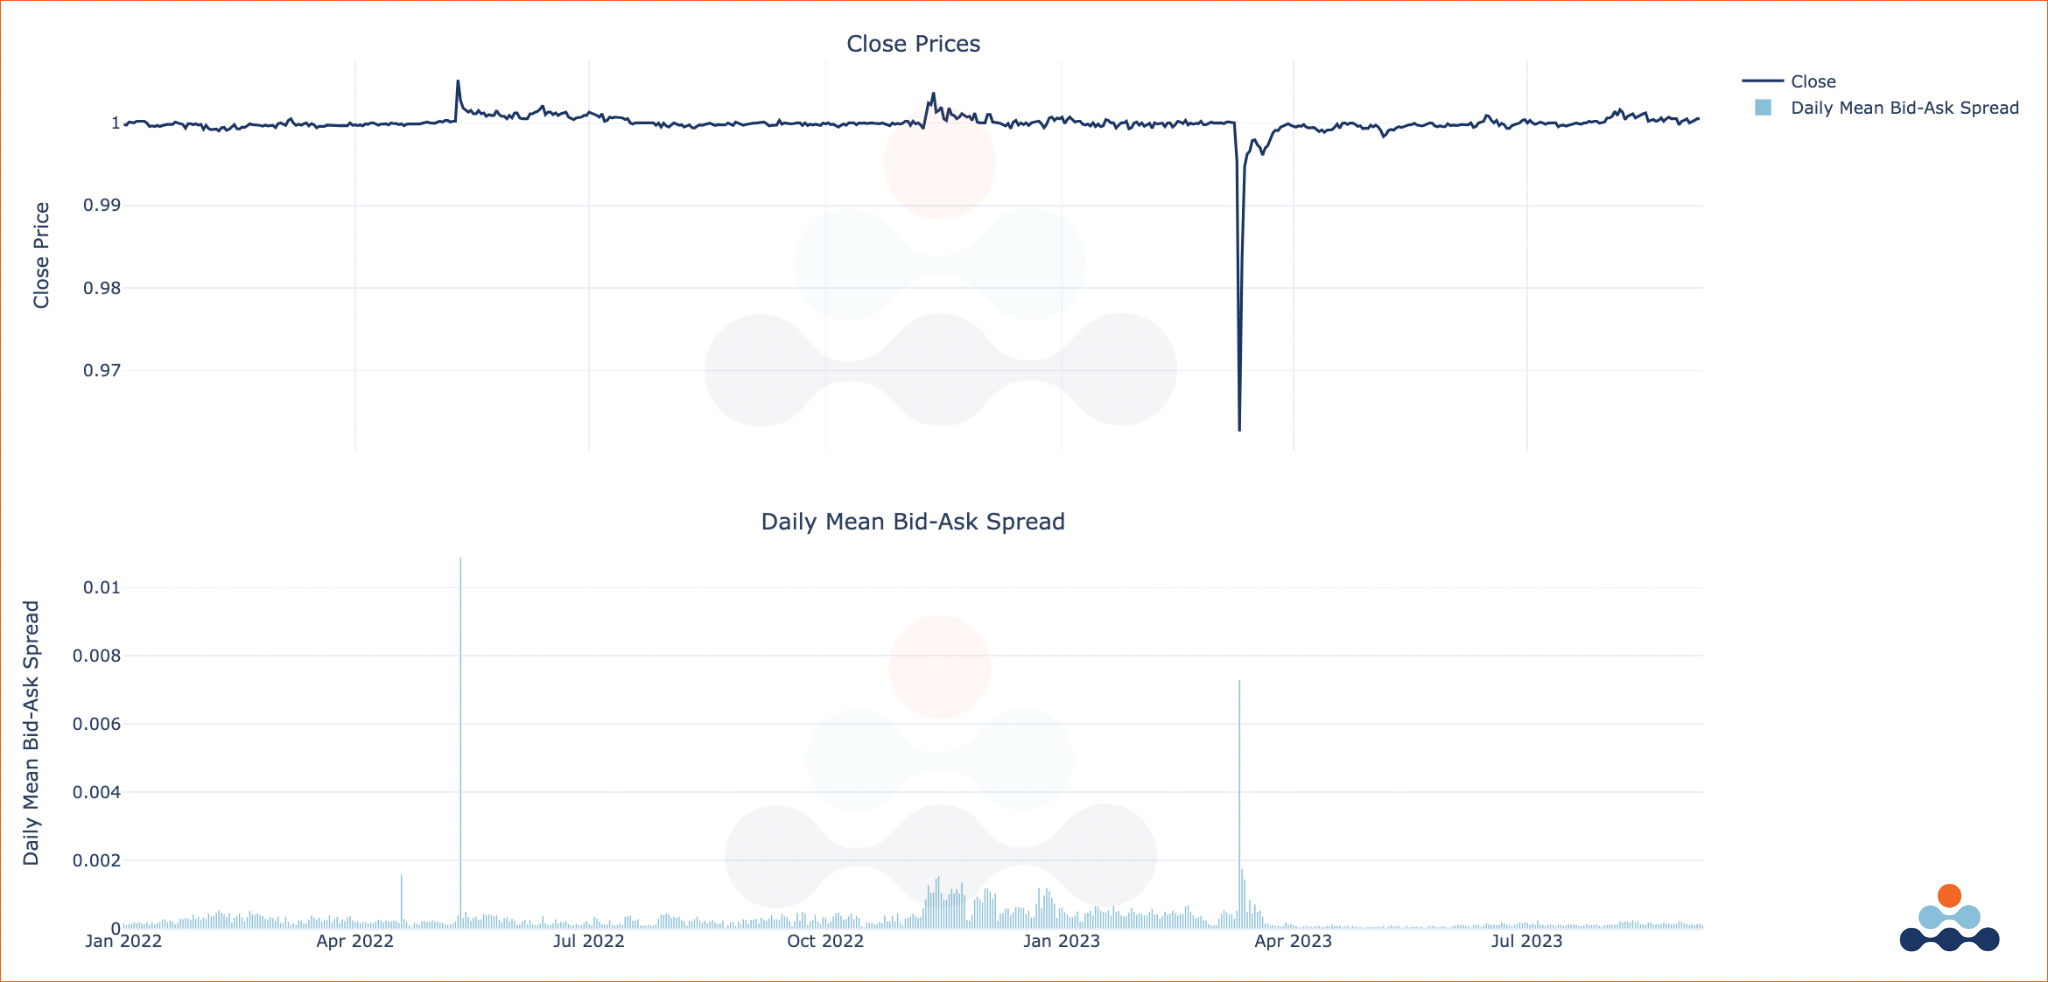 Figure 3 – USDC/USDT Close Prices and Daily Mean Bid-Ask Spread Over Time (Bitfinex)
Figure 4 provides a compelling visualization of the order book depth for stablecoins like USDC and USDT, particularly during depegging events. This heatmap offers an immediate grasp of market liquidity and trader sentiment at various price levels. By displaying the density of buy and sell orders in the order book, the heatmap allows traders to identify significant support and resistance levels, essential for crafting effective entry and exit strategies. The visual contrast becomes even more pronounced during depegging events, highlighting areas where the market is either absorbing the volatility or exacerbating it. By scrutinizing these dynamic shifts, traders can better understand the market's resilience or vulnerability at a glance, enabling them to make more informed decisions in an environment often fraught with rapid changes. Figure 4, shows one of the days where a depegging event occurred, and order book liquidity dried up as the depegging widened between USDC and USDT on Bitfinex. However, as the depeg stabilized at a local intra-day (1-min granularity) level, liquidity picked up across the order book and USDC/USDT embarked on its journey to converge back to their original level.
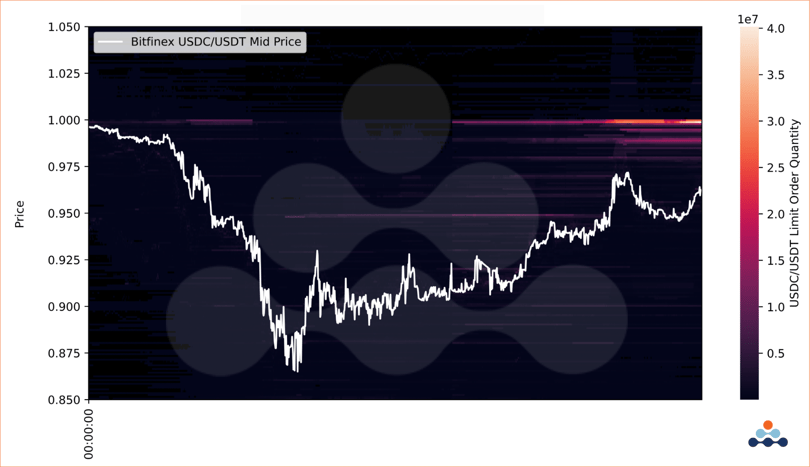
Figure 4 – USDC/USDT Order Book Heatmap (Bitfinex)
Conclusion
While the depegging events between stablecoins like USDC and USDT may appear as golden opportunities for traders, they are complex scenarios filled with lots of risks. There are multiple challenges: the difficulty in timing the market, the influence of trading volumes, transaction costs, and the ever-present risk of slippage. By carefully examining these elements, as illustrated in the figures in this report, traders can make more informed and nuanced decisions. This thorough understanding is vital for anyone looking to navigate the choppy waters of cryptocurrency trading during such volatile and unpredictable events.
Access to the Code
To further the understanding of this report, the Python code used for this analysis can be accessed from the following GitHub repository.
This Jupyter Notebook includes all the necessary code and comments to help you understand how the data was collected, the analysis performed, and how the visualizations were created. Feel free to explore, modify, and use this code as a basis for your investigations.
