Share this blog:

Just like for traditional financial instruments, measuring risk in stablecoins involves parameters such as volume, liquidity, and velocity. However, price is a metric especially geared toward a stablecoin’s unique characteristics.
Stablecoins should maintain a $1 USD peg, and when a stablecoin moves away from this value, it is said to have “lost its peg” or “depegged.” However, stablecoins often trade slightly above or below $1. So, how far away from the peg must a stablecoin deviate for it to be considered a depegging event? While there are multiple models, the price threshold varies.
Amberdata provides all of the price data necessary for models to monitor stablecoin health. Utilize the full history of a stablecoin’s price across major and longer-tail DEXs, or view stablecoins through our centralized exchange price endpoints with historical data going back as far as 2011. By combining DEX and CEX prices, you can get a macro view of a stablecoin.
Below are some of Amberdata’s endpoints that are helpful when querying stablecoin price data. To view a list of the centralized and decentralized exchanges we cover, please click here.
Centralized Exchanges
● Historical Open High Low Close Volume: https://docs.amberdata.io/reference/get-historical-ohlc
○ These endpoints show the OHLCV (1-minute candle) of every book on every supported centralized exchange.
● Historical VWAP: https://docs.amberdata.io/reference/spot-vwap-pairs-historical
○ See the volume weighted average of every book on every exchange we support, by pair or asset.
● Historical Prices: https://docs.amberdata.io/reference/spot-prices-pairs-historical
○ Unweighted prices, similar to the previous endpoint.
Decentralized Exchanges
● Historical Open High Low Close Volume: https://docs.amberdata.io/reference/defi-ohlcv-historical
○ The format and execution of our DeFi OHLCV endpoint are comparable to the centralized exchange version. Amberdata has pioneered the concept of DeFi OHLCV, since decentralized exchanges do not have a set end-of-day. This endpoint enables the ability to compare CEX and DEX OHLCV and understand stablecoin price and depegging variance.
● Historical VWAP: https://docs.amberdata.io/reference/dex-vwap-pairs-historical
○ This endpoint returns the full historical values for any pairs (pools) on any supported DEX.
Volume is another important metric that can be used for a stablecoin risk model. While weighted price endpoints mentioned above such as VWAP and OHLCV are also tools to assess stablecoin volume, here is a commonly used decentralized exchange endpoint:
DEX Metrics
● Pairs Historical: https://docs.amberdata.io/reference/defi-metrics-pairs-historical
○ Our DeFi historical data is derived from our blockchain data, giving you access to every event from the protocol’s creation on. With this endpoint, see volume data for any pool on a supported protocol, with volume units in USD and the native asset.
This endpoint is also available as the latest metric: https://docs.amberdata.io/reference/defi-metrics-pairs-latest
The liquidity of a stablecoin is also a key factor to investigate. Liquidity on centralized exchanges is straightforward to measure - simply look at the depth of an order book on one or many exchanges to calculate the liquidity. Amberdata offers the most granular order book data and also provides additional data points like tickers (top of the book), and reference quotes (the mid of the ticker).
Centralized Exchanges
● Events Historical: https://docs.amberdata.io/reference/order-book-updates
○ Every change in a book for every book, on all supported exchanges.
● Tickers Historical: https://docs.amberdata.io/reference/get-market-ticker-pair-historical
○ Includes the top of the book, BBO, best bid/best ask, and more.
● Reference Quote Historical:https://docs.amberdata.io/reference/spot-reference-quotes-historical
○ The mid of the ticker. See how tickers are calculated, and choose which exchanges you’d like in the equation.
Understanding liquidity in decentralized exchanges is more complex. It is difficult to gauge the depth of a book on nearly every DeFi protocol (aside from Uniswap v3) because there are no order books. Trades on DEXs consist of simply swapping one token for another. With Amberdata’s liquidity endpoints, you can determine the liquidity of a pool on a protocol by understanding the composition of a pool at a point in time. For example, by tracking the change in a pool like the wBTC_wETH pool on Uniswap v2, you can see amounts of each token, view liquidity price (the value of one token versus the other), and calculate slippage.
Decentralized Exchanges
● DEX - Liquidity Historical: https://docs.amberdata.io/reference/defi-liquidity-historical
○ View the full history of any pool’s composition and the liquidity price of each token.
Analyzing liquidity on Uniswap v3 is a different process from any other DEX protocol. Stablecoin pools should ideally trade within a very narrow range (ex. $0.99-1.01) since there should only be a slight variance from the $1 peg. In Uniswap v2, when liquidity providers added funds to a stablecoin pool, the liquidity would be spread across the entire price curve. As a result, liquidity outside the typical stablecoin range would not be earning fees. Uni v3, however, allows liquidity providers to allocate their liquidity within specific price curves to maximize fee-earning potential.
With Amberdata’s Uniswap v3 liquidity endpoint, see the distribution of liquidity for any given pool. See how much liquidity is available at every tick to understand where to allocate liquidity and conduct research on how liquidity has changed over time.
Decentralized Exchanges
● Uniswap V3 Liquidity Distribution: https://docs.amberdata.io/reference/uniswap-v3-liquidity-distribution
Finally, velocity is a useful metric for evaluating stablecoin risk. Velocity is calculated using the following formula: velocity = transfers/balances * prices), or more simply, transfers/circulating supply. This simplified equation is what we will use when looking at the transfers first. Velocity units represent the number of transfers relative to the current circulating supply, and the velocity number can be thought of as the number of transfers as a percentage of the circulating supply.
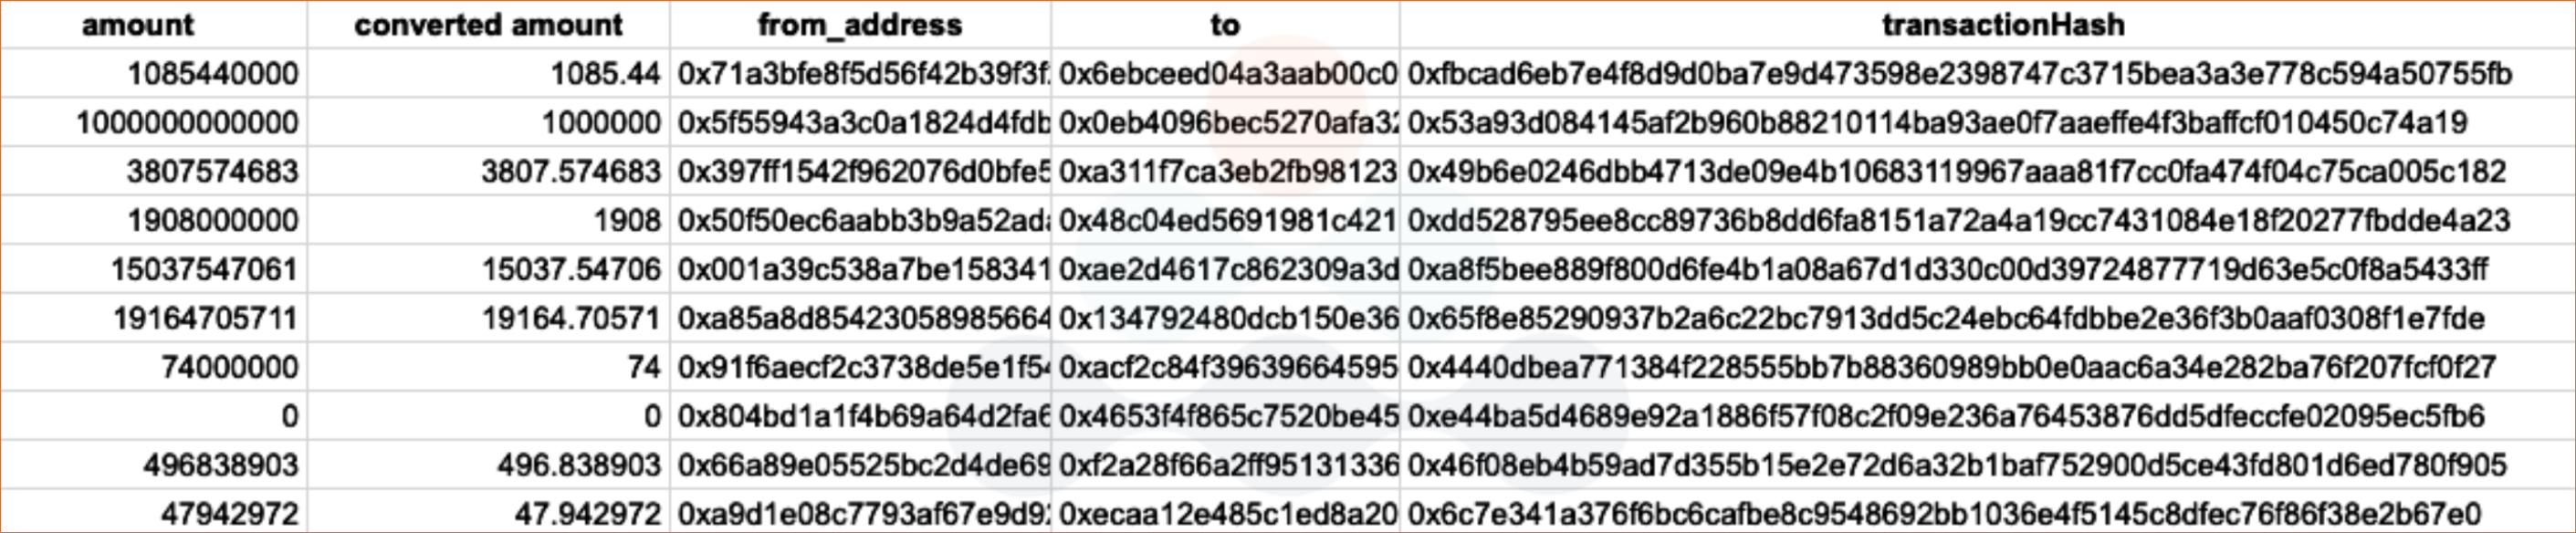
Transfers are similar to transactions, but only for tokens on a blockchain as opposed to its underlying asset (eg. ETH on Ethereum). By looking at the token transfer data, we can see exactly how many tokens of a stablecoin were transferred within any timeframe. To do this, start by using the token transfers endpoint with the USDC token contract (0xA0b86991c6218b36c1d19D4a2e9Eb0cE3606eB480). Since the data is so granular, it helps to choose a smaller time period such as one hour.
Running the following query returns the 10 latest token transfers involving USDC, including the to/from addresses, amounts, transaction (tx) hash, block, timestamp, and more:
We can do a quick conversion for the amounts (displayed in wei) by dividing it by 1,000,000, which gives us the number of tokens transferred for each transaction hash.
 Note: This is the CSV option in the API query into a Google Sheet.
Now, we can sum up the converted amounts to get a total amount transferred of 1041622.049 and round that down to the nearest integer. For the second part of the formula, we can use Amberdata’s supply latest endpoint to find the circulating supply. Amberdata also has a historical supply endpoint.
Next, we can run this query: https://web3api.io/api/v2/market/metrics/usdc/supply/latest
We get a circulating supply of 27601637564.5061, which we can round to 27601637564. Applying the equation above, we can see that the USDC token velocity for this timeframe is 1041622 / 27601637564 = 0.00003773768848. This number alone does not tell us much. However, calculating velocity over an extended period of time and comparing hourly, daily, and weekly values shows how the velocity changes over time.
To learn more about Amberdata’s stablecoin data and research, please contact us at hello@amberdata.io or schedule a demo here.
