Share this blog:
Introduction
With the right strategy, providing liquidity on a decentralized exchange (DEX) can yield lucrative rewards. Uniswap is a DEX that uses paired assets as automated market makers (AMM) and is regulated by a constant product formula. In Uniswap Version 2 (Uni v2), liquidity is evenly distributed and liquidity providers (LPs) only earn fees on a small portion of their capital. This can increase impermanent loss and slippage as liquidity providers are stretched further across volatile prices.
In our previous liquidity provider strategy research, we backtested a trading strategy on the Uni v2 ETH_USDC pool and examined our performance in market conditions such as uptrend, downtrend, choppy, and volatile environments. In this strategy, we provided liquidity to a single Uni v2 pool and calculated impermanent loss after the position was closed. Once the trade was initiated, the liquidity provider position did not change. After analyzing our backtested results, we learned that providing liquidity on Uniswap v2 was a profitable approach in choppy and downtrend market conditions and did not have significant differences from holding the assets during upward trends. However, our last strategy took losses when the market was extremely volatile.
Volatility-Based Strategies
Although providing liquidity without changing pool positions is beneficial in certain climates, when the price of an asset drops dramatically, an LP is at risk of suffering from large amounts of impermanent loss. Thus, building a preventative strategy that allows LPs to provide liquidity based on market conditions is very important for success. Volatility-based strategies allow liquidity providers to earn fees with minimal losses by closing positions when the market is volatile and re-providing liquidity when the market is stable. Based on set parameters, the strategy should be capable of providing liquidity, deciding when to close out, rebalancing its position, and calculating impermanent loss for every trade within the selected time period.
But, can volatility-based strategies help improve our returns? One pro is that using volatility as a strategy is like insurance - if a liquidity provider can close out their position when the market is still stable, they can avoid losing large amounts of money. Liquidity providers using a volatility-based strategy can also get their money out of pools faster than other LPs. Take the November 2022 FTX crash for an example. If an LP supplied liquidity during that period of intense volatility, they suffered huge impermanent losses, but if the LP was using a volatility strategy they could’ve detected volatility much earlier and minimized their losses.
There are some downfalls of volatility-based strategies. First, the volatility index is a lagging indicator rather than a predictive one. This means that it only starts to create a useful signal when the market is already volatile. Because of this, there is a high likelihood that a liquidity provider will suffer larger amounts of impermanent loss for each trade for which it provides liquidity. However, this strategy still mitigates major losses from big price movements and market crashes. In Figure 1 below, it is clear that if there is a huge increase or decrease in price from the original price, the LP will suffer more impermanent loss. Removing liquidity during a volatility spike is preferable to small losses from price changes.
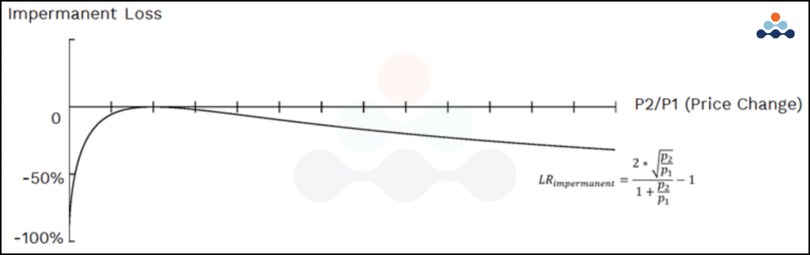 Figure 1: Graph of impermanent loss equation.
So, while volatility-based strategies may come with cons, they allow LPs to close out their positions when the market becomes extremely unstable to avoid losing large amounts of money. However, because they are risk mitigation strategies, they are generally used concurrently with other more profitable approaches.
Designing a Rebalancing Framework
Volatility strategies help mitigate risk, but designing them can be relatively complex. The Uniswap automated market making (AMM) function is represented in the equation X*Y = K, where X denotes the total USDC amount our LP provides, Y represents the total ETH amount our LP provides, and k represents liquidity. When a liquidity provider initially provides funds (50% ETH and 50% USDC), the price changes when any event such as a mint, burn, or swap happens within the pool. These events also change the ratio between the ETH and USDC and the total amount of the LP's assets. In a traditional trading strategy, every trade position’s PnL is solely dependent on entry and exit price, but LP positions depend on trading fees and impermanent loss. This is why it is necessary to find the LP’s position from initial to end and calculate the fees and impermanent loss for every trade - Univ2 requires LPs to maintain 50/50 ratio of two assets, so to reenter a pool, an LP must swap to match that requirement every time they re-enter the market.
In order to form a volatility LP strategy, four steps are needed:
1. An LP needs to provide the initial capital into the pool - in our case, half USDC and half ETH.
2. When the volatility increases, the LP needs to close their position and stop providing liquidity.
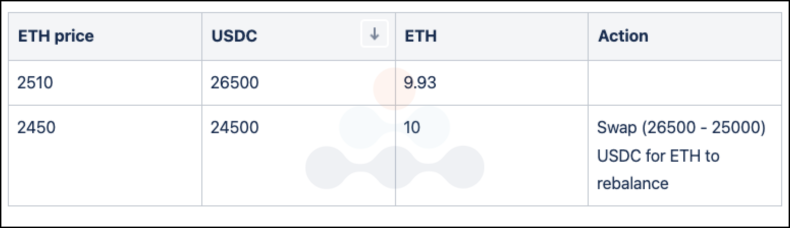
3. After the LP closes their position, they must swap assets to rebalance liquidity and maintain a 50/50 ratio between the two pairs.
4. The LP is then able to re-provide liquidity and initiate a new trade based on the volatility signal.
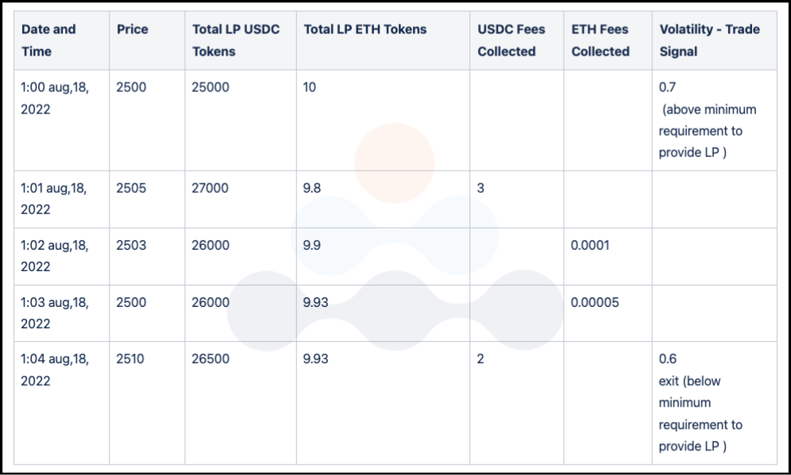
Because we are using price movement as a trading signal, we must provide liquidity based on the values we set. Below is an example of the steps.
Step One:
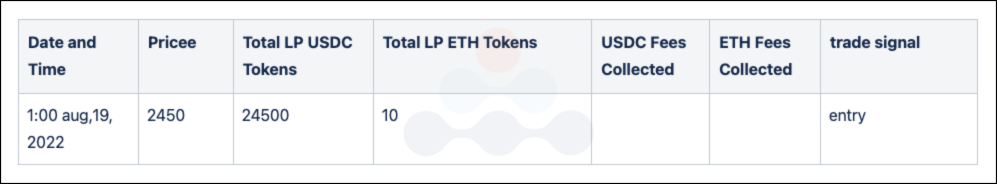
Based on a trading signal to enter and exit the market, our bot creates the initial LP position with 10 ETH and 25000 USDC
The bot rebalances its LP tokens to a 50/50 ratio after the previous position is closed.
Step Three:
The bot re-provides liquidity based on new market conditions.
After this, the bot loops back to Step One and the strategy continues.
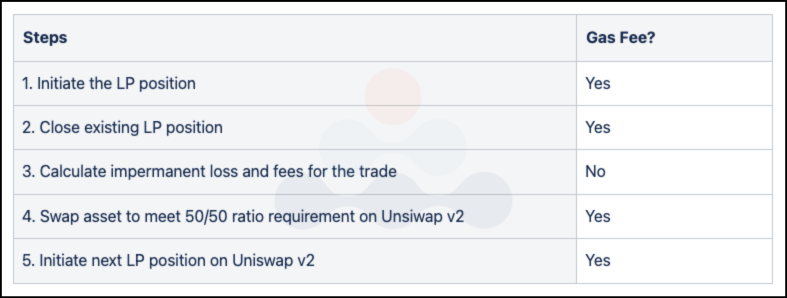
In summary, here is each step and whether it requires a gas fee.
Rebalancing Funds on Uniswap v2
Shown in Figure 2 below are three dashboards. Our volatility strategy is based on price volatility, and the bot we built can provide liquidity or close its positions multiple times depending on the market conditions. In order to gauge the strategy’s efficacy, we compared our LP returns to a simulated half-holder or someone who holds an even split of ETH and USDC. This is because in order to provide liquidity in a pool on Uni v2, an asset holder must split their tokens 50/50 - in our case, into half ETH and half USDC.
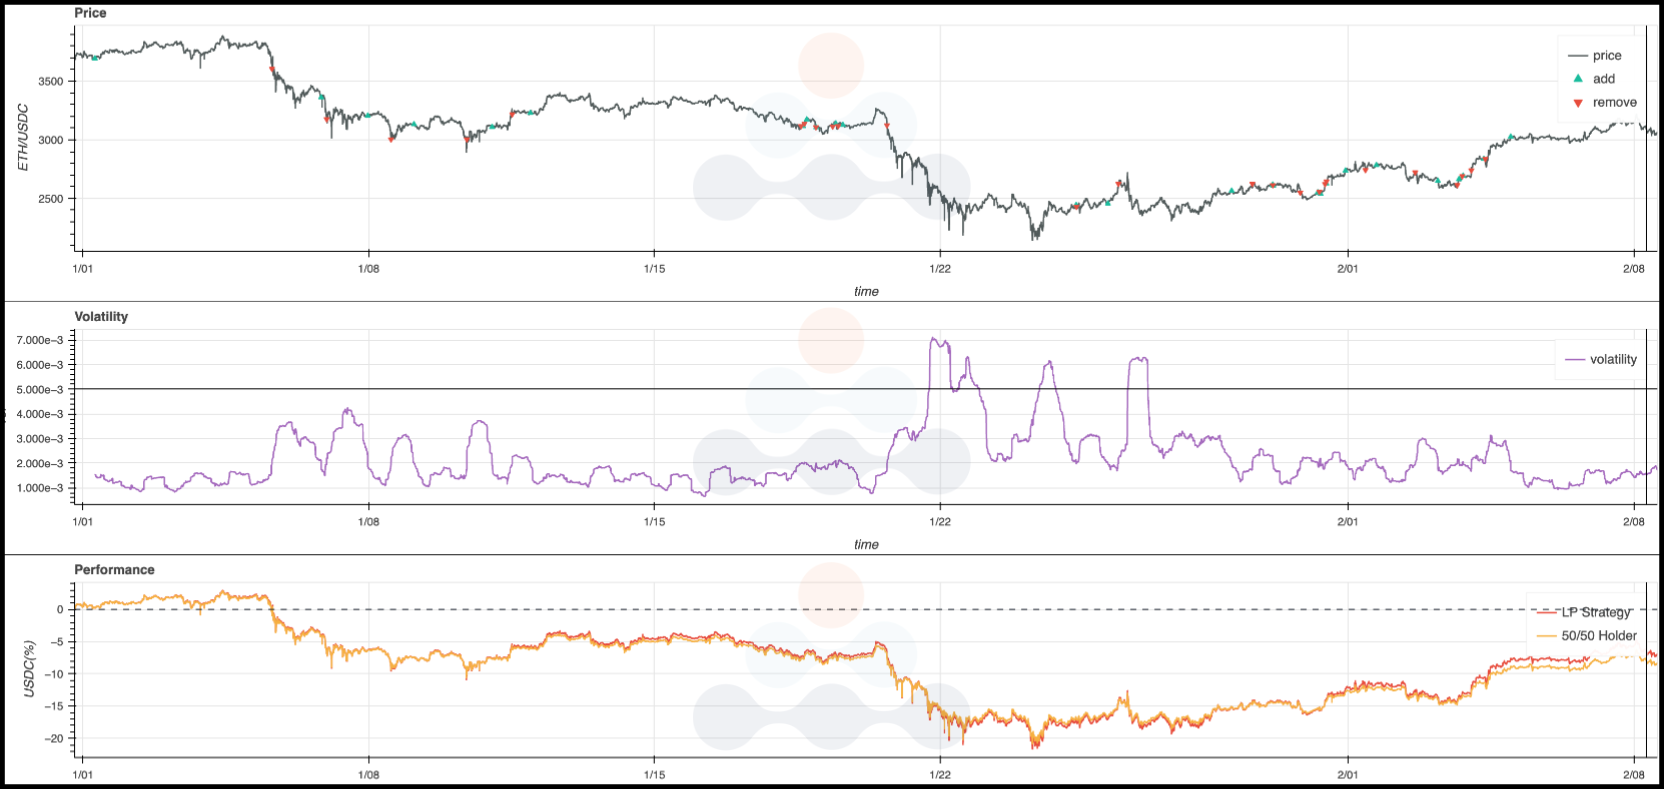 Figure 2: Volatility-based LP strategy performance.
The first dashboard illustrates the steady decline in the price of ETH (in USDC) from January 2022 to February 2022. The triangles on the trendlines represent liquidity provider actions - a green triangle indicates when an LP providing liquidity and a red triangle indicates when an LP removes their position. The second dashboard shows the volatility metrics based on the price of ETH. It is calculated using the standard deviation of the price movement. The formula used in backtest code is listed below:
price_difference = (log (current_price) - log(previous_price (5 minutes ago))
price_volatility_metric = standard-deviation(price_difference)
The third dashboard in Figure 2 illustrates the profit difference between an LP and an ETH holder. The red line on the graph represents the LP volatility strategy we will be backtesting, while the yellow line represents a 50/50 holders strategy - meaning the liquidity provider uses half of their ETH to provide liquidity and holds the rest. When the red line is above the orange line, it indicates that the LP volatility strategy outperforms the holder.
Our strategy uses volatility as an indicator to decide when to provide liquidity. By leveraging Amberdata’s Liquidity Snapshots endpoints, we were able to get the standard deviation of price (every mint/burn/swap within the pool) in logarithm format to accurately calculate price and impermanent loss. This helps us see if the volatility is increasing or decreasing.
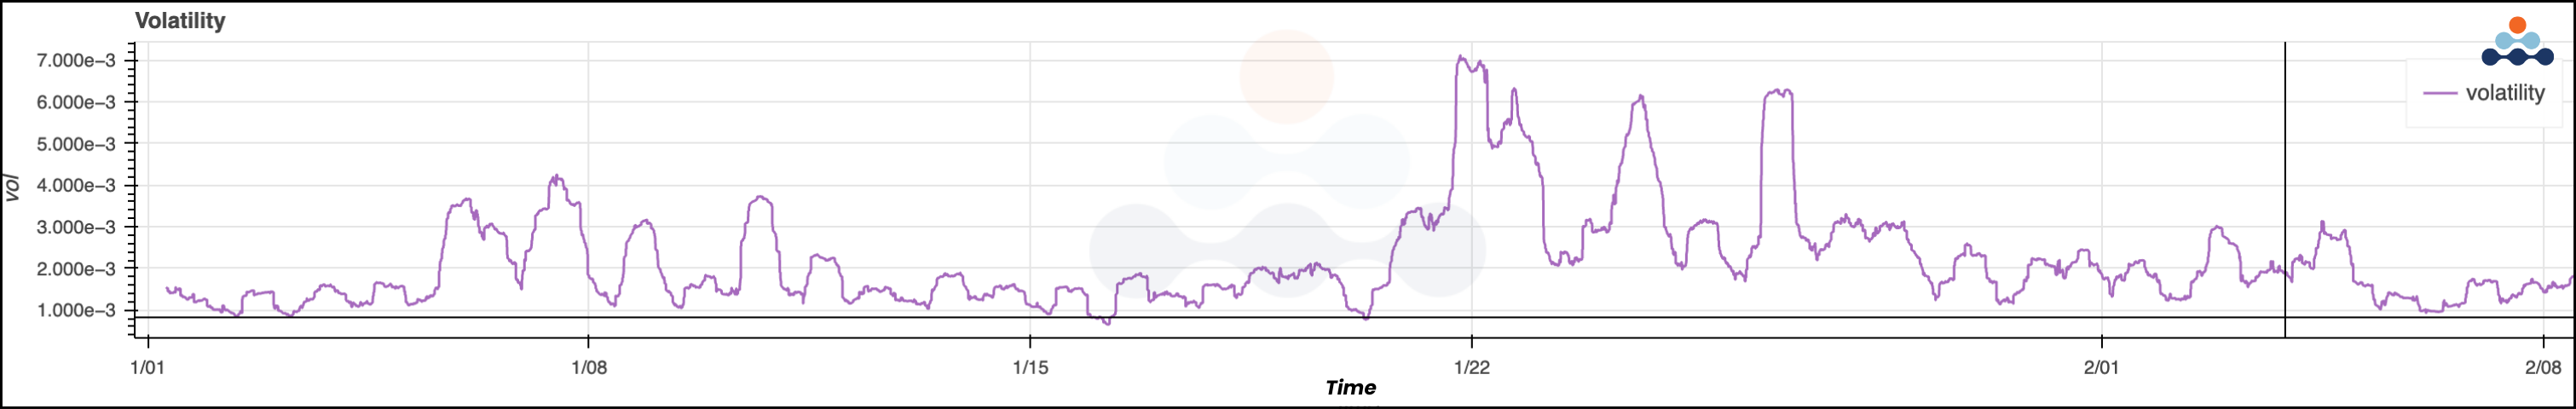 Figure 3: Volatile period used to backtest our LP strategy’s volatility point.
Figure 3 above shows the price volatility of the ETH_USDC pool. We used backtested results to set a proper volatility point to decide when to provide liquidity and when to close our position. To formally test for a volatility point, we recommend using approaches such as a Bayesian Optimization or a grid search to obtain optimal results. You can find further explanations in this essay here.
Providing Liquidity in Varying Market Conditions
To determine how our volatility strategy’s profits and losses were affected in varying climates, we backtested multiple different market conditions: uptrend, downtrend, volatile, and choppy. As discussed previously, our customized backtesting framework was designed to calculate the LP’s fees and impermanent loss for every pool position change, rebalance the assets of provider positions to provide liquidity once the previous position was closed, and react to market conditions based on a volatility signal. You can find the code for our strategy here.
Uptrend Market Analysis
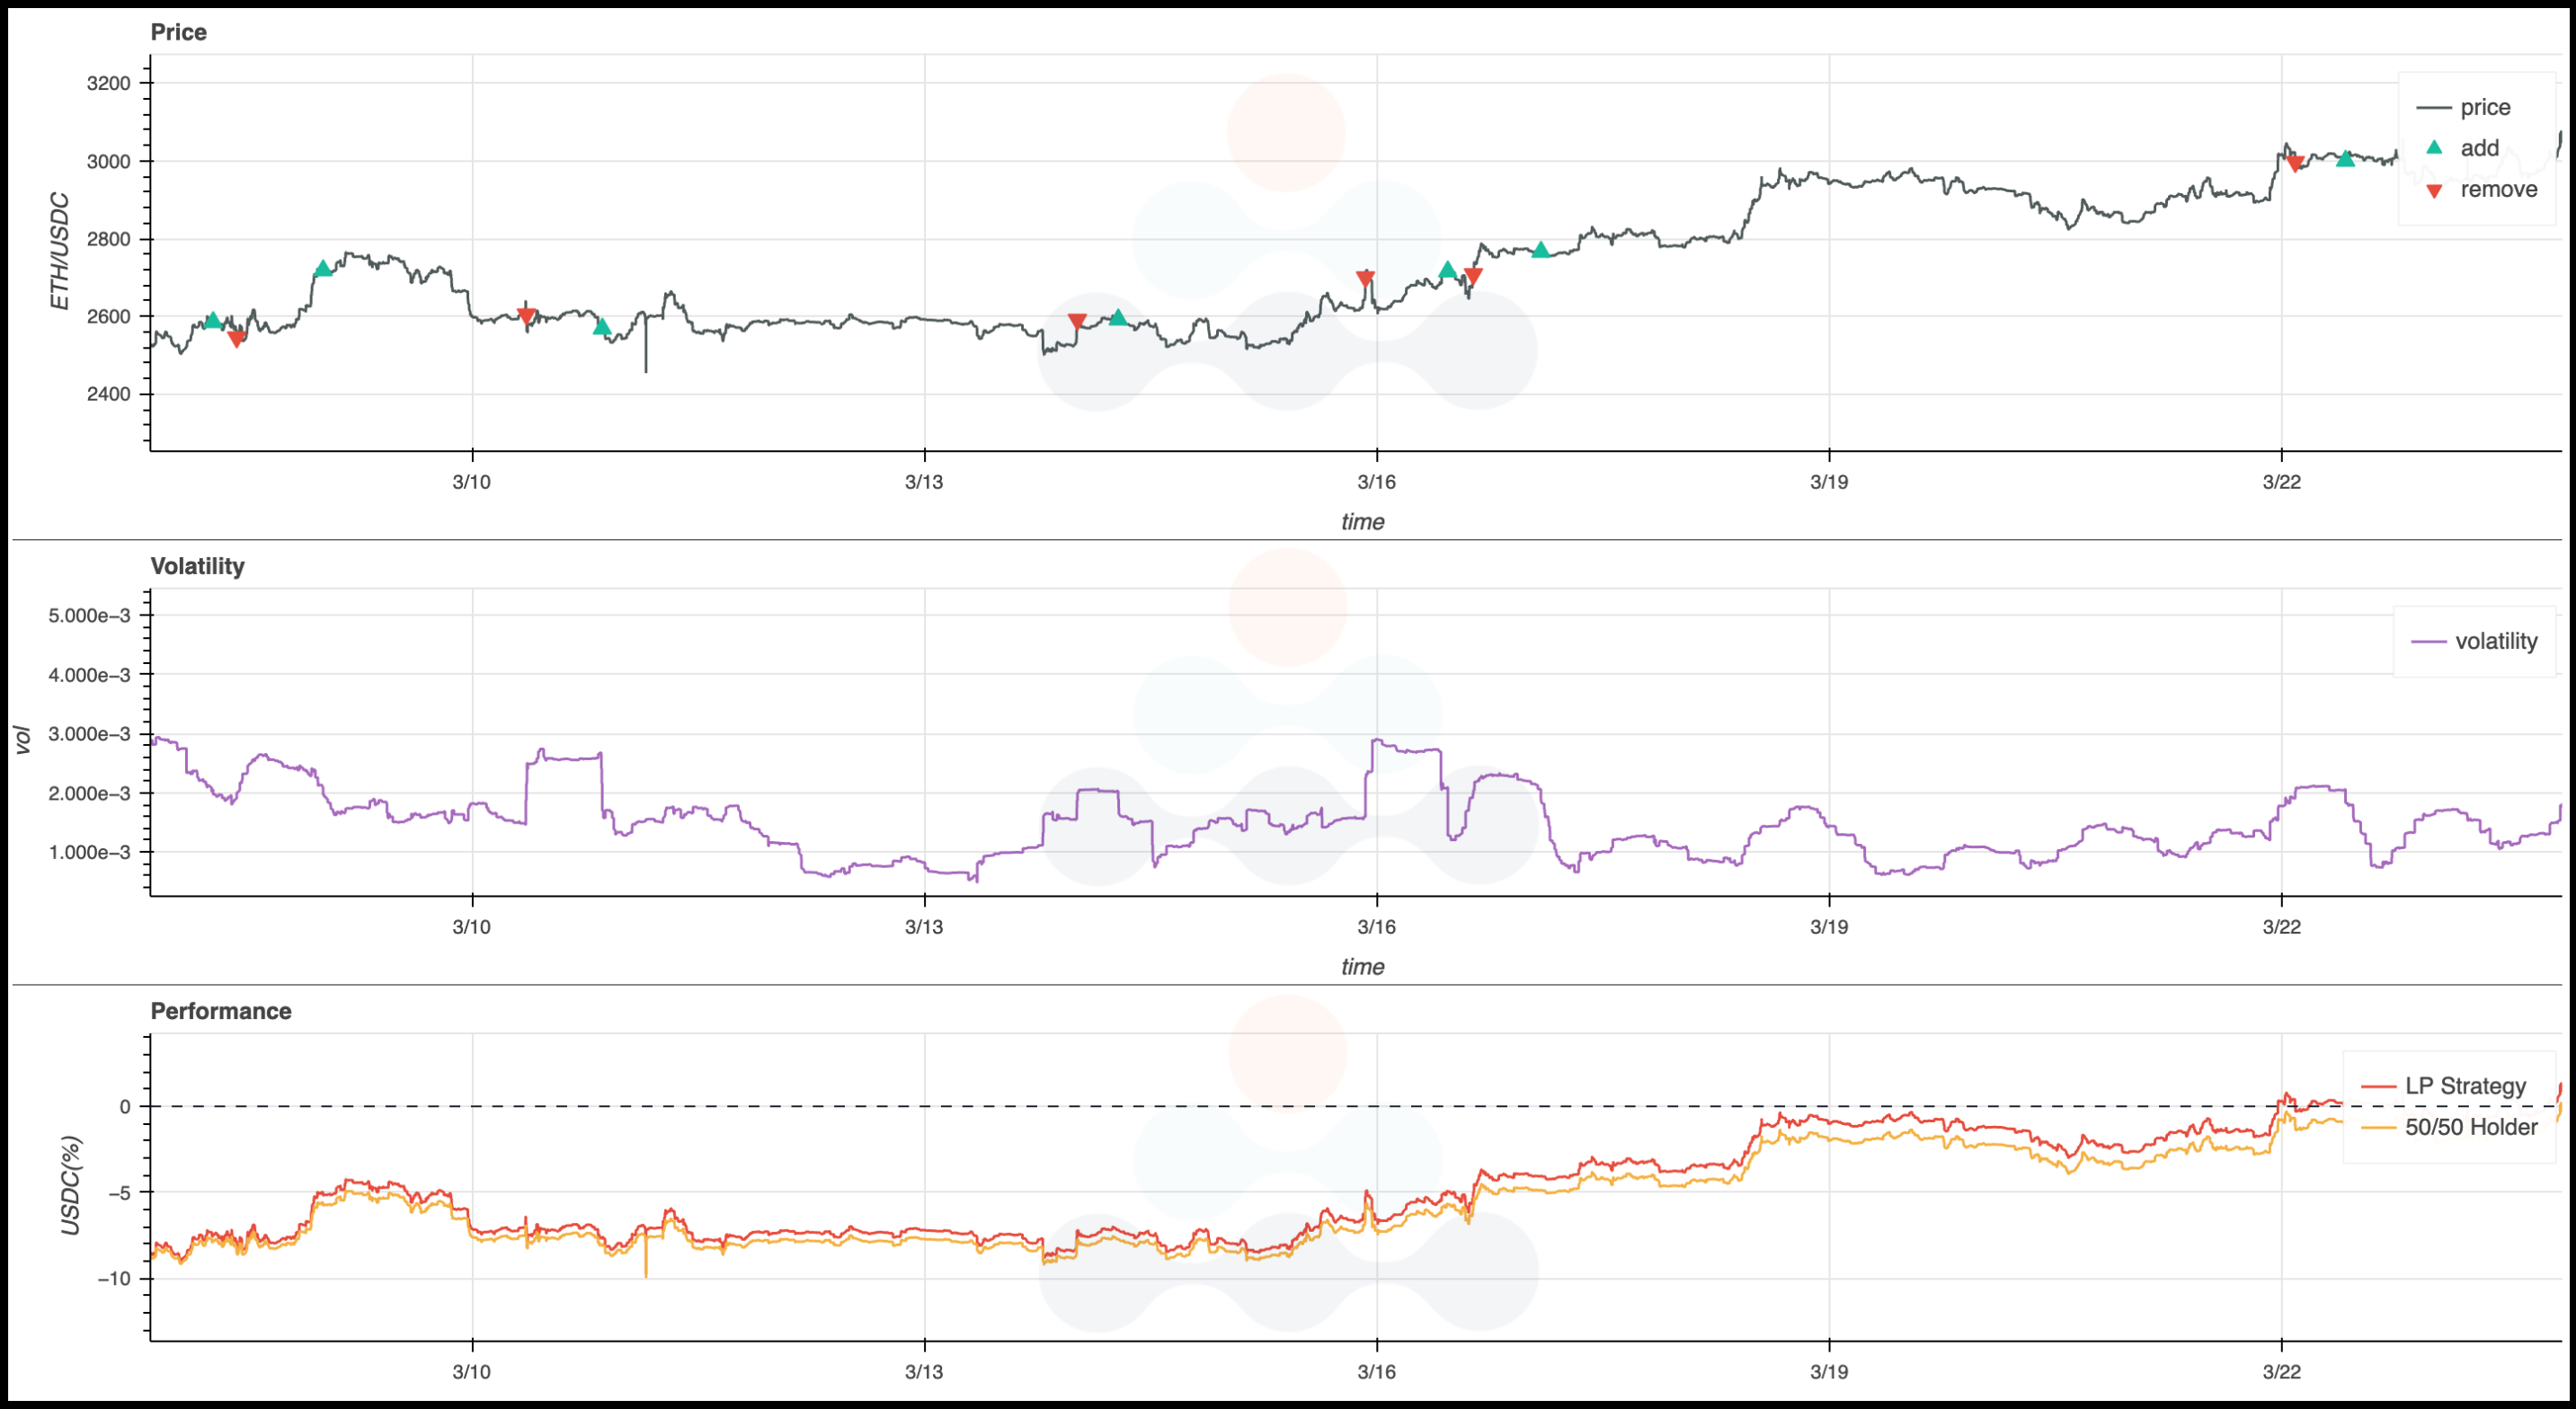 Figure 4: Volatility LP strategy in uptrend markets.
Figure 4 illustrates the steady increase in the price of ETH in USDC during March of 2022. On the price graph, the green triangle indicates the LP providing liquidity while the red one is when the LP removes their funds. For every trade entrance and exit, our bot will automatically rebalance its position to a 50/50 ratio so it can provide liquidity on Uniswap v2.
Below the price graph is a chart illustrating the volatility metrics based on the price of ETH. This is calculated using the standard deviation of the price movement in a logarithmic format. During this uptrend market, there were still small spikes of volatility, and our liquidity provider strategy responded to each of these to add and remove liquidity when required.
The final chart shows the volatility bot’s performance in an uptrend market, with the red line denoting our strategy and the yellow comparing against a user simply holding half USDC and half ETH.
Our volatility boy placed six trades in a month and beat the half-holder by about 1% in profit. Every time the price of ETH went up dramatically, the bot detected the market movement and closed its position. In an uptrend market like this, when a bot closes out and swaps the necessary amount of USDC to ETH to rebalance the 50/50 ratio, the funds will increase in total value as the ETH price goes up. Thus, our volatility strategy beat the 50/50 holder in these market conditions.
Downtrend Market Analysis
Now, let’s take a look at how our LP strategy performed in downtrend market conditions. Within a two-month test period from April to June of 2022, the price of ETH dropped 33% from 3,000 USDC to 1,750 USDC.
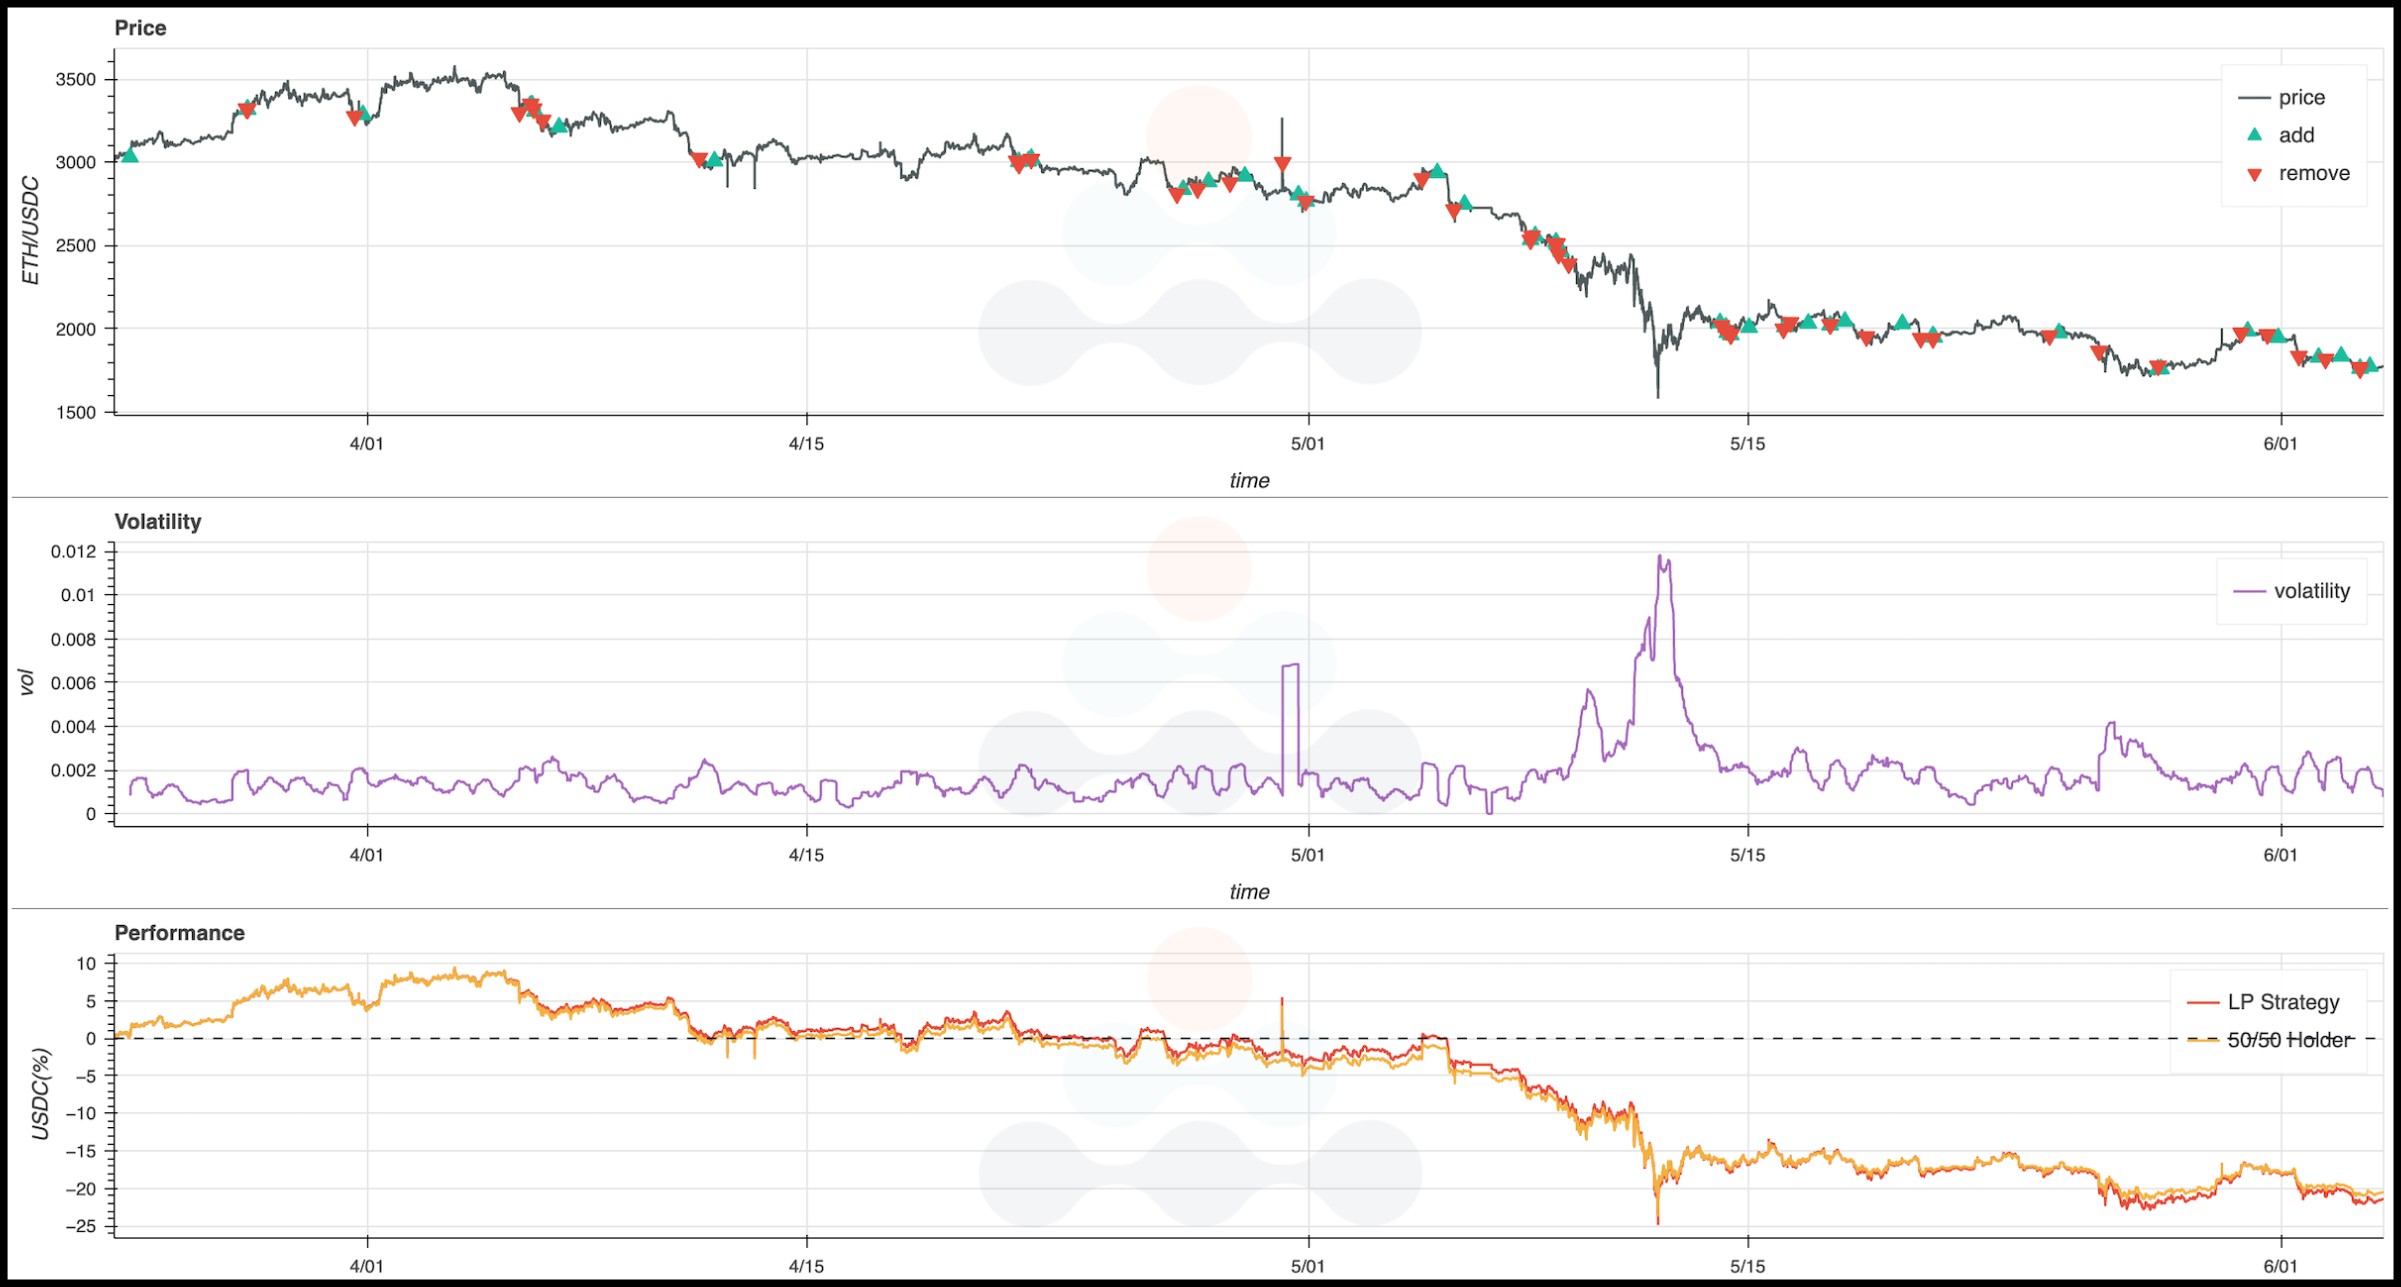 Figure 5: Volatility LP strategy in downtrend markets.
In downtrend markets, our bot got in and out of trades frequently as the price fluctuated during the sixty-day test period. On the surface, our LP volatility strategy had a similar performance compared to the 50/50 holder. However, it is important to remember that because each trade involves multiple steps requiring gas fees, the volatility strategy likely costs more than the 50/50 holder.
Volatile Market Analysis
So far, our volatility trading strategy performed better than a 50/50 holder in uptrend markets and had a similar performance to the 50/50 holder when the market was on a downtrend. Now, let’s look at our strategy in extreme market conditions and see if removing liquidity during major price swings helped us avoid huge impermanent losses. For this backtest period, we chose a tumultuous two days in 2022 (1/20-1/22), where the price of ETH dropped dramatically from 3200 USDC to 2400 USDC - a 25% loss.
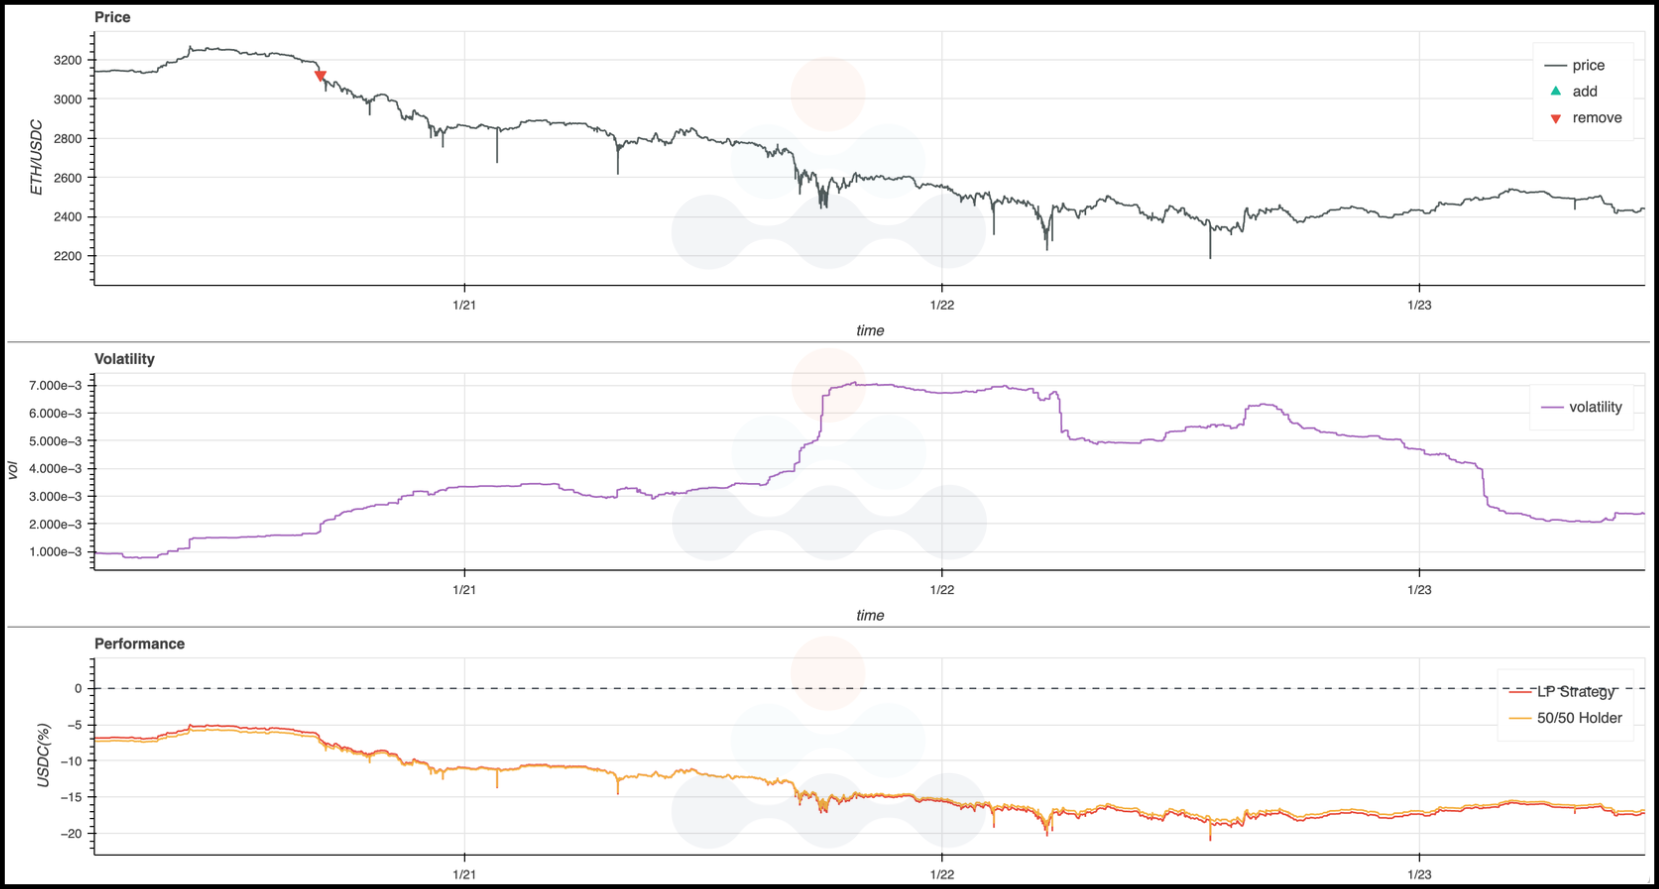 Figure 6: Volatility LP Strategy during extreme volatility.
In the price chart in Figure 6 above, the red arrow represents when we removed liquidity from the ETH_USDC pool. Our bot was able to detect the huge price swing and stop providing liquidity when the volatility began. As a result, we avoided a potentially huge impermanent loss and had very similar profits to the 50/50 holder. Rather than continuing to keep liquidity in a pool and risking our funds, removing liquidity as the volatility started reduced a potentially large amount of impermanent loss and gas fee accumulation.
Choppy Market Analysis
Choppy market conditions refer to when the market frequently swings up and down but has no apparent trend. As you can see from Figure 7, although the price of ETH is increasing and decreasing, its overall movement oscillates around $2.8k.
 Figure 7: Volatility LP Strategy during choppy markets.
Because the market was fluctuating rapidly, our bot entered and exited the ETH_USDC pool over sixty times to rebalance our portfolio. Looking at the performance chart, the LP matched or slightly beat the 50/50 holder, and as the volatility increased the difference increased with it. This could be because when our bot removed liquidity, we minimized potential damages from changes in price and its resulting impermanent loss. Another explanation for our positive LP performance could be the continuous accumulation of collected fees as the value of the ETH increased. However, it is important to consider the potential costs of gas fees. Our bot added and removed liquidity much too frequently in the choppy market, and spending funds on rebalancing liquidity over and over could be a huge burden for a retail user.
Backtesting Summary
We now have tested multiple market scenarios including upward trend, downward trend, volatile, and choppy market conditions. Here is a summary of what we have found:
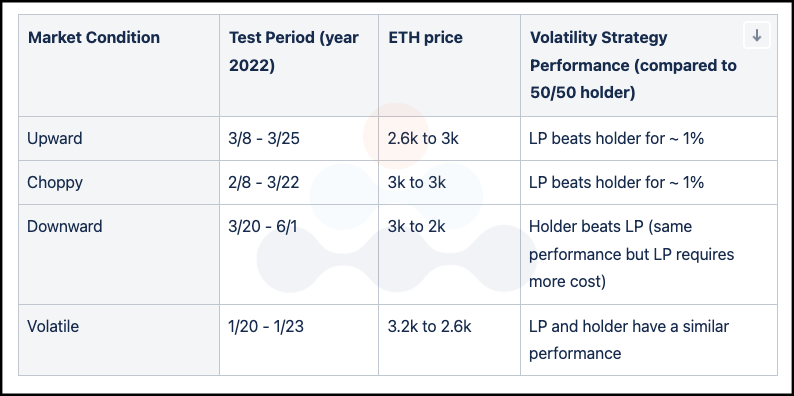
Our volatility strategy showed a better performance than a 50/50 holder during both upward and choppy markets and beat the holder by about 1%. In volatile market conditions, our strategy was able to detect extreme price movements quickly, allowing our bot to stop providing liquidity and help us mitigate impermanent loss.
Though our strategy sacrificed profits in choppy and downtrend market conditions by adding and removing liquidity frequently, this strategy illustrates a low-risk LP approach that especially helps mitigate deep losses during extreme markets. As dramatic price dips are par-for-the-course in crypto, a volatility-based strategy may come in handy to indicate when it’s best to simply hold assets rather than provide liquidity.
Our code can be found here.
To download the full report, click here.
