Share this blog:
For institutional traders and investors, understanding and navigating the spot market is crucial for making timely and informed investment decisions. Amberdata’s market intelligence platform, AmberLens plays a pivotal role in this context by offering real-time insights into the spot market, enabling users to track vital metrics such as trading volumes, market share, and price movements. This real-time data is indispensable for institutional traders, as it helps them assess market conditions, identify trends, and execute strategies with greater precision and confidence.
Key Metrics and Chart
Volume Traded (USD)
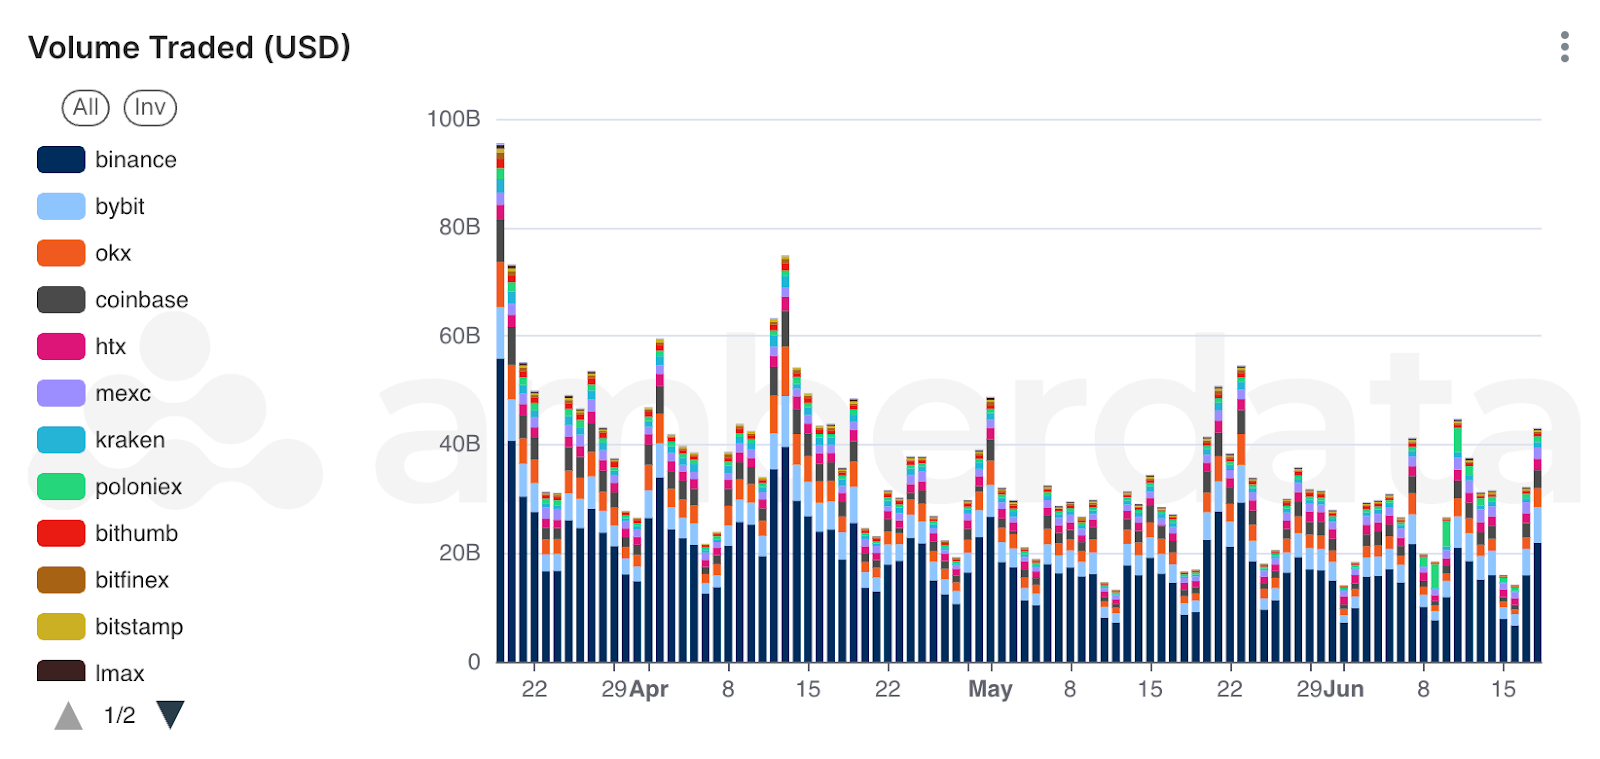
Volume (USD) in the context of Bitcoin and other crypto refers to the total amount of a particular cryptocurrency traded within a specific period, typically 24 hours, solely expressed in US dollars. Within AmberLens, this metric is crucial as it indicates succinct market activity, often accompanies significant price movements, helps identify market trends, reflects liquidity, and compares Bitcoin and crypto across days, months, and even years.
Considering volume alongside other metrics like price changes and market capitalization is essential for a more comprehensive view of crypto market behavior. Higher volume generally indicates better liquidity, meaning buying or selling large amounts is easier without significantly affecting the price. Lower volume generally indicates poorer liquidity, meaning buying or selling large amounts is more complex and likely to affect the price significantly.
By carefully analyzing this metric with other vital indicators, market participants can make more informed decisions and better navigate the often volatile world of Bitcoin and other crypto. As the crypto market grows, Volume (USD) remains a fundamental tool for assessing market health and activity across various timescales.
The chart above illustrates the volume traded (in USD) across various cryptocurrency exchanges over a period from late April to mid-June 2024. Binance consistently shows the highest trading volumes, indicating its dominance in market liquidity and trader preference. Significant peaks around mid-May and early June suggest periods of heightened trading activity, possibly due to market events or price volatility.
Exchange Trading Volume Market Share
The Exchange Trading Volume Market Share metric tracks the volume of trades executed on various exchanges, providing a clear picture of market dominance and liquidity across different platforms. By understanding which exchanges have the highest trading volumes, institutional traders can gauge the reliability and robustness of these platforms. A higher market share typically indicates a more liquid and active exchange, making it a preferred choice for executing large trades without significant price impact. This metric is crucial for assessing the competitive landscape and identifying the most influential exchanges in the market.
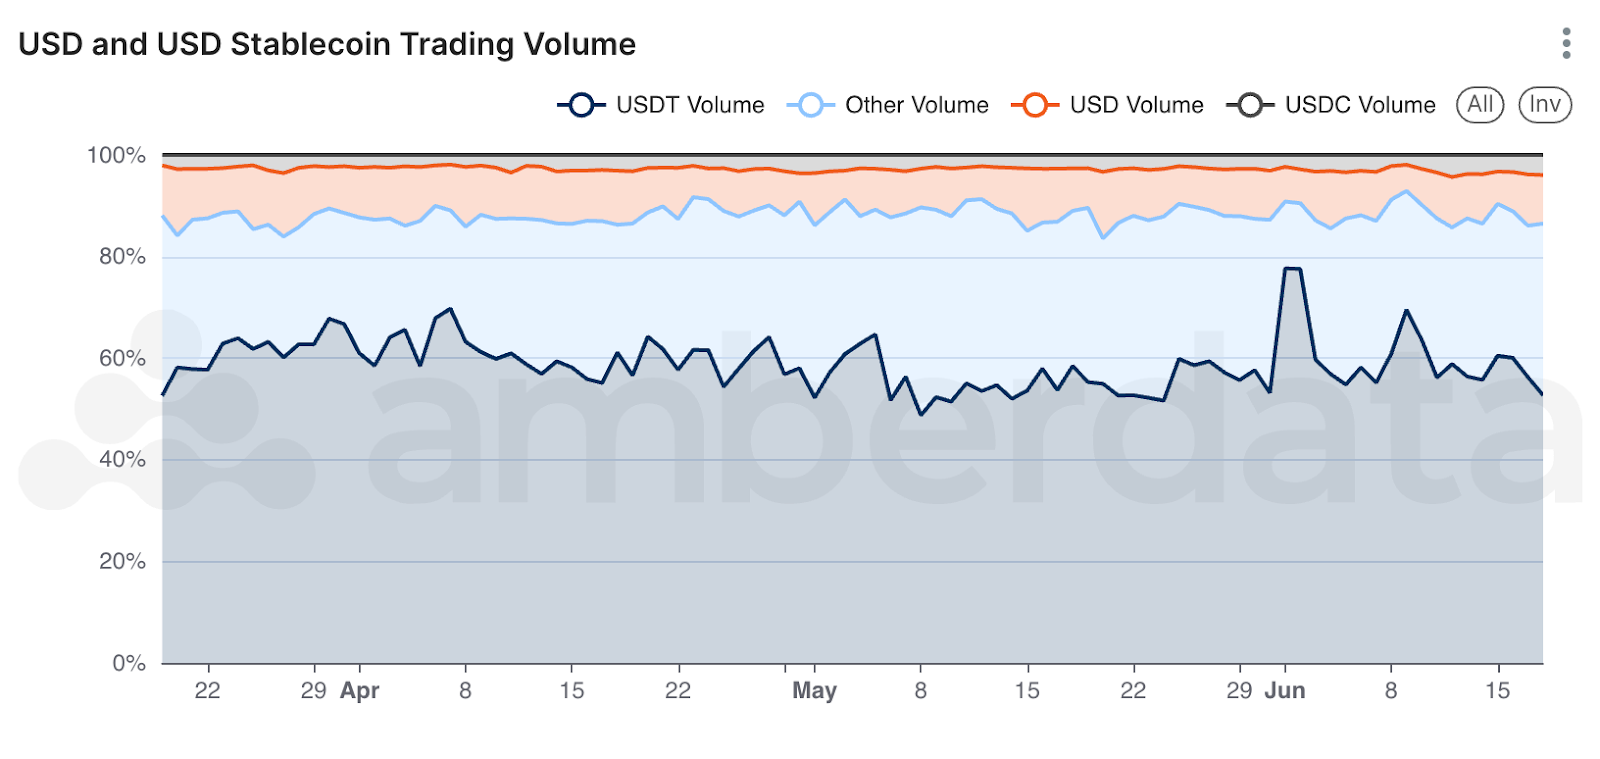
USD and USD Stablecoin Trading Volume
The USD and USD Stablecoin Trading Volume metric captures the trading volumes of stablecoins like USDT, USDC, and others. Monitoring these volumes helps in understanding the stability and behavior of the market, as trading with stablecoins is often a preferred choice during volatile periods due to their pegged value to fiat currency. High trading volumes in USD and stablecoins can indicate a strong demand for stability and liquidity in the market. For institutional investors, this data is essential for evaluating market sentiment and making strategic decisions based on the flow of stable assets within the crypto ecosystem.
Volume Traded (USDT) by Pair and USDT Pairs Percentage of Volume Traded
The Volume Traded (USDT) by Pair and USDT Pairs Percentage of Volume Traded metrics provide insights into the popularity and trading activity of different token pairs. By analyzing these metrics, traders can identify which cryptocurrencies are most frequently traded against USDT, a widely used stablecoin. This information is crucial for understanding market dynamics and the relative demand for different tokens. High trading volumes in specific pairs can indicate strong market interest and potential liquidity advantages, which are critical for efficient trading strategies.
Frequently Traded Tokens Volume Traded Exchange Market Share
The Frequently Traded Tokens Volume Traded Exchange Market Share metric helps identify the most popular cryptocurrencies and their share of the overall trading volume on exchanges. By understanding which tokens are most frequently traded, institutional investors can gain insights into market trends and trader preferences.
High trading volumes and significant market share often correlate with higher liquidity and reduced trading costs, making these tokens attractive for large-scale trading activities. This metric is invaluable for informing investment strategies and optimizing portfolio allocations based on the most active and liquid assets in the market.
By analyzing key metrics such as Exchange Trading Volume Market Share, USD and USD Stablecoin Trading Volume, Volume Traded (USDT) by Pair, and Frequently Traded Tokens Volume Traded Exchange Market Share, institutional investors can gain a comprehensive snapshot of the current spot market and its historical trends.
- Exchange Trading Volume Market Share reveals which platforms dominate trading activity, indicating where liquidity is concentrated.
- USD and USD Stablecoin Trading Volume highlights market stability and investor behavior, showing preference for stablecoins during volatile periods.
- Volume Traded (USDT) by Pair provides insights into the popularity and trading activity of specific cryptocurrencies, guiding strategic trading decisions.
- Frequently Traded Tokens Volume Traded Exchange Market Share identifies the most liquid and actively traded tokens, helping investors optimize their portfolios based on the most reliable and cost-effective assets.
Collectively, these metrics offer a detailed view of market dynamics, enabling informed decision-making and strategic planning.
Final Thoughts
Spot trading data is crucial for institutional investors to make informed and timely decisions, as it provides immediate insights into market conditions, liquidity, and trading activity. AmberLens offers exceptional value by delivering comprehensive analytics, metrics and actionable insights, enabling traders to analyze key metrics such as trading volumes, market share, and token activity. This empowers investors to optimize their strategies and respond swiftly to market changes.
AmberLens is available for anyone to use for free. For institutional investors interested in the underlying historical data behind AmberLens charts and metrics (available in AWS S3, Databricks Google Analytics Hub, and Snowflake) ask for a demo.
For further insights and strategic guidance, download the "Trading Crypto Between Hours Across Exchanges" report.
