Share this blog:
Institutional investors require precise and timely insights to navigate the volatile Bitcoin and crypto market effectively. AmberLens offers a comprehensive dashboard with key BTC market sentiment metrics, enabling asset managers, researchers, and professional traders to swiftly make informed decisions.
This blog post focuses on the critical indicators available in AmberLens, providing a quick and accurate assessment of market sentiment to enhance strategic trading and investment decisions.
Key BTC Market Sentiment Metrics
Each BTC market sentiment metric in AmberLens offers unique insights into the market's health and investor behavior. These metrics include Realized Price, Net Unrealized Profit/Loss (NUPL), Bitcoin HODLed or Lost, Monthly HODL Net Position Change, Liquid vs Illiquid Supply, and Percent of Supply in Profit.
Realized Price
Realized price is derived from dividing the Realized Cap by the supply. This metric offers an alternate view to Market Cap by representing the cumulative value of all coins within the network, essentially serving as a collective cost basis.
When the Realized Cap surpasses the Market Cap, it signals that the network is operating at a loss collectively. Conversely, if the Market Cap is higher, it indicates a collective profit. By comparing market prices to realized prices, market participants gain insights into their profit or loss status. This metric is invaluable for traders, analysts, and researchers, enabling them to assess market phases, trading behaviors, and draw comparisons with other commodities.
Net Unrealized Profit/Loss (NUPL)
NUPL is the difference between Realized Cap and Market Cap, representing the net profit or loss realized if all coins were sold. This metric includes the unrealizable profit of lost coins. Dividing Unrealized P&L by Market Cap provides a relative measure of investor sentiment. Traders can use NUPL to assess opportunity cost risks, analysts project costs to sell or buy, and researchers can correlate sentiment with price trends.
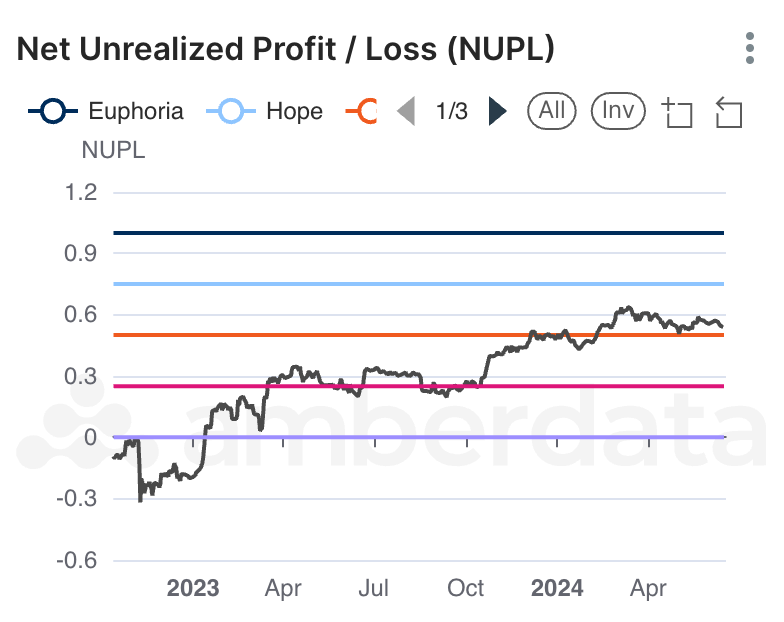
The BTC Net Unrealized Profit/Loss (NUPL) chart above indicates the market sentiment by showing unrealized profits or losses of investors from January 2023 to mid-2024. The NUPL value hovered around zero in early 2023, indicating a neutral sentiment, then began to rise, reaching approximately 0.3 by July 2023, suggesting growing optimism. By early 2024, the NUPL consistently stayed around 0.6, reflecting a significant level of unrealized profit and indicating that investors are largely in a hopeful to euphoric state.
Bitcoin HODLed or Lost
This metric tracks the total amount of Bitcoin that has stayed the same for a significant period or is considered lost. High values indicate assertive holding behavior, signaling confidence among long-term investors, while low values suggest increased selling pressure. Traders can use this metric to anticipate whale activity, analysts to identify market stages, and researchers to find patterns linking whale activity and network activity to price movements.
Monthly HODL Net Position Change
This metric measures the monthly change in holdings of long-term Bitcoin holders. Positive changes indicate accumulation, while unfavorable changes suggest distribution. Liveliness, an associated metric, measures the ratio of meaningful transactions to all Bitcoin days created, with higher values indicating more activity. Traders can use these metrics to stay ahead of whale activity, analysts to identify market stages, and researchers to find correlations between network activity and adoption rates.
Liquid vs. Illiquid Supply
Using daily address balance metrics, this metric distinguishes between Bitcoin held in highly liquid (readily tradable) and illiquid (not easily tradable) forms. A higher illiquid supply implies that more Bitcoin is being held long-term, reducing market sell pressure, while an increase in liquid supply may indicate the potential for higher volatility. Traders, analysts, and researchers can use this metric to understand market liquidity, which is crucial for evaluating market conditions and potential movements.
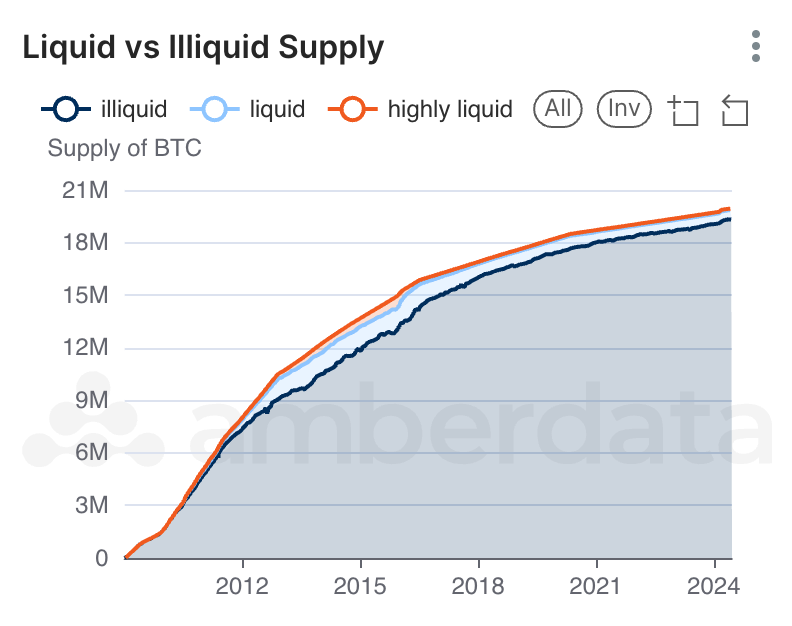
The Liquid vs Illiquid Supply chart above illustrates the liquidity preferences of Bitcoin addresses from 2010 to mid-2024. Over this period, the supply of highly liquid Bitcoin (addresses with a high output-to-input ratio) has steadily increased, reaching approximately 15 million BTC by mid-2024, indicating growing market participation. Meanwhile, the illiquid supply (addresses with a low output-to-input ratio) has also grown, highlighting an increase in long-term holdings, which contributes to reduced available supply and reflects macro bullish sentiment.
Percent of Supply in Profit
This metric shows the percentage of Bitcoin supply currently in profit based on the price at which it was last moved. High percentages suggest that most holders are in profit, leading to increased selling pressure, while low percentages indicate that most holders are at a loss, potentially reducing selling activity. This metric helps investors assess market sentiment and potential selling behaviors.
Analyzing these metrics provides a multifaceted view of the Bitcoin market, helping institutional investors gauge overall market sentiment. For instance, Realized Price and NUPL can highlight overbought or oversold conditions, while Bitcoin HODLed or Lost and Monthly HODL Net Position Change reveal investor confidence and behavior trends. Liquid vs. Illiquid Supply and Percent of Supply in Profit help assess potential market volatility and pressure points. By integrating these insights, investors can better navigate market cycles and make informed strategic decisions.
Final Thoughts
In summary, understanding and analyzing key BTC market sentiment metrics is essential for institutional investors aiming to navigate the volatile cryptocurrency market. Metrics such as Realized Price, Net Unrealized Profit/Loss (NUPL), Bitcoin HODLed or Lost, Monthly HODL Net Position Change, Liquid vs Illiquid Supply, and Percent of Supply in Profit offer valuable insights into market dynamics and investor behavior. By leveraging these indicators through the AmberLens dashboard, investors can make more informed decisions, manage risk effectively, and potentially capitalize on market opportunities.
AmberLens Market Intelligence is available for anyone to use for free. For institutional investors interested in the underlying historical metric data behind AmberLens charts (available in AWS S3, Databricks Google Analytics Hub, and Snowflake), ask for a demo.
To explore these indicators further and enhance your trading strategies, download the Introducing Bitcoin Market Indicators report for a comprehensive analysis and detailed insights.
