Share this blog:
Bitcoin breaks $60k! In an incredible rally, Bitcoin has surged past the $60k barrier, reaching yearly highs for the asset. Exciting times for Bitcoin of course mean exciting times for the rest of the industry: ETH has also surged past its $3k barrier and continues to grow in lockstep with Bitcoin. Even off-chain exchange Coinbase has seen its stock COIN rally past $200, an incredible feat considering one year ago it struggled to stay above $50.
Of course, such rallies are always accompanied by two fundamental questions: 1) are we at the top yet? and 2) how long will this last? To answer such questions, we must theorize the fundamentals driving the bull market. Most eyes look to massive inflows from Bitcoin ETFs: the past three days saw over $670 million of net inflow to known BTC ETF addresses, signaling TradFi demand for the asset. Demand is likely due to the upcoming halving approaching in April, which historically has always rallied BTC prices, as well as investors' desire to expose their TradFi accounts to Bitcoin to partake in the upcoming gains.
Are we at the top? Our market metrics imply that we are still about halfway through this cycle. As for how long this will last, we are likely to see the rally continue for the next few weeks. There will likely be minor corrections as we approach the halving, but time-tested advice will continue to shine through just HODL.
In other news, the European Central Bank (ECB) has reported that the “latest approval of an ETF doesn’t change the fact that Bitcoin is not suitable as a means of payment or as an investment.” The Economist has also reported that the Bitcoin ETFs are “off to a bad start.”
Spot Market
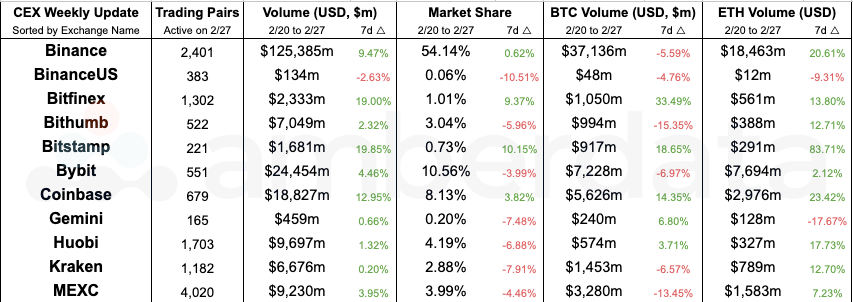
Centralized Exchange (CEX) Comparisons From Weeks 2/27/2024 and 2/19/2024
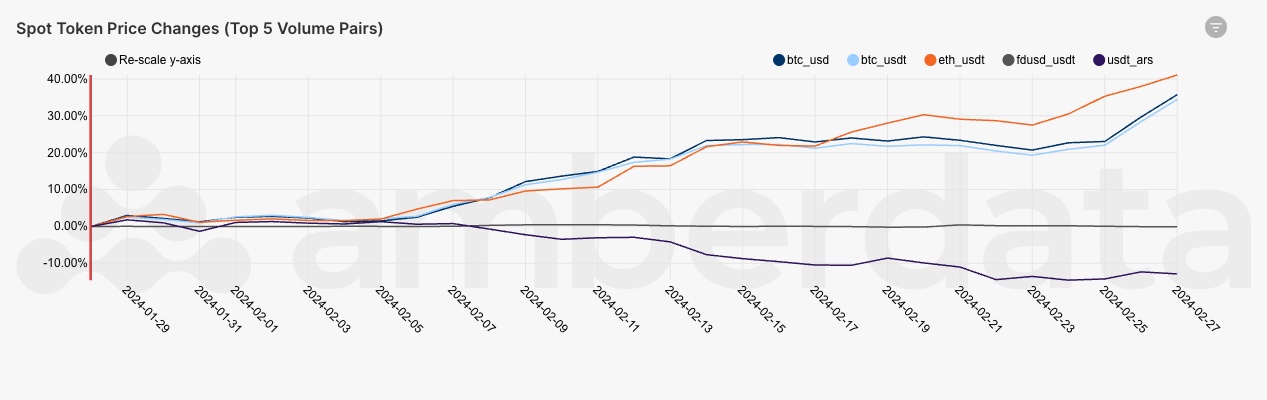
CEX Top Five Pairs Price Change
Unsurprisingly, we see the big winners of the current rally being BTC and ETH, with BTC_USD trading up 35% and ETH_USD up 41%. This visualization clearly shows the start of the current rally, with prices changing significantly starting on February 5th.
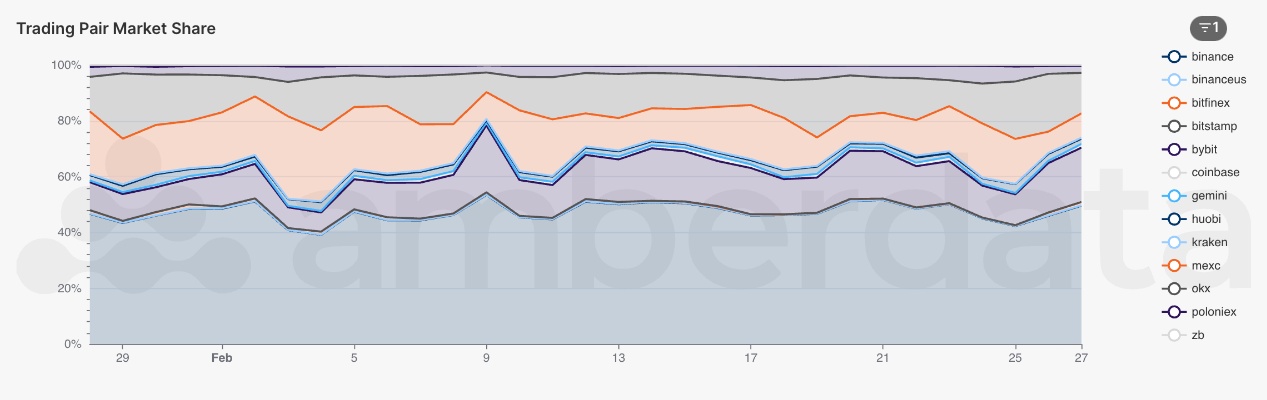
Market Share for BTC_USD by CEX
As for who is winning in terms of profiting off of the rally, we see Binance maintains its dominance over other exchanges, controlling over half of the volume in market share. For CEXs, rallies are the primary money-printing machines. Expect more activity from these CEXs over the next few months as they position themselves for another bull run.
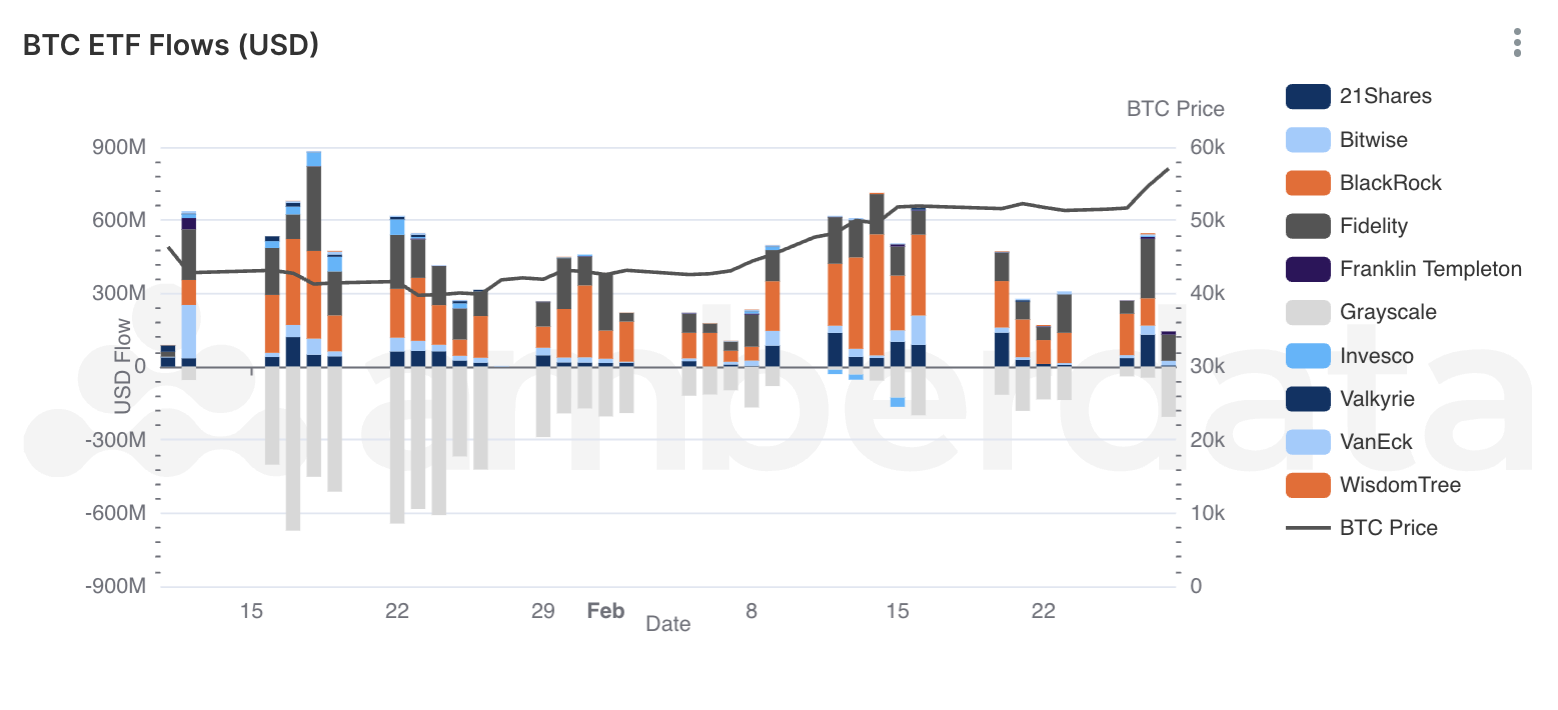
BTC Holdings by ETF, Converted to USD
As mentioned earlier, over the past three days we’ve seen a net $670 million of BTC inflow into various ETF funds. Interestingly, yesterday we saw a negative outflow of funds, about $61 million. With current volatility, it would not be surprising to see a larger outflow as TradFi seeks to realize its meteoric gains. The rocket ship will have many more bumps over the next few weeks.
DeFi DEXs

Decentralized Exchange (DEX) protocol from weeks 2/27/2024 and 2/19/2024
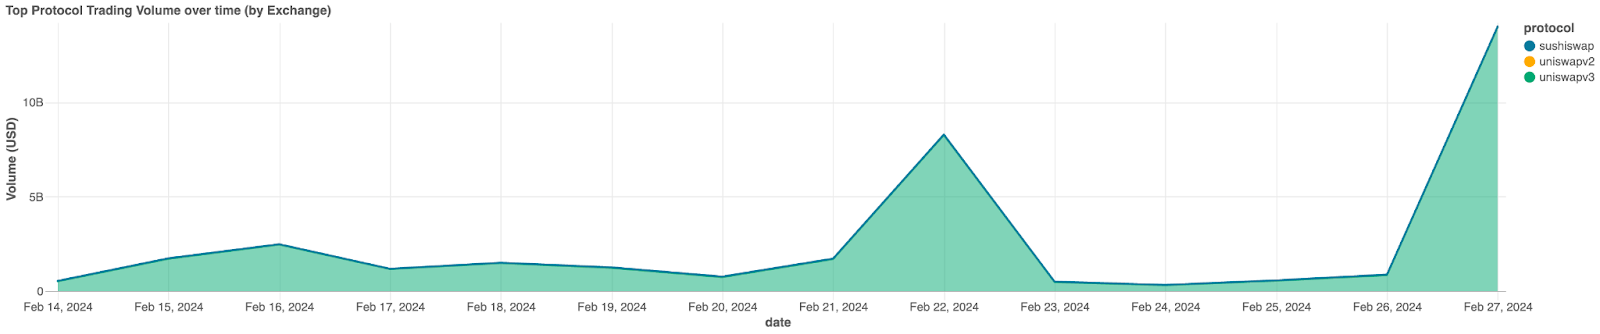
Overall Decentralized Exchange (DEX) Trading Volumes
Just like CEXs, market rallies are interesting to observe on DEXs. At the start of last week, there was a large surge of volume on Uni V3, marking a two-week high for the protocol. Uniswap v2 and Sushiswap partook in a miniscule part of the profit, but Uni v3 continues to dominate as the premier DEX. Expect to see the UNI token increase in value, similar to how COIN also saw an increase in value.
DeFi Borrow/Lend
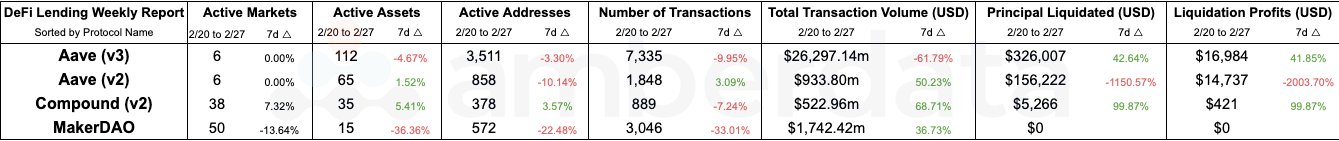
DeFi Lending protocol comparisons from weeks 2/27/2024 and 2/19/2024
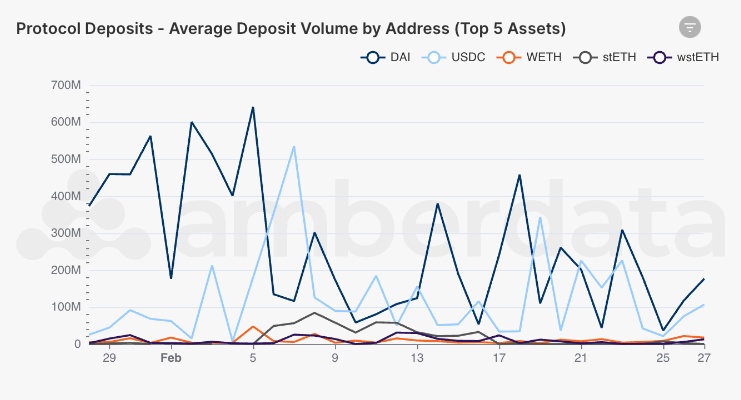
DeFi Lending Average Deposit Volume by Address for the Top 5 Assets
On the lending side, we see an increase in average deposit size for the top five major assets over the past couple of days. Lending is interesting during a market rally - as more opportunities present themselves, investors are more inclined to take advantage of lending protocols to create leverage for large market moves. However, it seems in general that for now, the lending landscape has not experienced anything extraordinary. It will be good to monitor the growth of lending borrows and repays over the next few weeks to see how they are affected by the rising tide of Bitcoin’s surge.
Networks
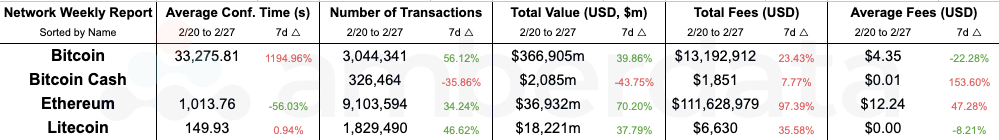
Network comparisons from weeks 2/27/2024 and 2/19/2024
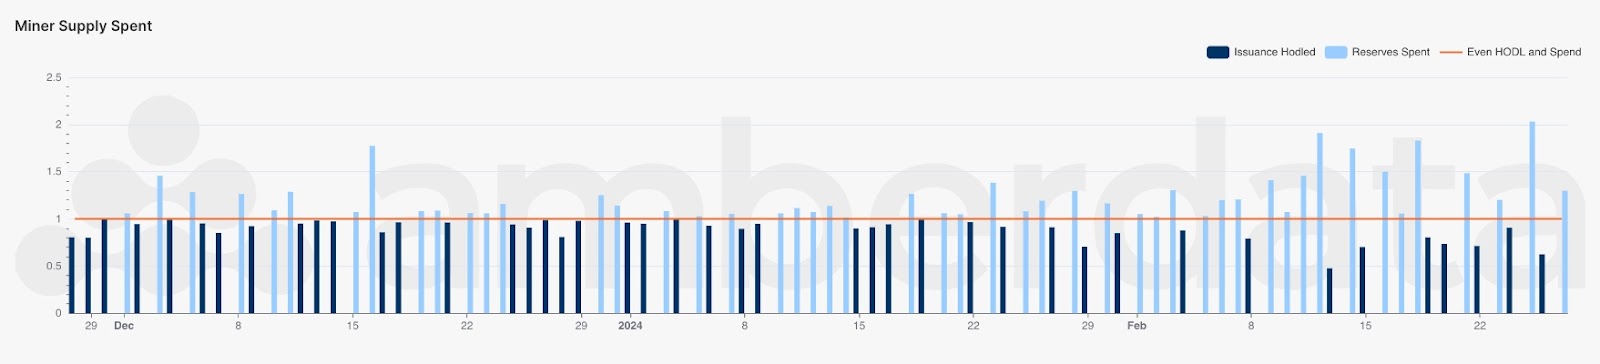
Percentage of miner supply spent. Light blue bars indicate that miners are moving more of their supply than they mined.
Focusing on BTC today, we see that miners have been moving more supply than mined over the past month. For Bitcoin, this shows that miners are sending more than they mine, which indicates that they are partaking in the profits of the network. We can see mined supply drastically changed at the beginning of the month, whereas at the end of last year, more miners were still in a holding position. Monitoring these trends can give us insight as to when market cycles begin and end.
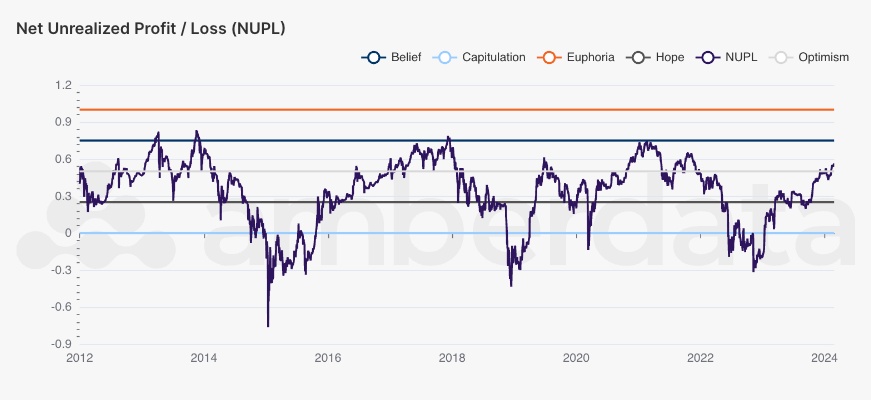
Bitcoin Net Unrealized Profit/Loss
As for how much longer the current market cycle will last, we see that the Net Unrealized Profit/Loss for Bitcoin has crossed the optimism mark. NUPL is a measure of how profitable the network is, and how much of the network remains in a state of unrealized profit (i.e. how many people bought and are holding vs. realizing their gains). We are still a ways away from the peak, however. The NUPL bands are useful for quantifying the overall market sentiment for the crypto industry, so we are likely to see more optimistic news over the coming weeks. For now, those who held firm through the last bear can relish in their newfound gains, at least for the next few days.
Links
Recent from Amberdata
- Amberdata: AD Derivatives Podcast Featuring John Palmer President of Cboe Digital
- Amberdata: Find Actionable Insights in Crypto Price Reference Quotes
Spot Market
Spot market charts were built using the following endpoints:
- https://docs.amberdata.io/reference/market-metrics-exchanges-volumes-historical
- https://docs.amberdata.io/reference/market-metrics-exchanges-assets-volumes-historical
- https://docs.amberdata.io/reference/get-market-pairs
- https://docs.amberdata.io/reference/get-historical-ohlc
Futures
Futures/Swaps charts were built using the following endpoints:
- https://docs.amberdata.io/reference/futures-exchanges-pairs
- https://docs.amberdata.io/reference/futures-ohlcv-historical
- https://docs.amberdata.io/reference/futures-funding-rates-historical
- https://docs.amberdata.io/reference/futures-long-short-ratio-historical
- https://docs.amberdata.io/reference/swaps-exchanges-reference
- https://docs.amberdata.io/reference/swaps-ohlcv-historical
- https://docs.amberdata.io/reference/swaps-funding-rates-historical
DeFi DEXs
DeFi DEX charts were built using the following endpoints:
- https://docs.amberdata.io/reference/defi-dex-liquidity
- https://docs.amberdata.io/reference/defi-dex-metrics
- https://docs.amberdata.io/reference/defi-impermanent-loss
DeFi Borrow/Lend
DeFi lending charts were built using the following endpoints:
- https://docs.amberdata.io/reference/defi-lending-protocol-lens
- https://docs.amberdata.io/reference/defi-lending-asset-lens
Networks
Network charts were built using the following endpoints:
- https://docs.amberdata.io/reference/blockchains-metrics-latest
- https://docs.amberdata.io/reference/transactions-metrics-historical
- https://docs.amberdata.io/reference/get-historical-transaction-volume
