Share this blog:

If you’ve been following the market lately, you might be expecting today’s headline to be ‘Bitcoin breaks $80k’. While no such thing happened this week, Bitcoin has been breaking another 10k barrier every two weeks for the past month.
Though the rally might have slowed, it has not stopped. At the time of this writing, Bitcoin is hovering very healthily at 71k, still past the previous cycle’s ATHs. Though prices temporarily deflated with the announcement of higher-than-expected CPI numbers, BTC bounced back after a week to return to its current price. This shows that the demand for BTC via ETFs is as strong as ever and that market conditions will continue for at least a few more weeks.
Things should be looking up until the Halvening, which is predicted to land on April 19th, 2024. As we have mentioned before, Halvening events have always led to a sharp rally in BTC before the event, and the drive of ETFs plus Halvening stockpiling is leading the current demand for BTC. However, it is unclear whether we will continue to experience the same drive for demand post-Halvening. Keep an eye on miner activity, as the Halvening will impact their behavior the most. Miners are known to have a strong influence on Bitcoin price, with several metrics dedicated to tracking mining behavior. Amberdata provides publicly available BTC miner behavior metrics on amberLens, our new and free research tool that we use to track miner behavior.
In other news, gamified DeFi protocol Munchable was hacked for over 17,000 ETH (~$63,000,000) on Blast L2. This hack occurred as a result of an upgradeable proxy contract pattern. The upgradable contract pattern essentially allows one of the developers to assign themselves a balance of 1,000,000 ETH. The developer then changed the implementation address from their original (unverified contract) to the new one that all users could see. This developer waited for the TVL in the contract to levels that they wanted and then withdrew all the ETH to themselves.
Over the last 24 hours, the team at Blast and Munchable worked to figure out how to recover the funds. Thanks to on-chain sleuth, zachXBT, they were able to piece together what they thought where the funds were moving and eventually came to an agreement with the hacker to return the stolen funds. This opens up a fundamental conversation around immutable contacts vs. upgradable patterns. While each has its trade-offs, this hack was a direct result of an upgradable contract.
Spot Market
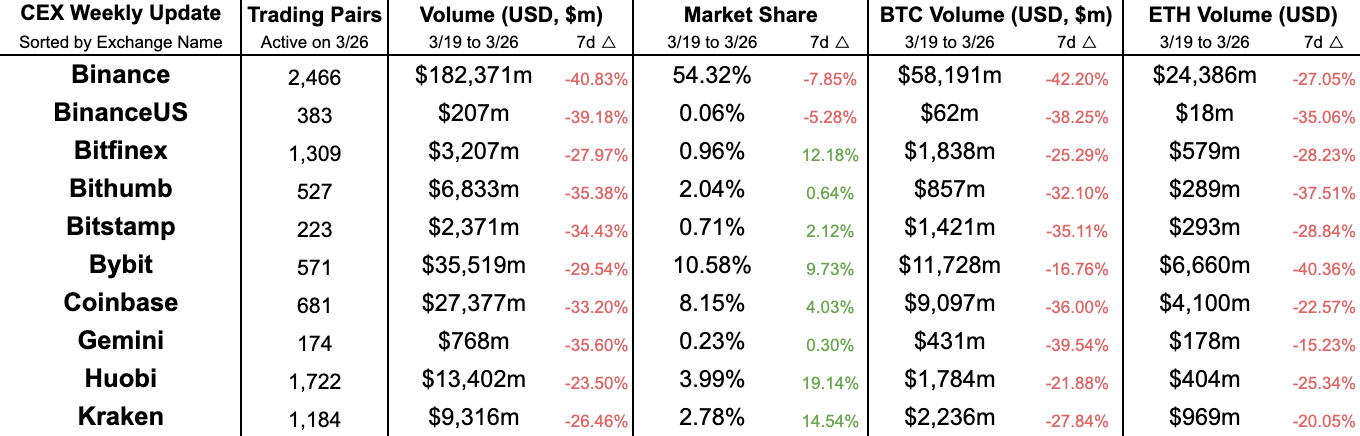
Centralized Exchange (CEX) comparisons from weeks 3/19/2024 and 3/26/2024
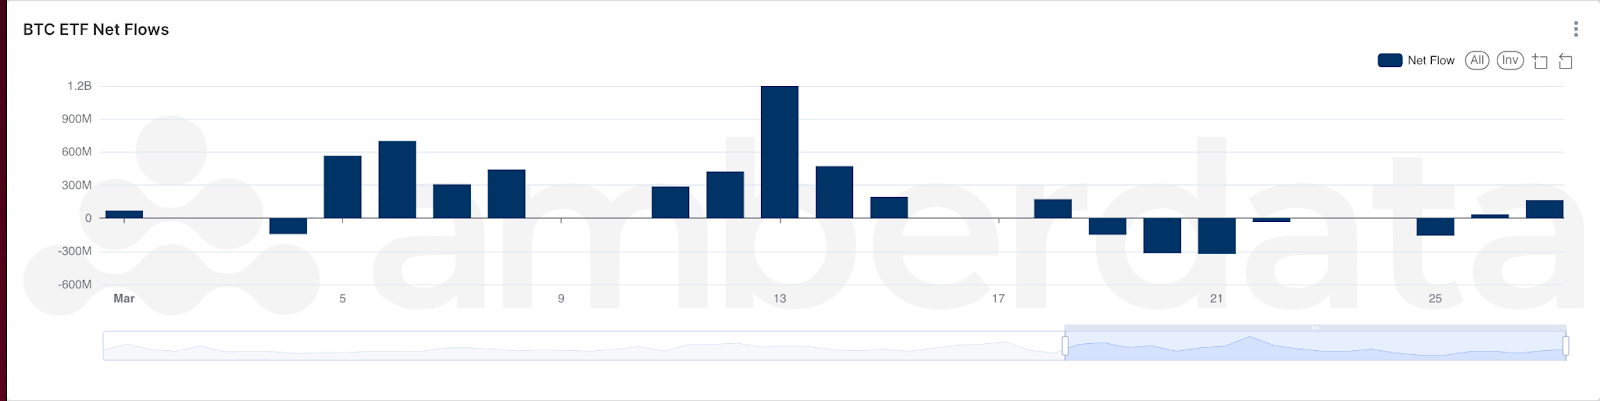
BTC Net Inflows and Outflows over the past month
BTC ETF issuers are currently holding 825,000 BTC (~$57B). This represents nearly 4% of the entire BTC supply. Considering that the ETF launched just earlier this year - 4% of all BTC represents a strong interest in gaining exposure to BTC. While the price of BTC is off from the recent all-time highs, net ETF flows for March remain up with $3.9 billion of net inflow.
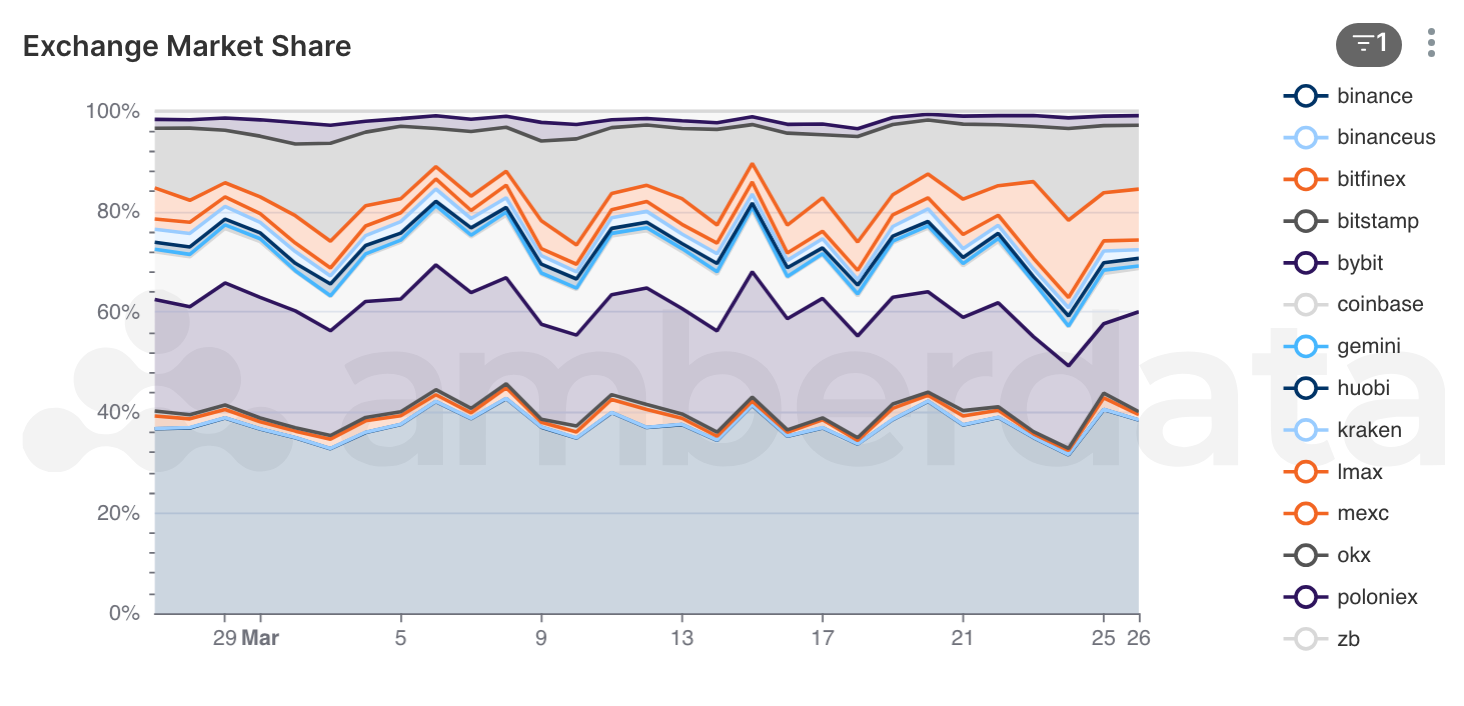
Exchange market share for top traded pairs (btc_usd and eth_usd)
On the CEX side, we see Binance remains king when it comes to the most highly traded pairs of BTC_USD and ETH_USD. Coinbase’s share grows smaller as it struggles to scale its infrastructure to meet the demand of the bull market. If the bull market continues past the Halvening, expect to see Binance make market moves as it attempts to solidify its position over the other CEXs. This includes things like providing venture capitalist funding or buying out competitors or other companies to supplement their product offerings.
DeFi DEXs

Decentralized Exchange (DEX) protocol from weeks 3/19/2024 and 3/26/2024
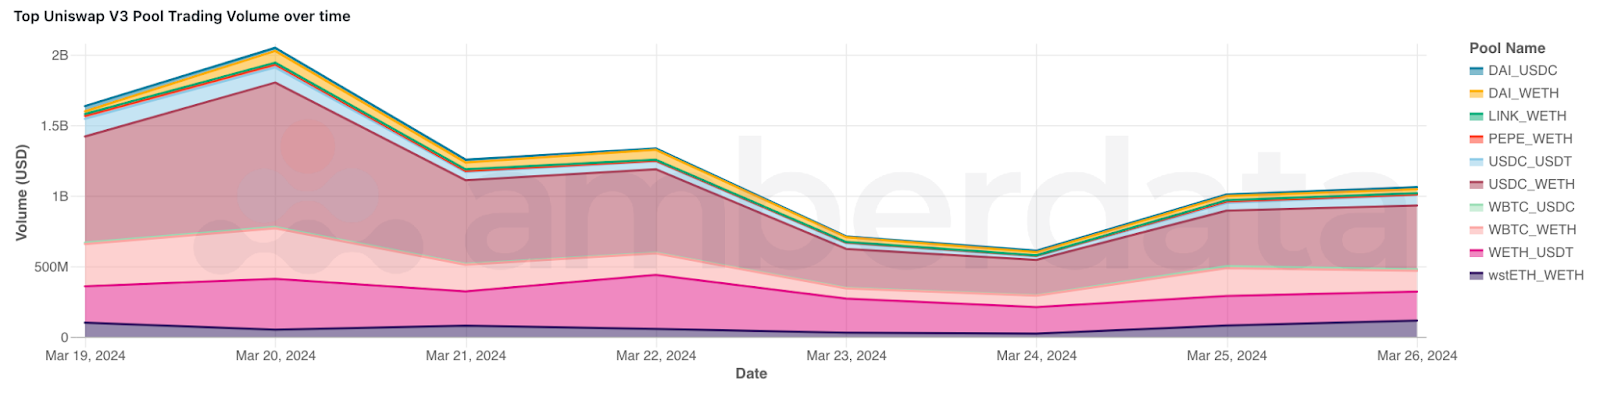
Uniswap v3 DEX volume on top pools over the past week
USDC_WETH has remained king of the hill among the other Uni V3 pools over the past week. With multiple billion-dollar trading volume days, there is no question that USDC_WETH is the predominant pool in the Uni V3 ecosystem. WBTC_WETH saw a slight decrease in activity over the past few days but is quickly recovering, most likely in lockstep with the volatility of BTC price changes. Overall volume is down over the past three days, likely a cooling step to the overall hot change we’ve seen concerning BTC price action. As the Bitcoin rally continues, we should expect to see some altcoins break their way into the top 10 trading pools, but perhaps the meme economy has not lifted off yet, as many people have speculated.
DeFi Borrow/Lend
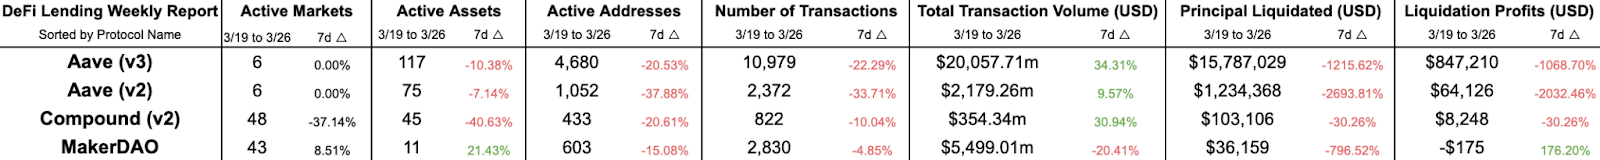
DeFi Lending protocol comparisons from weeks 3/19/2024 and 3/26/2024
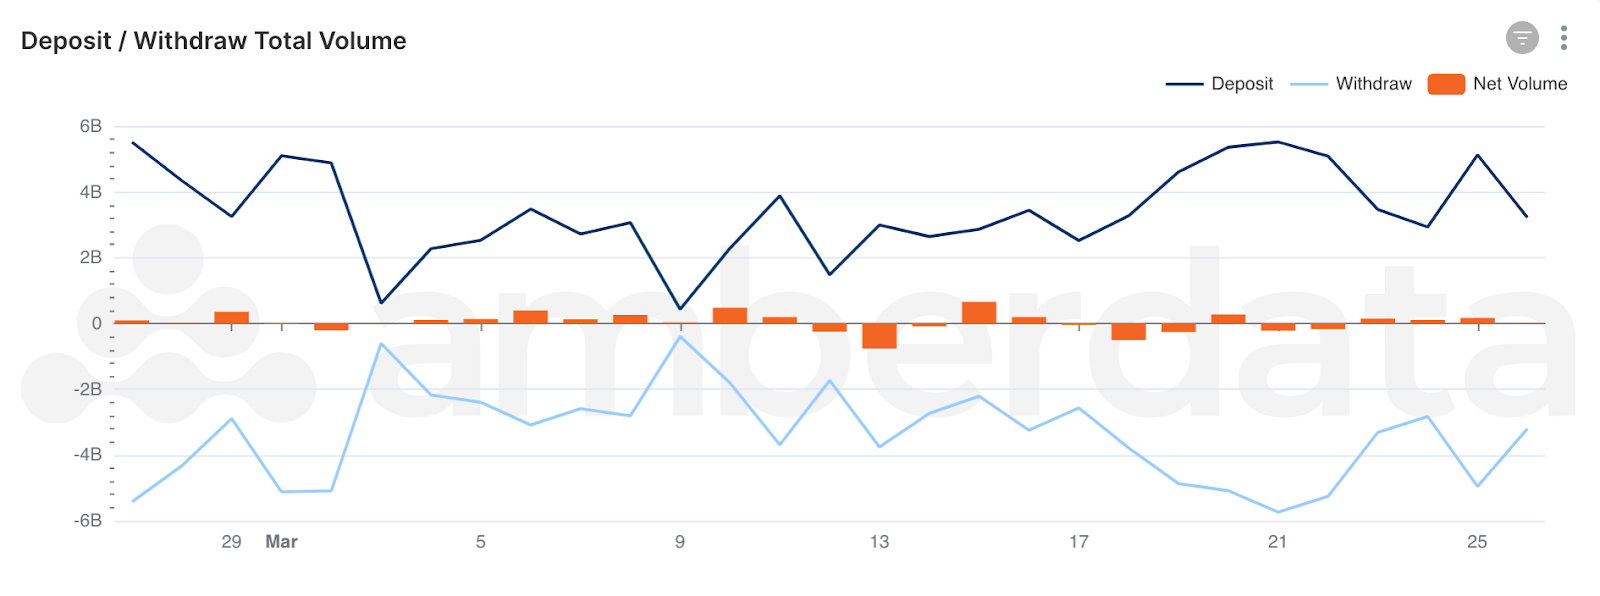
DeFi Lending deposit and withdraw volumes over the last 30 days
In general, we see the deposit and withdrawal volume flow remain typically flat. When we do see major flows, there is usually a significant event happening, such as a hack or protocol bank run. Fortunately, we do not see that here, but over the past three days, we have seen an overall increase in the number of deposits, indicating that users are generally bullish on the yield they will get from lending protocols. Earlier in the month, we saw some larger turbulence with millions of dollars of net flow, as users likely wanted to have their liquid funds to capture the higher price action over the past two weeks.
Networks
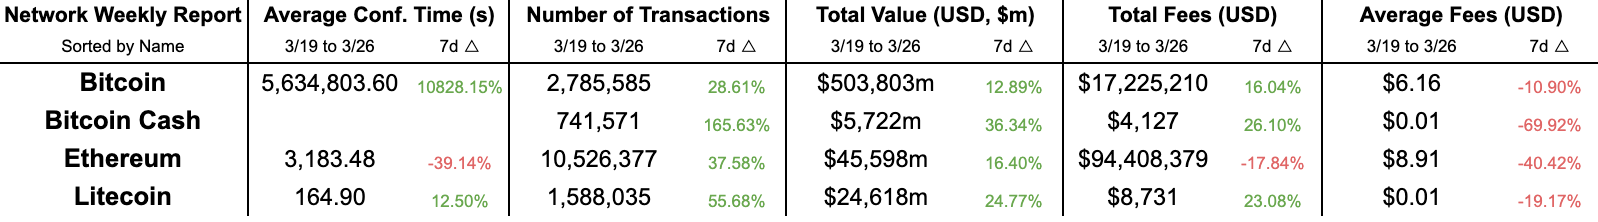
Network comparisons from weeks 3/19 and 3/26
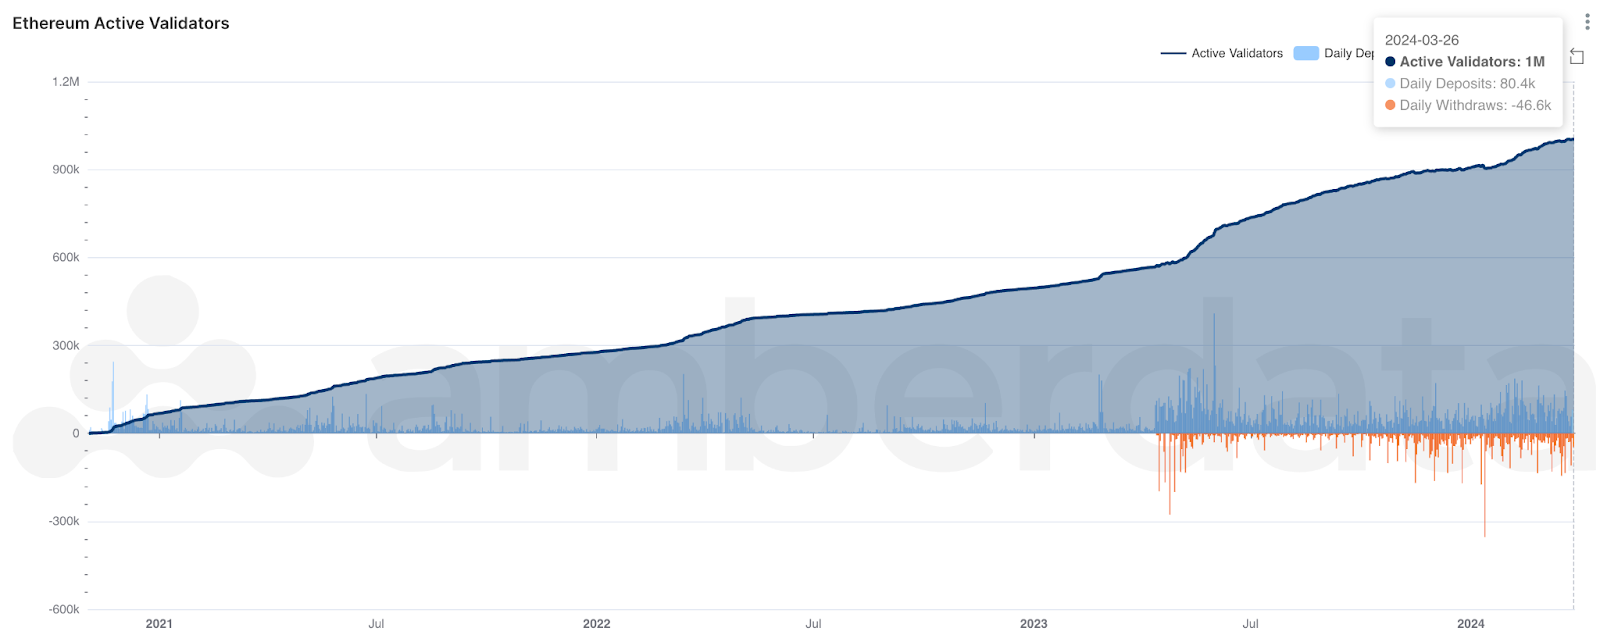
Ethereum Active Validators. Shows growth of validators over time.
For the first time in a while, we will take a short break from Bitcoin network activity to look at the other side of the crypto pond: Ethereum. Ethereum network security continues to grow as the number of validators crosses 1 million active validators, a major milestone for the network
This is bullish from a security perspective but also from the standpoint that ETH holders are interested in gaining exposure to ETH yield. Another move in the right direction for Ethereum security recently was Coinbase Cloud’s offering the ability to run Erigon and Nethermind nodes. The ongoing push for Ethereum client diversity remains and is an important issue across the ecosystem. Currently, 66% of all execution layer nodes are running on GETH.
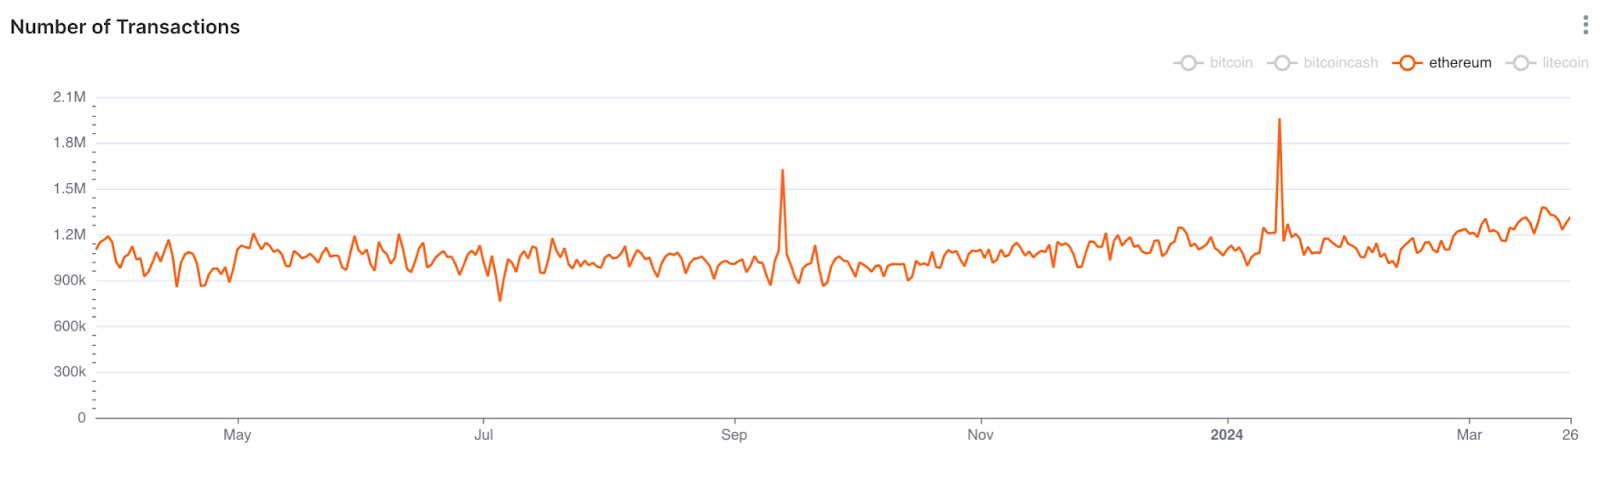
Ethereum count of transactions. YTD, transaction count is up ~30%.
Though not immediately obvious looking at this graph, there has been a slight positive uptrend in network activity since 2024 began. We are seeing an overall higher sustained number of transactions, likely as users and protocols prep for the current market cycle. With the Dencun upgrade happening last week, it would not be surprising to see the number of transactions slowly drop as users move their supply to L2s to realize the Dencun transaction fee cost savings. This is overall good for the network, as high network traffic equals high gas fees, which are a huge impediment to the overall adoption of crypto for the mainstream.
Links
Recent from Amberdata
-
Amberdata: Amberdata Introduces AmberLens Market Intelligence!
-
Amberdata: Access Bitcoin and Crypto Reference Rates
-
Amberdata: Back in Bullish Mode
Spot Market
Spot market charts were built using the following endpoints:
-
https://docs.amberdata.io/reference/market-metrics-exchanges-volumes-historical
-
https://docs.amberdata.io/reference/market-metrics-exchanges-assets-volumes-historical
Futures
Futures/Swaps charts were built using the following endpoints:
-
https://docs.amberdata.io/reference/futures-ohlcv-historical
-
https://docs.amberdata.io/reference/futures-funding-rates-historical
-
https://docs.amberdata.io/reference/futures-long-short-ratio-historical
-
https://docs.amberdata.io/reference/swaps-exchanges-reference
-
https://docs.amberdata.io/reference/swaps-funding-rates-historical
DeFi DEXs
DeFi DEX charts were built using the following endpoints:
DeFi Borrow/Lend
DeFi lending charts were built using the following endpoints:
Networks
Network charts were built using the following endpoints:
-
https://docs.amberdata.io/reference/blockchains-metrics-latest
-
https://docs.amberdata.io/reference/transactions-metrics-historical
-
https://docs.amberdata.io/reference/get-historical-transaction-volume
