Amberdata Digital Assets Snapshot: ETF Rumors, SOL Resurgence, and "Risk On" Strategies

2024 has started already with a bang and a crash with BTC down 5.5% and ETH down 6.5% today.
This change is potentially due to an unverified report which claimed an upcoming SEC rejection of the spot Bitcoin ETFs, but at that same time the publisher also reported that SEC approval is “imminent.” More tenable news from Fox reports that the SEC is meeting with exchanges to finalize comments submitted by ETF issuers. The chaos and battles are likely to continue until January 10th, when the window for approval (or rejection) ends.
In DeFi, protocol Radiant Capital was exploited for 1,900 ETH (around $4.5 million) after a known bug in their code was used against them. The protocol was an Aave v2 “clone” using critical parts of the Aave v2 code to build their protocol, and the exploit leveraged a bug of a rounding precision error. They have since paused lending on Arbitrum.
On the NFT side, an NFT collection is kicking off an incredibly interesting and exciting trend: company equity. NFT Collection “The Plague” announced that holders of unlisted NFTs will receive company shares, claiming to have spoken to multiple lawyers as part of the move.
Solscan has officially been acquired by Etherscan, bringing the Solana explorer into the portfolio of the Ethereum explorer’s network. This may be a strong supporting signal for Solana which is a difficult network for analysts due to several network complexities, and poor front-end user experience to date. Etherscan also maintains several other network explorers such as Basescan, Polygonscan, and Blockscan as part of their Explorer-as-a-Service model.
Spot Market
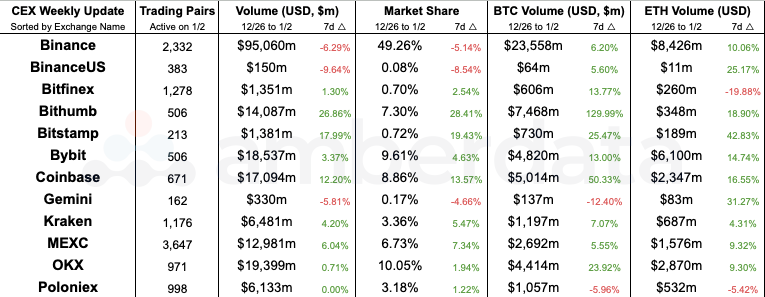
Centralized Exchange (CEX) comparisons from weeks 12/26/2023 and 01/02/2024
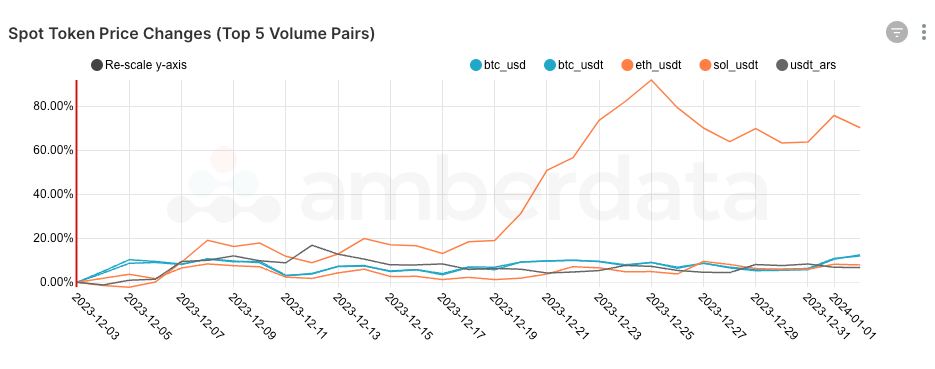
Spot token price changes for the top 5 volume pairs since December 3, 2023
December was a huge month for SOL, which rose over 70% over the month and led the surge of alt-coins. The Layer 1 has been rebounding steadily since the conclusion of the FTX/Sam Bankman-Fried trial as the network was not as tightly connected to the convicted former-founder as many believed. The network’s resurgence is an interesting prospect which has many Ethereum maxi’s divided as the scalability of the two networks currently differ greatly.
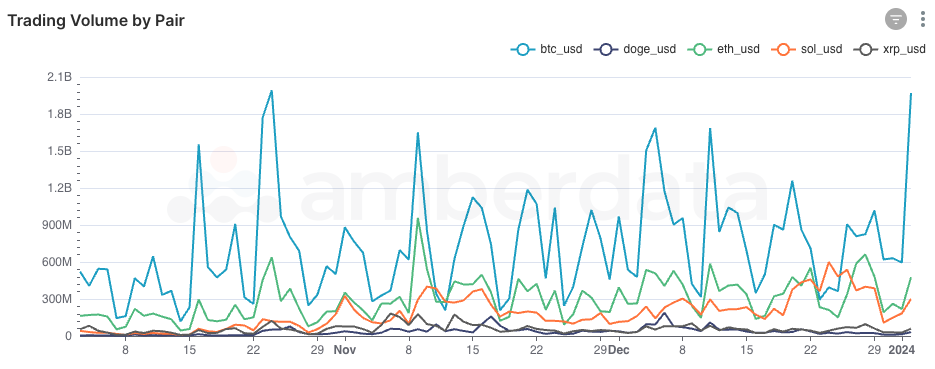
Spot token trading volumes for top 5 volume pairs since October 3, 2023
SOL’s price resurgence can also be attributed to increased interest from traders, bringing the token more firmly into the third place for trading volumes and giving ETH a run for their money. In a world of upside potential, SOL may have more room to play than the dominant ETH given the wide difference in market share between the two.
DeFi DEXs

Decentralized Exchange (DEX) protocols from weeks 12/26/2023 and 01/02/2024
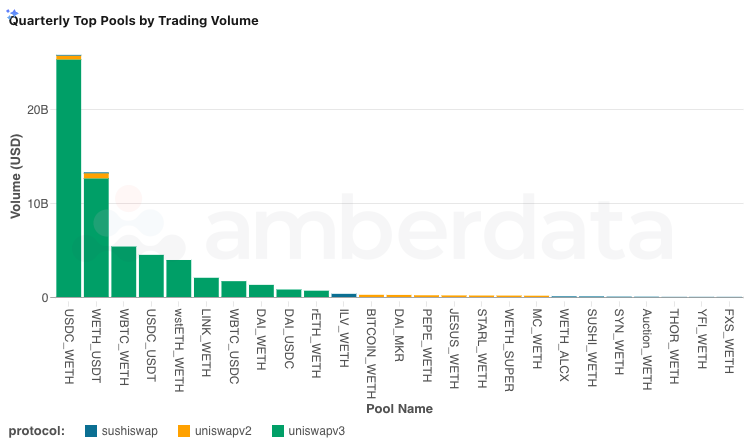
Top pools by trading volume over the last 3 months
DEX trading over the last quarter has continued to lean towards the tried and true swaps with USDC/WETH and WETH/USDT taking the lion's share. As we look down the pipeline, some interesting pairs emerge with WBTC and wstETH placing in the top 5 swapped tokens over the last quarter. WBTC is often a vehicle for exposure to BTC prices for Ethereum users who prefer to swap into the token that’s been leading the crypto resurgence at the end of last year, and wstETH exposes holders to staking yields on ETH, which are sometimes marginal. These two tokens also often represent long-term holdings for investment purposes rather than utility.

Uniswap v3 top trading volume pools since December 3, 2023
Uniswap v3, which is by far the most active DEX on Ethereum, has daily trading volumes that fluctuate quite fluidly. A peak on December 28th proved to be the most active date for WBTC swaps and stablecoin swaps (USDC and USDT) to and from WETH. It is possible that traders began to reallocate USDC and USDT to WBTC during this timeframe, putting more tokens into a “risk on” approach through BTC price exposure rather than sitting on stablecoins.
DeFi Borrow / Lend

DeFi Lending protocol comparisons from weeks 12/26/2023 and 01/02/2024
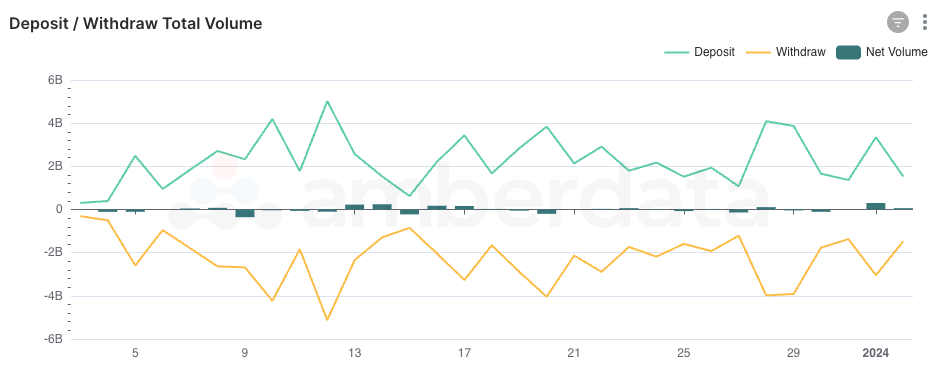
DeFi Lending total deposits and withdrawals over the last 30 days
DeFi Lending has been steadily kicking forward, though deposit volume has been fairly neutral over the last 30 days. Oftentimes during bull runs like we’ve seen over the last few months deposits into lending protocols slow down as users find higher yield in trading volatile assets rather than providing liquidity for passive yield. This appears to be the case in December with no major shift in volumes and few major deposits and withdrawals.
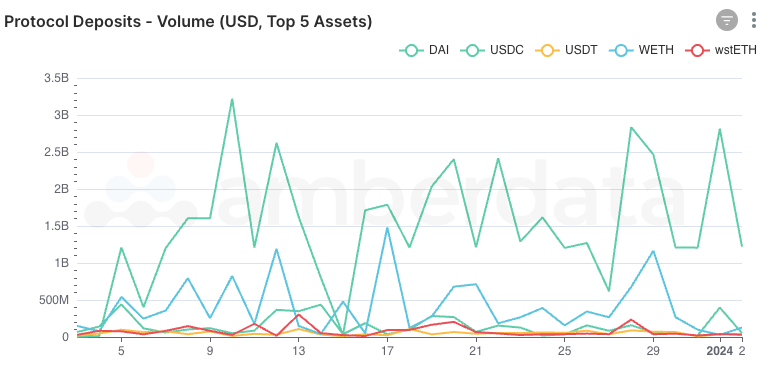
DeFi Lending top asset deposits over the last 30 days
As for the top deposited assets, DAI has been the primary driver for protocol liquidity which is somewhat of a surprise as the major trading tokens USDC and USDT have historically been also the most deposited assets.
Networks

Network comparisons from weeks 12/26/2023 and 01/02/2024

Bitcoin and Ethereum transaction counts over the last 3 months
Bitcoin transaction counts have been rapidly increasing since the end of October, giving credence to the price action over the same period. The growth in transaction count relative to Ethereum is notable, as Ethereum has historically been the more active network due to the programmable money infrastructure. However, the move on behalf of the Ethereum foundation to play a role as the “security” layer to L2’s will likely drive transaction volumes down over time in a fight to achieve sustainable scalability.

Bitcoin and Ethereum transaction counts over the last 12 months
Along with transaction counts, transaction fees on Bitcoin have climbed rapidly in lockstep with the additional network congestion.
Links
Spot Market
Spot market charts were built using the following endpoints:
- https://docs.amberdata.io/reference/market-metrics-exchanges-volumes-historical
- https://docs.amberdata.io/reference/market-metrics-exchanges-assets-volumes-historical
- https://docs.amberdata.io/reference/get-market-pairs
- https://docs.amberdata.io/reference/get-historical-ohlc
Futures
Futures/Swaps charts were built using the following endpoints:
- https://docs.amberdata.io/reference/futures-exchanges-pairs
- https://docs.amberdata.io/reference/futures-ohlcv-historical
- https://docs.amberdata.io/reference/futures-funding-rates-historical
- https://docs.amberdata.io/reference/futures-long-short-ratio-historical
- https://docs.amberdata.io/reference/swaps-exchanges-reference
- https://docs.amberdata.io/reference/swaps-ohlcv-historical
- https://docs.amberdata.io/reference/swaps-funding-rates-historical
DeFi DEXs
DeFi DEX charts were built using the following endpoints:
- https://docs.amberdata.io/reference/defi-dex-liquidity
- https://docs.amberdata.io/reference/defi-dex-metrics
DeFi Borrow/Lend
DeFi lending charts were built using the following endpoints:
- https://docs.amberdata.io/reference/defi-lending-protocol-lens
- https://docs.amberdata.io/reference/defi-lending-asset-lens
Networks
Network charts were built using the following endpoints:
Amberdata
Amberdata is the leading provider of global financial infrastructure for digital assets. Our institutional-grade solutions deliver data, analytics and comprehensive tools and insights that empower financial institutions to research, trade, and manage risk and compliance in digital assets. Amberdata serves as a...
