Share this blog:
This is Section 3, excerpted from our Amberdata Crypto Market Review 2025 and 2026 Outlook: Six Regimes, One Story. Our full report spans 14 sections - ETF flows, derivatives, on-chain, liquidity, and our complete 2026 outlook.
From Policy Euphoria to Fragile Recovery - what triggered each phase and what it means for 2026
|
KEY TAKEAWAYS |
|---|
|
January opened with Trump's executive order and 12.7% basis APR. By October, $15.3 billion in BTC positions had been liquidated across 48 hours. By December, the market sat in fragile recovery, awaiting catalysts. These weren't random moves - they were six distinct regimes, each with identifiable triggers and signatures.
The Analytical Spine. This section establishes the regime framework that serves as the spine of the entire Amberdata Crypto Market Review 2025. Every subsequent analysis contextualizes data within these regimes - because the same metric means different things in Policy Euphoria versus Fragile Recovery.
Three Phases. The six regimes divide naturally into three phases: Early Year Optimism (R1-R2) saw policy euphoria met by security shock. Mid-Year Build (R3-R4) represented accumulation and institutional expansion. Late Year Crisis (R5-R6) delivered the cascade and its aftermath. Each phase set up the next; understanding the sequence reveals the year's structural narrative.
Strategic Positioning. For institutional investors, regime identification enables strategic positioning. R1 conditions suggest taking profits on leverage-driven rallies. R3 conditions favor accumulation. R4 conditions demand hedging despite positive returns. R5 conditions require pre-positioned protection (it's too late once the cascade begins). R6 conditions call for patience and selective positioning. The framework enables action even without precise market timing.
Each regime section below examines: the trigger that initiated the regime, the Flow-Leverage-Liquidity signature that characterized it, the carry trade conditions (a key metric for institutional participants), key events within the regime, and quantitative metrics. This consistent structure enables comparison across regimes and identification of patterns that inform 2026 positioning.
Regime 1: Policy Euphoria (January 1-23)
Maximum Optimism. The year began with maximum optimism. Trump's inauguration and pro-crypto executive orders created a policy tailwind that drove aggressive positioning.
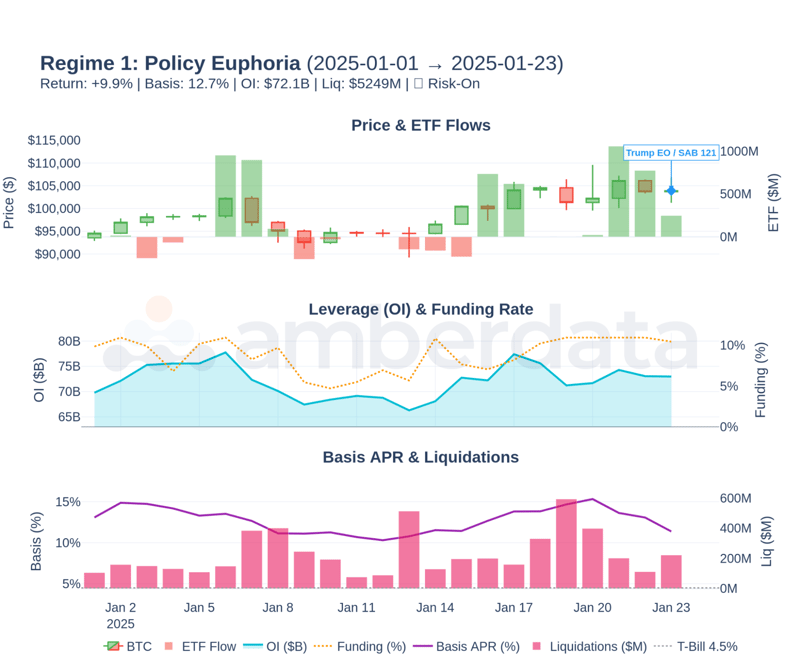
Figure 3.1: Regime 1: Policy Euphoria - Price, ETF flows, OI, and basis during R1. Note the building leverage (OI rising) and elevated basis (12.7% average) - the signature of euphoric positioning.
Trigger. January 23: Trump executive order affirming self-custody rights, staking, mining. Same day: SEC rescinds SAB 121, enabling banks to custody crypto.
Flow-Leverage-Liquidity. The three dimensions during R1:
Flows: Strong ETF inflows, stablecoin issuance rising.
Leverage: Building rapidly - OI $72.1B average, funding 8.8% APR.
Liquidity: Improving - depth increasing, spreads tightening.
Carry Trade Status: Excellent. Basis APR averaged 12.7% - the best conditions of the year. Term structure showed healthy contango. Institutional carry traders loaded positions during this window.
Regime Metrics. Key performance indicators for R1:
Return: +9.9%
Days: 23
OI: $72.1B avg
Funding: 8.8% APR
Liquidations: $5.2B
R1 set the stage for everything that followed. The leverage accumulated during these 23 days took months to unwind. The carry traders who entered during R1's attractive basis would eventually amplify October's cascade when forced to exit.
Key Warning from R1. High basis and building leverage in a short period creates fragility. 12.7% basis APR attracted capital rapidly. But rapid accumulation means crowded positioning. When conditions change, the crowded positions unwind together. R1's euphoria planted the seeds for R2's correction.
The transition from R1 to R2 was abrupt. The Bybit hack on February 21 instantly shifted market psychology. But the leverage that R1 built didn't disappear - it simply began unwinding over R2's 36 days. The $7.9B in R2 liquidations represents the cost of R1's euphoric positioning.
Regime 2: Security Shock (January 24 - February 28)
Testing Resilience. The Bybit hack - $1.46 billion stolen, the largest in crypto history - introduced a security shock that tested the market's resilience.
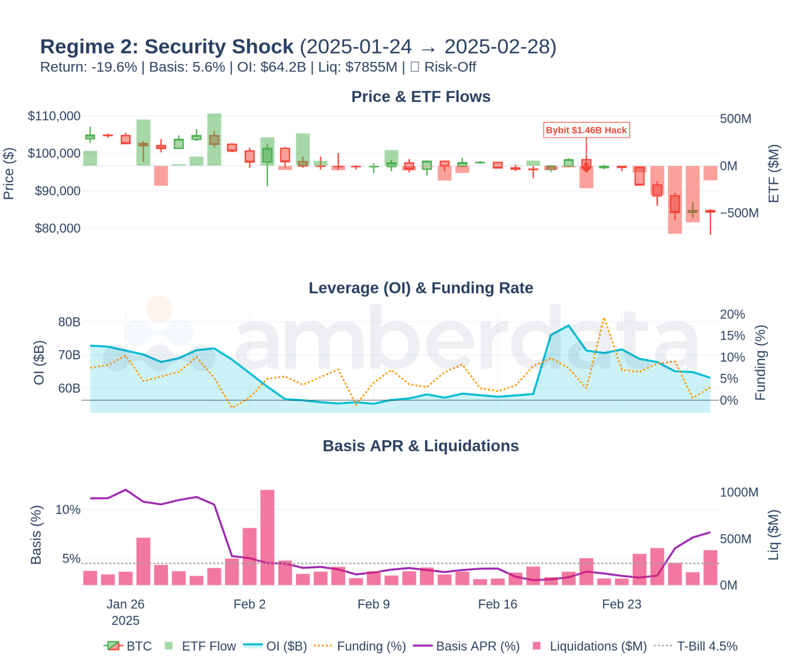
Figure 3.2: Regime 2: Security Shock - R2's price action showing the sharp decline post-Bybit hack. Basis compressed, funding normalized, OI declined as positions unwound.
Trigger. February 21: Bybit loses $1.46B to Lazarus Group malware. Mostly ETH stolen. Largest hack in crypto history.
Flow-Leverage-Liquidity. The three dimensions during R2:
Flows: Outflows spike as users withdraw to self-custody.
Leverage: Forced unwind - Bybit positions liquidated, contagion fears spread.
Liquidity: Deteriorates - depth thins, spreads widen.
Carry Trade Status: Reduced. Basis compressed to 5.6% average. Term structure flattened. The easy money of R1 was gone.
Regime Metrics. Key performance indicators for R2:
Return: -19.6%
Days: 36
OI: $64.2B avg
Funding: 5.7% APR
Liquidations: $7.9B
R2 demonstrated that security events create immediate but often temporary shocks. The market absorbed the Bybit hack within weeks, setting up the recovery phase that followed.
Paradoxical Acceleration. The Bybit response also accelerated regulatory developments. The hack highlighted custodial risks, pushing institutions toward regulated ETF products. Paradoxically, the security crisis may have accelerated institutional adoption by demonstrating the value of regulated wrappers.
Security events create immediate shocks but often accelerate long-term institutional adoption by demonstrating the value of regulated products over direct custody.
$1.46B
Bybit hack losses - the largest security breach in crypto history. Lazarus Group attribution. The shock was absorbed, but it reset positioning and demonstrated ongoing security vulnerabilities.
Regime 3: Infrastructure Build (March 1 - May 31)
Best Performer. The year's best-performing regime. Regulatory clarity, orderly distributions, and infrastructure upgrades created conditions for sustained accumulation.
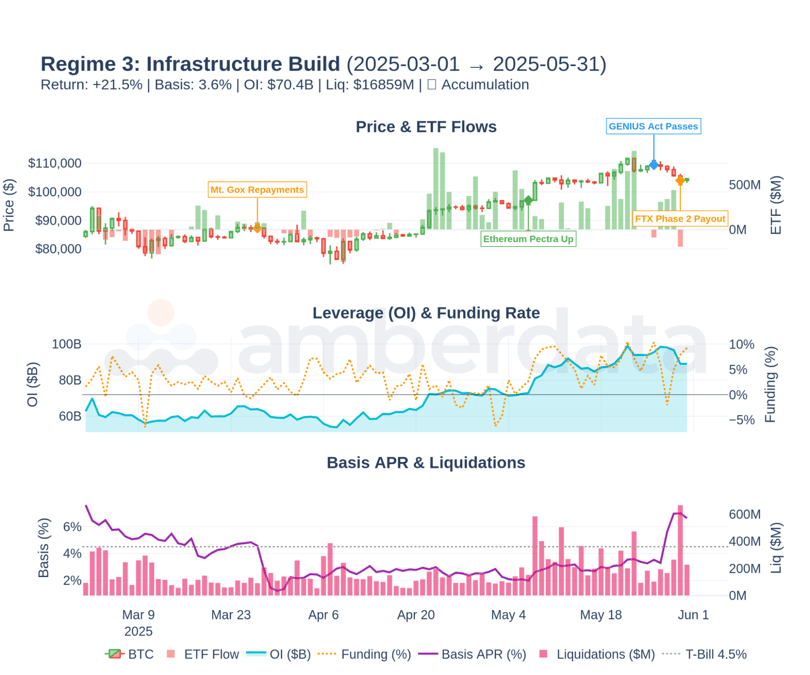
Figure 3.3: Regime 3: Infrastructure Build - R3's steady recovery. Note the orderly price appreciation without the leverage excess of R1.
Trigger. March 27: Mt. Gox repayments begin. May 7: Ethereum Pectra upgrade. May 26: GENIUS Act passes (first US stablecoin framework). May 30: FTX Phase 2 payout.
Flow-Leverage-Liquidity. The three dimensions during R3:
Flows: Steady recovery - distributions absorbed smoothly, ETF returns.
Leverage: Gradual rebuild - OI $70.4B average, funding normalizes to 3.3%.
Liquidity: Improving - depth rebuilds, spreads tighten.
Carry Trade Status: Good but Not Exceptional. Basis stabilized at 3.6% average. Term structure returned to healthy contango. Less attractive than R1, but sustainable.
Regime Metrics. Key performance indicators for R3:
Return: +21.5%
Days: 92
OI: $70.4B avg
ETF Inflows: $9.4B
Liquidations: $16.9B
R3's +21.5% return with moderate leverage (3.3% funding) represents the healthiest regime of the year. Price appreciation was driven by fundamental accumulation rather than leveraged speculation. This is the regime type institutional investors should hope for in 2026.
What Made R3 Work. Clear catalysts (regulatory milestones), manageable distributions (Mt. Gox/FTX absorbed smoothly), and moderate positioning (funding normalized). The combination allowed sustainable appreciation without building the fragility that triggers cascades.
R3 lasted 92 days - the longest regime of 2025. Extended accumulation phases allow institutions to build positions without moving markets. Short euphoric phases (like R1's 23 days) force rapid positioning that creates crowding. The lesson: prefer longer, steadier regimes over short explosive ones
|
SO WHAT? R3's character - steady accumulation, moderate leverage, fundamental drivers - represents healthy market conditions. When these conditions return in 2026, they signal sustainable appreciation rather than fragile leverage-driven rallies. |
The transition from R3 to R4 was gradual. As regulatory milestones accumulated (GENIUS Act, ETF approvals), optimism built. Leverage began rising. Basis started recovering. The healthy R3 environment slowly morphed into R4's leverage accumulation phase. The transition was invisible in real-time because each day looked similar to the previous - only the cumulative change mattered.
Regime 4: Institutional Expansion (June 1 - September 30)
The Buildup. The buildup phase set the stage for October. Institutional infrastructure expanded while leverage accumulated to dangerous levels.
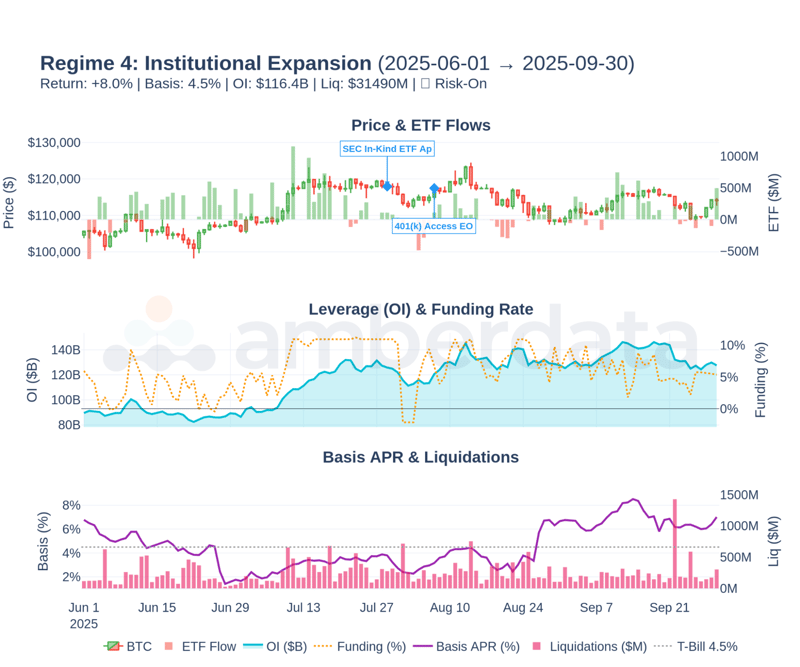
Figure 3.4: Regime 4: Institutional Expansion - R4's gradual build. Note the divergence: OI rising while volatility compressed to 30% (year's lowest). This divergence was the warning sign.
Trigger. June: SEC approves in-kind ETF redemptions (eliminating NAV premiums). September: 401(k) crypto access enabled.
Flow-Leverage-Liquidity. The three dimensions during R4:
Flows: Accelerating - ETF inflows strong at $15.2B, stablecoins rising.
Leverage: Building to extremes - OI at yearly highs, funding 6.1% with 14+ consecutive positive days.
Liquidity: Best of year on surface, but depth not keeping pace with OI growth.
Carry Trade Status: Apparently Excellent. Basis peaked at 8.5%. Term structure showed steep contango. But warning signs emerged: funding persistence exceeded 14 days, OI/price divergence starting.
Regime Metrics. Key performance indicators for R4:
Return: +8.0%
Days: 122
Peak OI: $116.4B
ETF Inflows: $15.2B
Liquidations: $31.5B (35% of year)
R4's 30% volatility was the calm before the storm. The lowest volatility of the year immediately preceded the largest liquidation event in crypto history.
R4 is where the October cascade was built. Carry traders loaded positions at an attractive basis. Speculators built leverage on funding that seemed sustainable. The 14+ days of positive funding persistence was the clearest warning signal - extended one-sided positioning always ends the same way.
Real but Overshadowed. The institutional infrastructure expansion during R4 was real and valuable: in-kind redemptions improved ETF efficiency, 401(k) access opened new demand channels. But these positives were overshadowed by the leverage accumulation that institutional infrastructure enabled. More efficient access meant faster leverage buildup.
R4's 122-day duration created complacency. Four months of steady gains (only +8.0% but consistent) convinced participants that conditions were stable. Volatility compressed to 30%. Risk models showed benign readings. But the leverage metrics told a different story: OI peaked at $116.4B while depth didn't keep pace. The setup was dangerous regardless of historical volatility.
122 Days
R4's duration - the longest regime of 2025. Four months of steady gains compressed volatility to 30% while leverage accumulated to dangerous levels. Duration created complacency.
|
SO WHAT? Extended low-volatility periods during leverage accumulation are the most dangerous setup. R4's 122 days of 30% volatility masked $116.4B in OI buildup. When risk models rely on realized volatility, they miss the structural fragility that leverage metrics reveal. |
Regime 5: Macro Shock / Cascade (October 1-31)
The Pivot Point. The pivot point of 2025. A single macro trigger catalyzed the largest deleveraging event in crypto history.
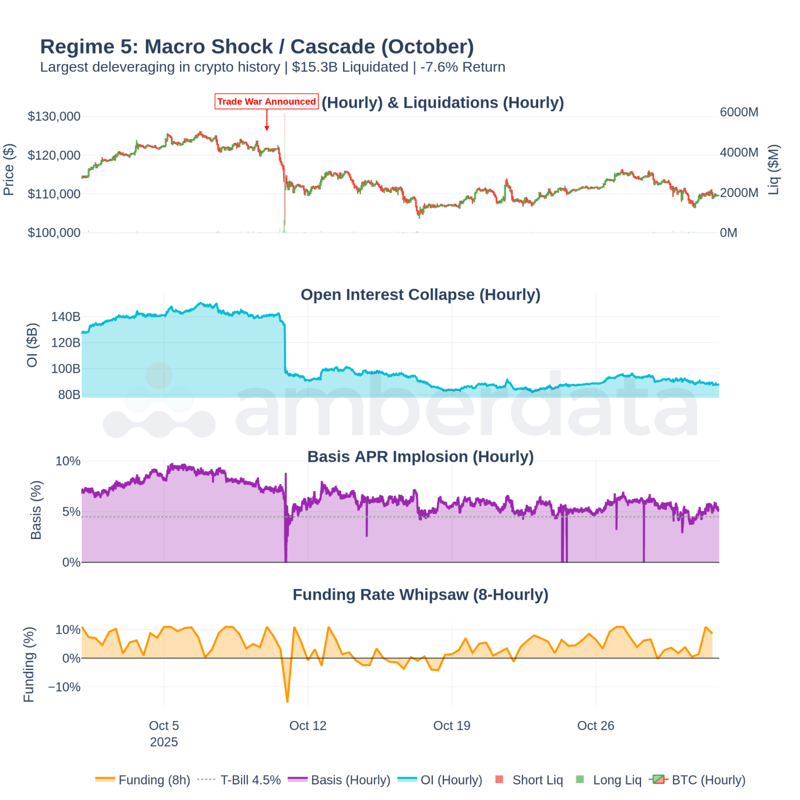
Figure 3.5: Regime 5: Macro Shock / Cascade - October's two-stage crash. Stage 1 (Oct 10, macro trigger) was orderly. Stage 2 (Oct 10-12, leverage cascade) was violent. Note the liquidation spike concentrated in 48 hours.
Trigger. October 10: Trump announces 100% China tariffs. Global risk-off. Crypto caught in the crossfire.
Flow-Leverage-Liquidity. The three dimensions during R5:
Flows: Massive outflows - ETF redemptions spike, exchange withdrawals accelerate.
Leverage: Catastrophic unwind - $15.3B in BTC liquidated, OI collapsed 35%.
Liquidity: Collapse - depth dropped 40% in 48 hours, spreads exploded.
Carry Trade Status: Unviable. Basis collapsed from 6.9% to 4.5%. Term structure briefly inverted (backwardation - fear). Carry traders forced to exit at the worst possible moment.
Regime Metrics. Key performance indicators for R5:
Return: -7.6%
Days: 31
Liquidations: $15.3B (17% of year)
OI Change: -35%
Basis Collapse: 2.4%
$15.3B
October liquidations of BTC. 70% longs ($10.7B). 30% shorts ($4.5B). The market was overwhelmingly positioned one way. October corrected that imbalance violently.
Self-Reinforcing Cascade. The cascade mechanism was self-reinforcing. Tariff news triggered risk-off selling. Basis compression put carry traders underwater. Forced carry unwinds added selling pressure. Liquidations triggered liquidations. Liquidity withdrawal created slippage. The feedback loop ran for 48 hours before exhausting itself.
Structural Damage. The 35% OI collapse in R5 represented structural damage, not just position adjustment. Market makers who provided liquidity withdrew. Arbitrageurs who maintained basis relationships exited. The infrastructure that supported orderly price discovery was impaired. This explains why R6's recovery has been so slow - the market participants who enable efficient functioning haven't fully returned.
R5's Lesson. Cascades are mechanical once triggered, but the conditions for cascades are measurable beforehand. Watch for: funding persistence exceeding 14 days, OI growth exceeding depth growth, basis attractive enough to draw carry capital, and potential macro triggers. October had all four.
The October cascade also demonstrated that price targets become irrelevant during cascades. Positions are closed at whatever price the market offers. Slippage during the worst 48 hours exceeded 5x normal levels. This explains why orderly stop-losses didn't protect many participants - the prices they expected to exit at didn't exist.
The transition from R5 to R6 was gradual exhaustion rather than a distinct trigger. As liquidations depleted, selling pressure eased. Prices stabilized at lower levels. But the structural damage (impaired depth, subdued leverage, cautious market makers) persisted. R6 began not with a catalyst but with the absence of further selling - a fragile stability rather than genuine recovery.
Regime 6: Fragile Recovery (November 1 - December 31)
The Aftermath. The aftermath. The market that emerged from October is structurally different from the market that entered it.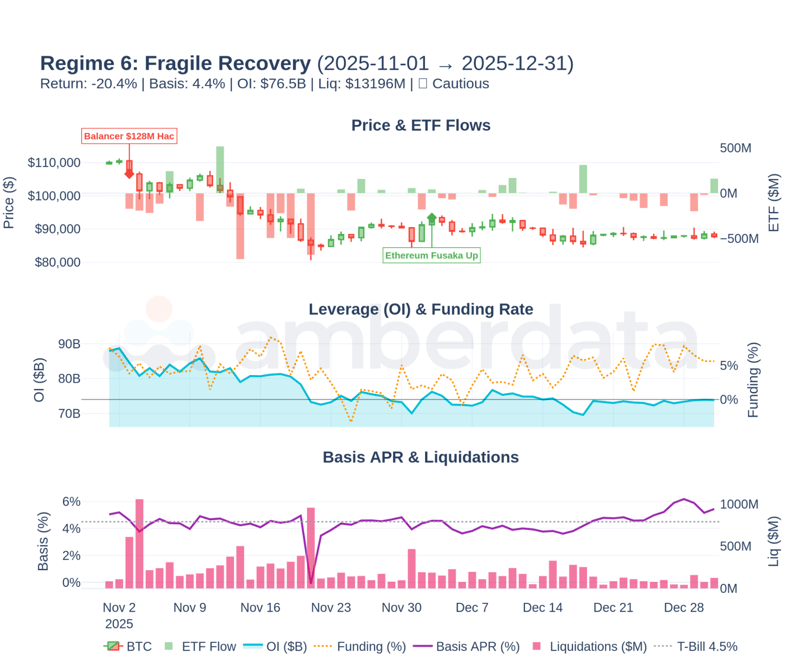
Figure 3.6: Regime 6: Fragile Recovery - R6's subdued activity. Lower OI, mixed ETF flows, depressed basis. The market is healing but not healed.
Trigger. Cascade aftermath plus continued macro uncertainty. November 3: Balancer $128M hack adds to uncertainty. December 3: Ethereum Fusaka upgrade provides a minor positive.
Flow-Leverage-Liquidity. The three dimensions during R6:
Flows: Mixed to weak - ETF flows volatile (-$3.4B net for regime).
Leverage: Subdued - OI $76.5B (40% below peak), funding oscillates around 4.1%.
Liquidity: Impaired - depth still below pre-crash levels.
Carry Trade Status: Marginal. Basis depressed at 4.4% average. Term structure flat (no conviction). Carry trade does not justify capital deployment.
Regime Metrics. Key performance indicators for R6:
Return: -20.4%
Days: 61
OI: $76.5B avg
ETF Flows: -$3.4B
Liquidations: $13.2B
R6's -20.4% return reflects continued weakness, not fresh selling. The market is finding its footing at lower levels. But the fragility persists: depth hasn't recovered, leverage is subdued, and the carry trade offers insufficient returns to attract new institutional capital.
Why No Transition? Why hasn't R6 transitioned to a new accumulation phase? Three factors: First, macro uncertainty persists (trade policy remains unresolved). Second, depth recovery requires market maker confidence that hasn't returned. Third, basis remains unattractive (4.4% versus T-bill rates near 4.5%), so arbitrage capital stays sidelined.
Regime Change Signals. R6 regime change signals to watch: Basis recovery above 6% (indicating renewed speculative interest). Depth recovery above pre-crash levels (indicating market maker return). Consistent ETF inflows above $500M weekly (indicating institutional accumulation). Funding stabilization in 4-8% range (indicating balanced positioning). Until these signals emerge, expect continued range-bound fragility.
The market that emerged from October is structurally different from the market that entered it. R6's fragility will persist until depth recovers, leverage rebuilds responsibly, and carry trade economics attract institutional capital again.
|
SO WHAT? R6 conditions persist entering 2026. Position for fragility until regime change signals emerge: basis above 6%, depth recovery, consistent ETF inflows above $500M weekly. Until then, expect range-bound volatility. |
Regime Comparison: The Full Picture
Side-by-Side Analysis. Comparing regimes side-by-side reveals the patterns that drove 2025's outcomes.
 Figure 3.7: 2025 Regime Comparison Matrix - All six regimes compared across key metrics. Note the extreme dispersion: R3's +21.5% vs R6's -20.4%. Regime identification matters more than market timing within the regime.
Performance Extremes. The dispersion across regimes:
Best Performer: R3 Infrastructure Build: +21.5% return with moderate leverage
Worst Performer: R6 Fragile Recovery: -20.4% return, aftermath of structural damage
Highest Leverage: R4 Institutional Expansion: Peak OI $116.4B
Largest Liquidations: R5 Macro Shock: $15.3B (17% of year in 31 days)
The comparison reveals the asymmetry between accumulation and liquidation phases. R4 took 122 days to build $31.5B in liquidation-generating leverage. R5 unwound a significant portion of that leverage in 31 days. The buildup is gradual; the unwind is violent. This asymmetry explains why crashes feel worse than rallies even when the percentage moves are similar.
Portfolio Construction Implications. For portfolio construction: regime identification matters more than market timing within a regime. R3 conditions favor accumulation strategies. R4 conditions favor hedging or reduced exposure despite positive returns. R6 conditions favor patience and selective positioning. The regime framework enables strategic positioning even without precise timing.
The dispersion across regimes is striking: R3's +21.5% versus R6's -20.4% represents a 42 percentage point swing. Within the same calendar year, the same asset delivered both substantial gains and substantial losses depending on timing. This dispersion underscores why regime identification matters more than general market outlook.
2026 Planning. For 2026 planning: monitor for R3-type conditions (moderate leverage, improving fundamentals, steady accumulation) as the ideal entry environment. Avoid adding exposure during R4-type conditions (extended duration, leverage accumulation, compressed volatility, funding persistence). Pre-position hedges before potential R5-type triggers (macro events hitting elevated leverage).
Cumulative Liquidations by Regime
Leverage Distribution. The liquidation distribution reveals where leverage concentrated and when it unwound.
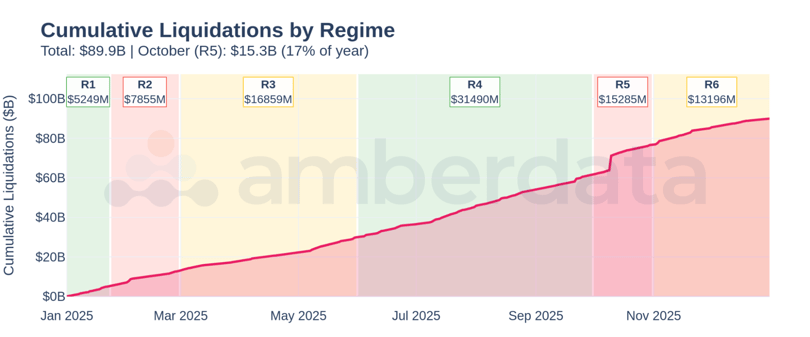
Figure 3.8: Cumulative Liquidations by Regime - Total BTC YTD liquidations: $89.9B. R4 contributed 35%, R5 contributed 17%. The leverage built in R4 unwound in R5.
BTC Liquidation Distribution. How liquidations distributed across regimes:
R1: $5.2B (6%)
R2: $7.9B (9%)
R3: $16.9B (19%)
R4: $31.5B (35%)
R5: $15.3B (17%)
R6: $13.2B (15%)
The pattern is clear: R4 accumulated 35% of annual liquidations during the buildup phase (normal market functioning with leverage churn). R5 concentrated 17% in 31 days (the cascade). Together, these two regimes accounted for over half of annual liquidation volume. The leverage that built over 122 days (R4) unwound over 31 days (R5).
Total Context. The $89.9B BTC cumulative total liquidation figure in 2025 represents structural churn - the cost of leverage in a volatile market. In R3's healthy accumulation phase, $16.9B in liquidations still occurred (19% of annual). Liquidations are not inherently problematic; concentrated liquidations in thin liquidity are problematic.
2026 Risk Assessment. For 2026 risk assessment: monitor liquidation intensity (liquidations relative to OI) rather than absolute liquidation volume. R5's 17% share of annual liquidations concentrated in 31 days represents 6x the normal daily intensity. That intensity, not the absolute number, indicates cascade conditions.
The liquidation data also reveals the importance of the accumulation-to-liquidation ratio. R4's 122 days accumulated $31.5B in liquidation-generating positions. R5's 31 days unwound a large portion of that. The ratio - roughly 4:1 accumulation time to unwind time - suggests that markets build fragility slowly but release it quickly. This asymmetry should inform position sizing and hedging timelines.
|
THE BOTTOM LINE |
|---|
|
Understanding 2025 requires understanding these six regimes. Each subsequent analysis in the Amberdata Crypto Market Review 2025 contextualizes data within this framework - because the same metric means different things in Policy Euphoria versus Fragile Recovery. For 2026, monitor for regime transitions: the signals that indicate shift from R6's fragility to a new accumulation phase (basis recovery, depth restoration, consistent ETF inflows) or deterioration to renewed stress (funding persistence, OI/price divergence, depth withdrawal). |
This regime framework applies (S2)'s volatility analysis to define the six distinct market phases. The triggers, signatures, and transitions established here provide the analytical spine that all subsequent sections reference.
From here, (S4) quantifies risk-adjusted performance by regime, (S5) examines carry trade economics across regimes, and (S6) analyzes how liquidity conditions evolved through each stress event. The cascade dynamics and regime characteristics introduced here recur throughout Sections 6-14.
This article provides the regime analysis. The full Amberdata Crypto Market Review 2025 goes deeper:
- The $80,000 floor: What happens when ETF cost basis breaks?
- Which ETF issuer is already underwater? The entity-level breakdown reveals all
- October's "capitulation"? The data says arbitrage - here's the carry trade proof
- 123,173 BTC: The mega whale accumulation hiding in plain sight
- Six regimes, 14 sections: One framework that explains everything
- Early or late cycle? On-chain valuation signals decoded
- $60K or $180K? 2026 scenarios with specific price targets
- DeFi's $2B security crisis: What broke and why it matters
- SAB 121 to 401(k): The regulatory timeline reshaping crypto
- And more...

[DOWNLOAD THE FULL AMBERDATA CRYPTO MARKET REVIEW 2025]
Full-Market Research. Institutional Depth. Derivatives, ETFs, on-chain, DEXs, microstructure, risk signals - and more. Subscribe at the bottom of our page for research that covers every corner of crypto and visit the Amberdata Research Blog.
Access Amberdata Intelligence for institutional-grade digital asset intelligence, or contact our team to discuss custom solutions.
Links & Resources
Platform
Recommended next reads
ETF Cost Basis Series
- Part 1/3: The $80,000 Floor (ETF Cost Basis)
- Part 2/3: Who Breaks First (ETF Cost Basis)
- Part 3/3: The Stress Test (ETF Cost Basis)
More key reads
- The ETF Exodus Decoded: Basis Arbitrage, Not Capitulation
- Bitcoin's Great Rotation: Who Bought the Dip and Why It Matters
- October 2025 Crash (7 charts): How $3.21B Vanished in 60 Seconds
- Beyond the Spread: Market Impact and Execution
Disclaimers
The information contained in this report is provided by Amberdata solely for educational and informational purposes. The contents of this report should not be construed as financial, investment, legal, tax, or any other form of professional advice. Amberdata does not provide personalized recommendations; any opinions or suggestions expressed in this report are for general informational purposes only.
Although Amberdata has made every effort to ensure the accuracy and completeness of the information provided, it cannot be held responsible for any errors, omissions, inaccuracies, or outdated information. Market conditions, regulations, and laws are subject to change, and readers should perform their own research and consult with a qualified professional before making any financial decisions or taking any actions based on the information provided in this report.
Past performance is not indicative of future results, and any investments discussed or mentioned in this report may not be suitable for all individuals or circumstances. Investing involves risks, and the value of investments can go up or down. Amberdata disclaims any liability for any loss or damage that may arise from the use of, or reliance on, the information contained in this report.
By accessing and using the information provided in this report, you agree to indemnify and hold harmless Amberdata, its affiliates, and their respective officers, directors, employees, and agents from and against any and all claims, losses, liabilities, damages, or expenses (including reasonable attorney's fees) arising from your use of or reliance on the information contained herein.
Copyright © 2026 Amberdata. All rights reserved.