Share this blog:

Now available: 2026 Outlook: The End of the Four-Year Cycle - institutional flows as the marginal driver, a scenario map for 2026, and the indicators we are watching (basis APR, depth recovery, sustained ETF flows, 401(k) + regulatory announcements).
Our comprehensive weekly coverage of price action and volatility, trading volumes and market structure (orderbook depth/spreads), derivatives markets (open interest, funding rates, long/short positioning, term structure/basis), institutional flows (Bitcoin ETFs, stablecoin supply across chains), and DeFi credit markets (lending protocol TVL, utilization, liquidations).
News
- Kevin Warsh Nominated as Federal Reserve Chair: President Trump nominated former Fed governor Kevin Warsh to succeed Jerome Powell. Warsh has mixed crypto views - calling projects 'fraudulent' in 2022 but more recently stating Bitcoin 'does not make me nervous.' Markets assess hawkish policy implications.
- Crypto Markets Stage Monday Rebound: DeFi sector led recovery with 3.53% gains, Hyperliquid surging 19.85%. Bitcoin advanced 3.75% to recover above $78,000 while Ethereum gained 4.41% to break past $2,340 after the brutal weekend selloff.
- Fear and Greed Index Hits Extreme Fear at 14: Market sentiment collapsed to its lowest point of 2026 as protective put options at $75,000 strike now command $1.16 billion in notional open interest - matching bullish $100,000 calls. The balance signals fear dominating speculation.
- DeFi TVL Holds Resilience Despite Market Carnage: Despite major cryptocurrencies plunging to multi-month lows and forced liquidations rippling through markets, DeFi's total value locked slipped only modestly, demonstrating the sector's structural strength during stress.
Market Analytics
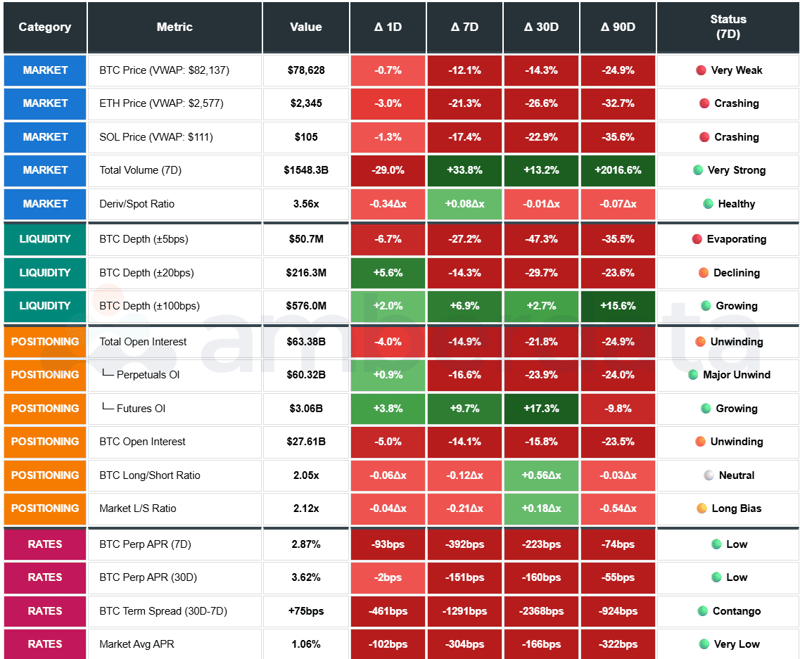
Brutal Deleveraging, Risk-Off Capitulation: Digital assets suffered their worst weekly performance since October 2025. BTC collapsed -12.1% to $78,628, breaching the critical $80,000 support as ETF outflows and cascading liquidations overwhelmed demand. ETH underperformed sharply at -21.3% to $2,345, while alts saw even deeper drawdowns: SOL -17.4% to $104.54, XRP -16.0% to $1.62, DOGE -14.0% to $0.108. The weekend plunge to $74,876 marked the largest liquidation cascade since October's $19 billion event, with $2.56 billion in positions wiped in a single session.
Derivatives Structure Confirms Flush: Total open interest collapsed -14.9% to $63.38B as leverage was forcibly unwound across all venues. BTC OI fell -14.1% to $27.61B, ETH -25.8% to $14.61B. Funding rates flipped negative market-wide for the first time this cycle (-0.11% 7D avg), with SOL deeply negative at -0.58%. The term structure inverted with BTC 7D basis at just 2.87% APR (-392bps WoW). These are classic late-stage deleveraging signals - the speculative froth has been thoroughly purged.
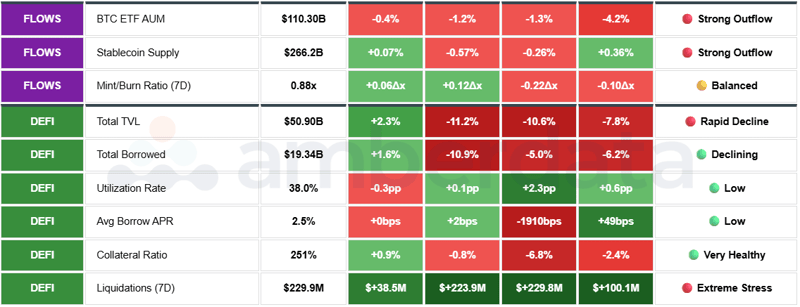
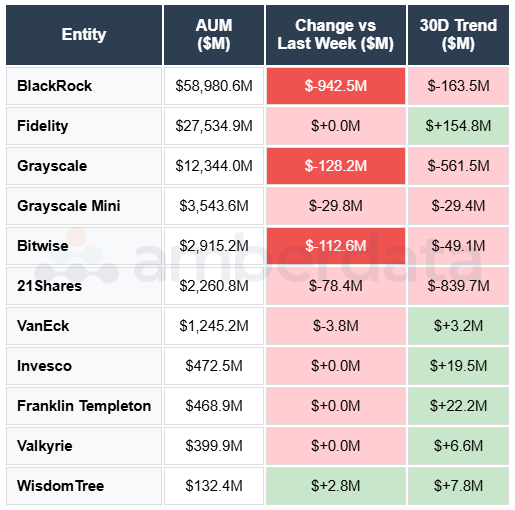
Institutional Exodus Accelerates: Bitcoin ETFs recorded -$1,292M in weekly outflows - the largest since November's basis trade unwind. BlackRock's IBIT led with -$942.5M as institutional sentiment turned risk-off decisively. Stablecoin supply contracted -$1,512M as capital fled the ecosystem, with USDC seeing -$1,390M in burns alone. Orderbook depth held surprisingly well on BTC (+13.3% to $640.5M), but ETH and SOL liquidity deteriorated (-8.0% and -14.8% respectively).
Forward Outlook: Market in acute capitulation phase with sentiment at cycle lows. Constructive: deleveraging nearly complete, funding negative (shorts now paying longs), large holder accumulation visible on-chain. Cautious: ETF outflows persisting, macro uncertainty elevated, $70K support critical. Key levels: BTC $75K support tested and held, $80K recapture needed for stabilization. Current regime: late-stage washout, watch for flow reversal signals.
PRICES, VOLATILITY, AND VOLUMES
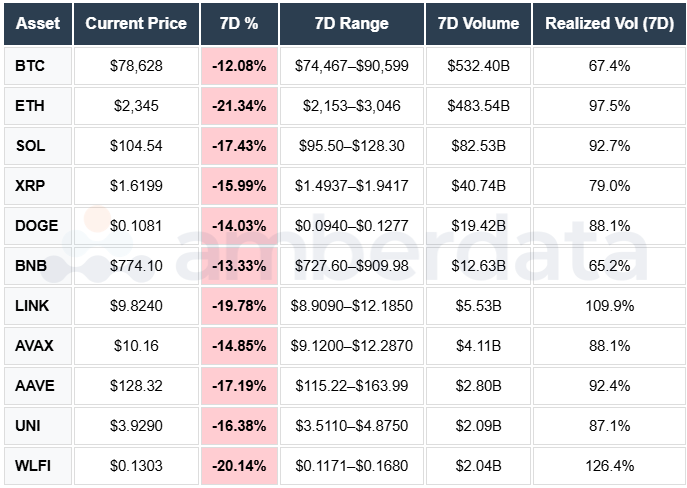
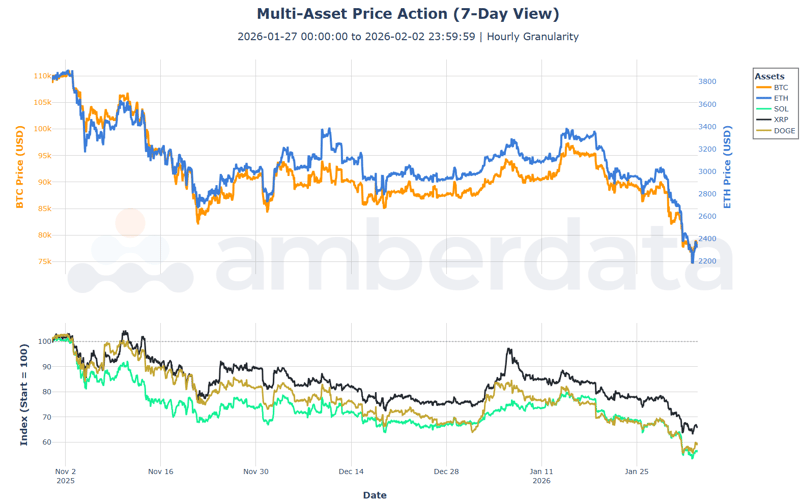
Majors Crushed, Alts Decimated: BTC fell -12.1% to $78,628 as of end-of-day February 2, trading within a brutal $74,467-$90,599 range after breaching April's lows. ETH suffered even worse at -21.3% to $2,345, with a range $2,153-$3,046. Alt destruction was comprehensive: SOL -17.4% to $104.54, XRP -16.0% to $1.62, DOGE -14.0% to $0.108, BNB -13.3% to $774.10, LINK -19.8% to $9.82, AVAX -14.9% to $10.16. No asset escaped the carnage as risk appetite evaporated entirely.
Volume Surge Confirms Panic Selling: Total 7D volume exploded to $1,548B (+33.8% WoW) as forced liquidations drove unprecedented turnover. Spot volume reached $339.7B, derivatives $1,208.6B. The D/S ratio held at 3.56x, indicating leverage remained consistent even as positions were liquidated. BTC spot volume hit $125.9B, ETH $73.9B, SOL $14.9B. The volume spike on a price decline confirms distribution rather than accumulation - sellers dominated all sessions.
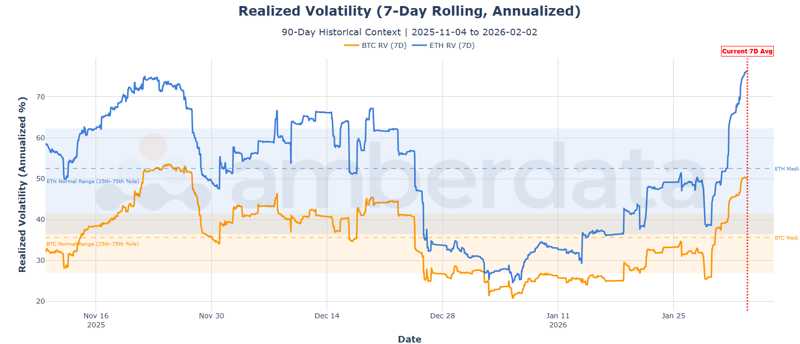
Volatility Spikes to Elevated Regime: BTC realized volatility surged to 67.4% (7D), well above the 90-day median of 35.6% and in the elevated regime. ETH volatility even higher at 97.5%, reflecting its deeper drawdown. Alt vols extreme: LINK 109.9%, SOL 92.7%, DOGE 88.1%. This elevated vol regime typically persists for 2-4 weeks following liquidation cascades before mean reverting.
Forward Signals: Watch for BTC reclaiming $80K with declining volume as a stabilization signal. The $74K-$75K zone established weekend support - a break below would target the $68K-$70K ETF cost basis cluster. ETH/BTC ratio at 0.0298 is cycle lows - mean reversion potential if risk appetite returns. Current volatility regime suggests a continued chop before directional resolution.
OPEN INTEREST
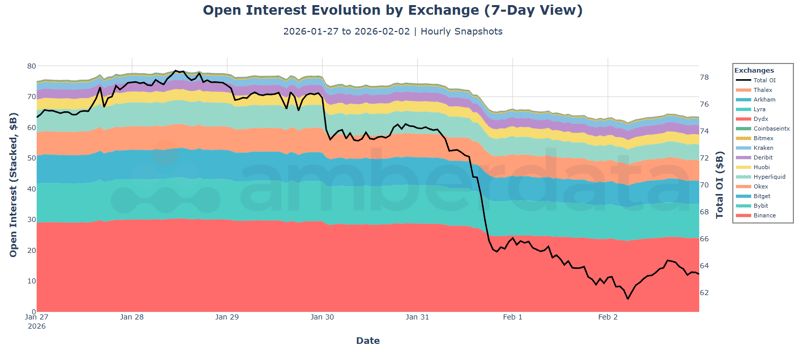
OI Collapse Confirms Deleveraging: Total open interest plunged -14.9% (-$11.06B) to $63.38B - the largest weekly OI decline since October's liquidation cascade. BTC OI fell -14.1% to $27.61B, ETH -25.8% to $14.61B (worst performer), SOL -14.3% to $3.48B. Combined BTC+ETH concentration at 66.6% of total OI. Market structure remains perpetual-heavy at 95.2% perps versus 4.8% dated futures, indicating retail-speculative positioning still dominates.
Alt OI Diverges Sharply: While majors saw uniform declines, memecoins showed resilience. HYPE surged +31.7% to $1.44B despite market turmoil. XRP -13.7%, BNB -12.7%, DOGE -8.6%. Notable outliers: XAG (silver perps) exploded +552.9% as precious metals volatility drove hedging demand. XAUT (gold perps) gained +18.0%. The bifurcation shows capital rotating to safe haven exposures even within crypto derivatives.
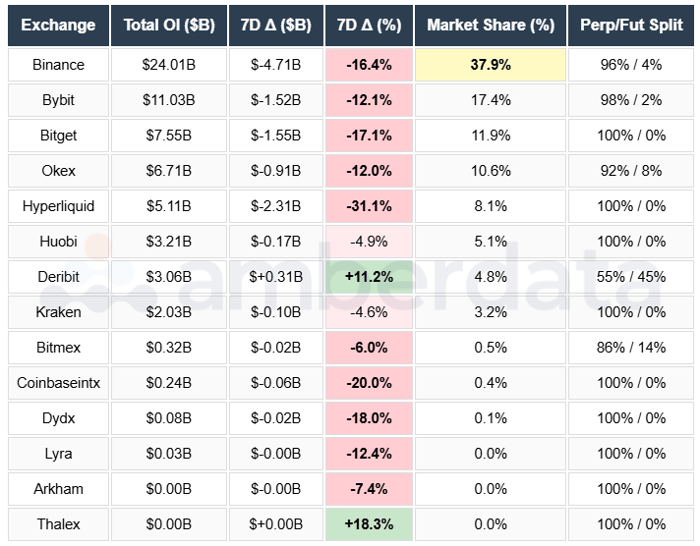
Venue Distribution Reflects Risk-Off: Binance dominated declines with -$4.71B (-16.4%) to $24.01B, maintaining 37.9% share. Bybit -$1.52B (-12.1%) to $11.03B. Hyperliquid suffered worst with -31.1% as DEX perp traders deleveraged aggressively. Notably, Deribit GAINED +11.2% (+$310M) to $3.06B as options activity surged for downside protection - the only venue with positive flows.
Forward Signals: Current $63.4B OI represents significant deleveraging from $74.4B. Watch for OI stabilization above $60B as floor establishing. Perp funding deeply negative suggests shorts now crowded - potential squeeze setup if sentiment reverses. Deribit growth indicates institutional hedging increasing, a healthy sign of maturing market structure.
FUNDING RATES
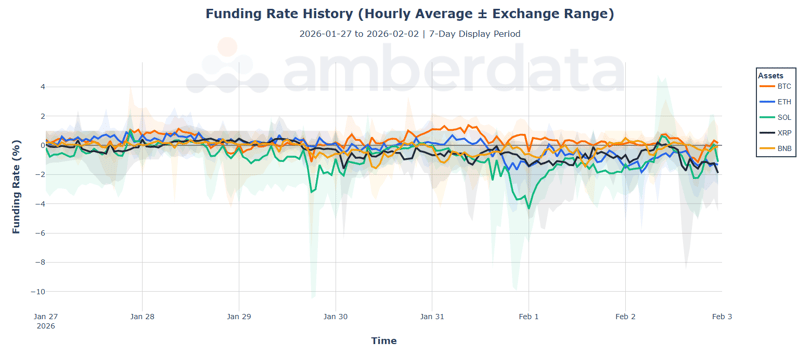
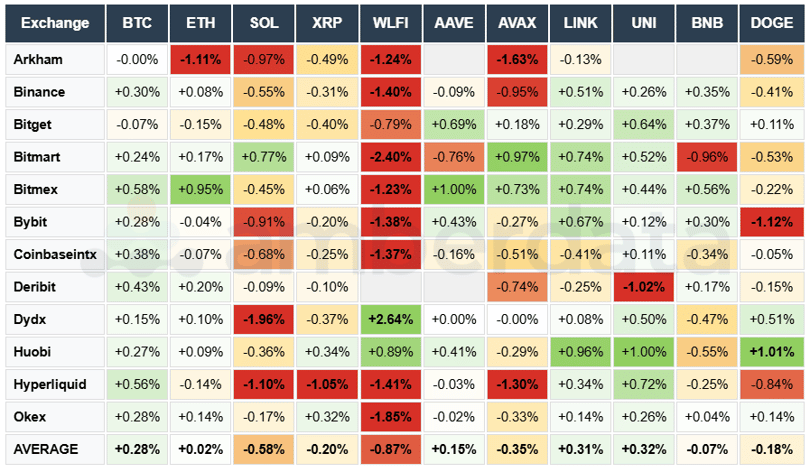
Majors Flip Bearish, First Time This Cycle: BTC funding averaged +0.28% (38.6% APR) over 7D but ended the week negative for the first time since November. ETH collapsed to +0.02% (2.5% APR), barely positive. SOL deeply negative at -0.58% (-79.4% APR) - shorts paying longs heavily. Market-wide average at -0.11% (-14.4% APR) confirms sentiment has fully flipped bearish. The negative funding regime indicates genuine deleveraging completion, not just price decline.
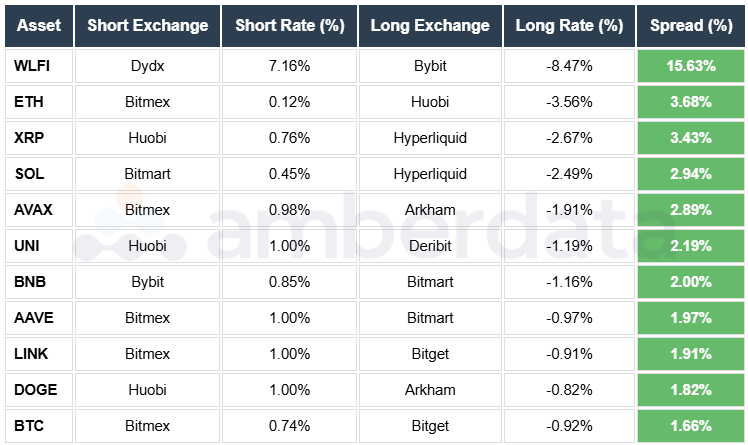
Alt Funding Shows Stress: XRP funding negative, DOGE moderately positive at +0.27%, BNB mixed. The WLFI spread reached extremes at 15.63% between Dydx (+7.16%) and Bybit (-8.47%) - massive arbitrage opportunity for sophisticated traders. ETH spread also wide at 3.68% (Bitmex to Huobi). These spreads indicate fragmented liquidity and exchange-specific positioning divergence.
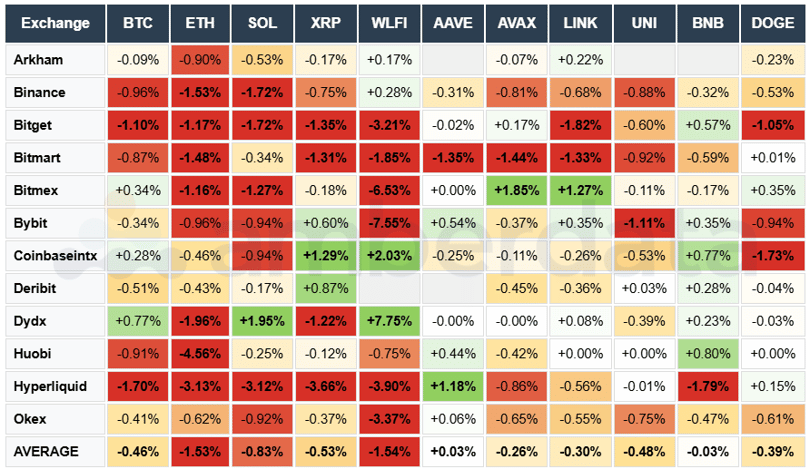
Exchange Spreads Signal Dislocation: Intra-day funding swings were extreme. BTC ranged from +1.38% to -1.14% within the week. ETH saw -1.84% on February 2nd morning - aggressive short pressure. SOL hit -4.34% on February 1st - panic shorts. These extreme readings typically mark local bottoms as overleveraged shorts get squeezed on any bounce.
Forward Signals: Negative funding is historically bullish - it means holding longs is now profitable from funding alone. Watch for funding to remain negative while price stabilizes as an accumulation signal. A funding flip back to positive +0.5% without significant price appreciation would signal fresh long crowding and renewed vulnerability.
Current
Week on Week
Arbitrage Opportunities
ORDERBOOK DEPTH
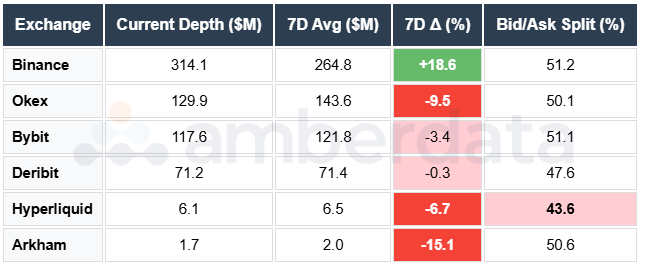
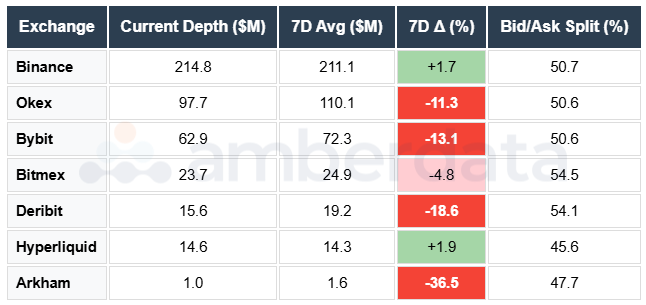
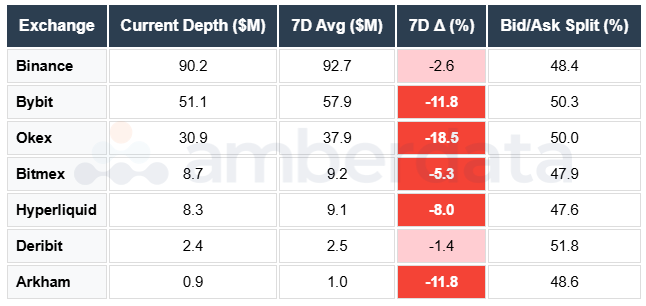
BTC Liquidity Resilient, Alts Stressed: BTC depth at 200bps reached $640.5M, actually increasing +13.3% versus 7D average despite the carnage. This resilience reflects market makers maintaining commitment to the flagship asset. ETH depth contracted to $430.3M (-8.0% vs 7DMA), SOL to $192.6M (-14.8%) as liquidity providers pulled back from risk assets.
Depth Distribution Shows Flight to Quality: BTC bid/ask split remained balanced at 52%/48% - no significant imbalance despite selling pressure. ETH similar at 52%/48%. SOL perfectly balanced at 50%/50%. The lack of bid-side withdrawal suggests market makers view these levels as accumulation zones rather than distribution. Venue-wise, Binance and OKX maintained the deepest books.
Multi-Timeframe Changes Reveal Pattern: BTC depth is +23.4% vs 90D average despite recent volatility - structural liquidity improvement persists. ETH -12.4% vs 90D shows relative weakness. The divergence confirms BTC's safe haven status within crypto during risk-off periods, while ETH trades more like a risk asset.
Forward Signals: Watch for BTC depth above $600M sustained as a market maker confidence indicator. ETH depth below $400M would signal further stress. Bid-side withdrawal (below 48%) would indicate distributive behavior. Current readings suggest professional liquidity remains engaged at these levels.
BTC Orderbook Depth Table
ETH Orderbook Depth Table
SOL Orderbook Depth Table
ORDERBOOK SPREADS
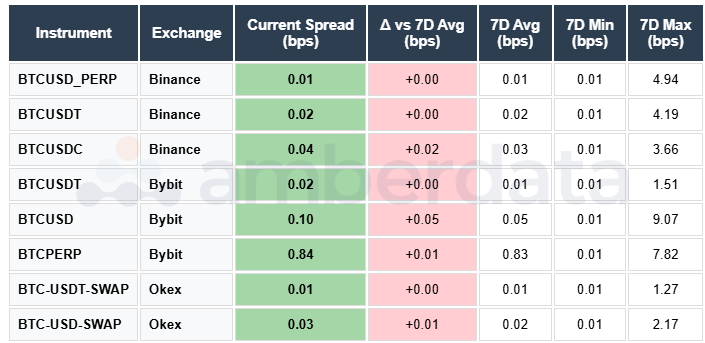
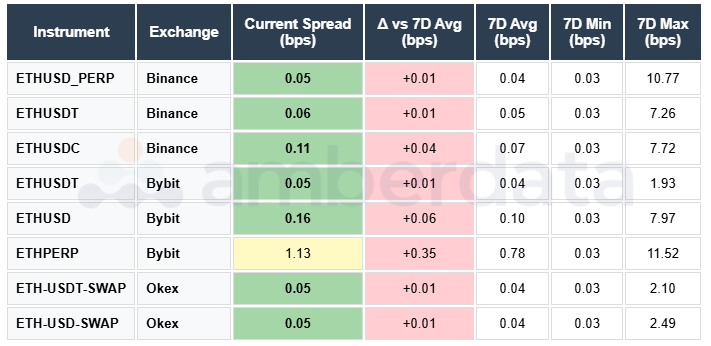
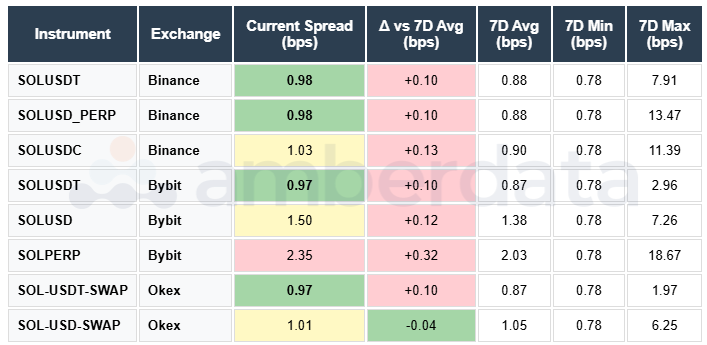
Spreads Widen But Remain Tight: BTC average spread at 0.13bps remains excellent despite volatility (+64.5% vs 7D, but from compressed base). ETH spread widened to 0.21bps (+90.4%), SOL to 1.22bps (+28.6%). In context, these are still institutional-grade execution conditions - the October crash saw spreads blow out 3-5x current levels.
Venue Spread Comparison: Binance maintains the tightest spreads across all majors. OKX competitive on BTC, slightly wider on alts. Bybit spreads widened most during weekend volatility but recovered Monday. Cross-venue spread arbitrage opportunities emerged during peak stress but normalized within hours.
Spread Volatility Pattern: Intraweek spread volatility was elevated but manageable. Peak spread expansion occurred during the Saturday liquidation cascade, with BTC briefly touching 0.5bps before reverting. This is significantly better behavior than historical stress events, reflecting improved market microstructure.
Forward Signals: Spreads above 0.3bps sustained on BTC would signal liquidity stress. Current levels suggest execution remains efficient despite volatility. Monitor weekend sessions closely as liquidity thins - that's when spread expansion creates slippage risk for larger orders.
LONG/SHORT RATIOS
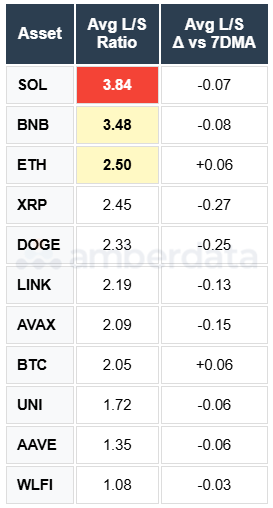
Long Bias Persists Despite Drawdown: BTC L/S ratio at 2.05x (Neutral) declined -5.4% WoW as longs were liquidated but remains above 2.0. ETH 2.50x (Bullish bias), SOL elevated at 3.84x (Extreme Bullish) despite -11.1% decline. The persistence of long bias even after liquidations suggests dip buyers are active and conviction remains.
Cross-Asset Positioning: BNB shows highest major L/S at 3.48x, indicating strong holder conviction. XRP at 2.45x, DOGE at 2.33x - all maintaining long bias. Only WLFI dropped below neutral to 1.08x. The uniform long bias across assets suggests this is sentiment-driven (bullish conviction) rather than mechanical (overcrowded positioning).
Exchange-Level Analysis: Binance L/S ratios generally lower than Bybit, reflecting more balanced retail order flow. OKX showing elevated ratios, suggesting concentrated long positioning on that venue. The exchange divergence creates potential for venue-specific squeezes.
Forward Signals: L/S above 4.0x would signal extreme crowding and vulnerability. Current readings suggest a healthy long conviction without dangerous overcrowding. Watch for L/S compression toward 1.5x as a sentiment normalization signal. SOL's 3.84x warrants monitoring for potential long squeeze risk.
BASIS/APR
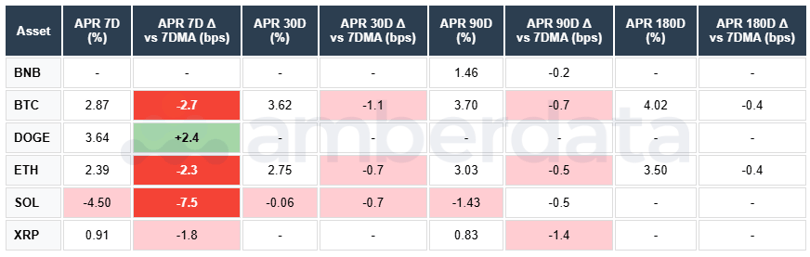
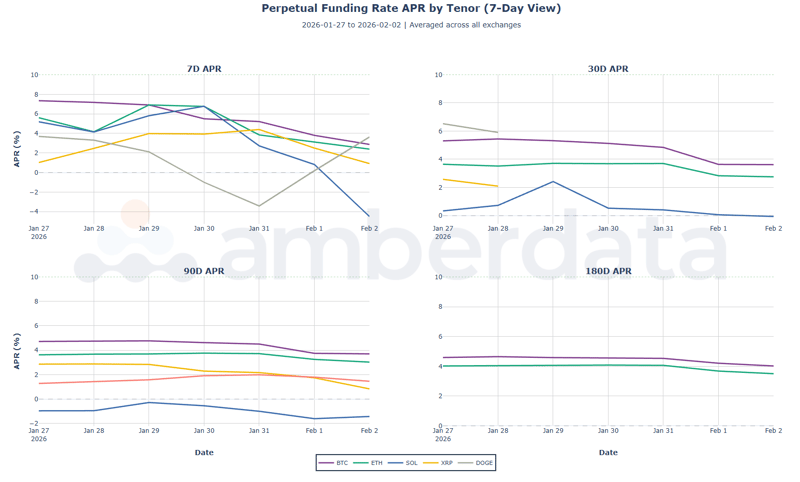
Basis Crushed, Carry Trade Unwinding: BTC 7D basis collapsed to 2.87% APR (-392bps WoW), the lowest since the October crash. ETH 7D at 2.39% APR (-343bps), also cycle lows. SOL flipped deeply negative at -4.50% APR (-873bps) - shorts paying to hold positions. The basis compression signals a carry trade unwind as futures premium evaporated.
ETH Term Structure Remains Upward Sloping: Despite compression, ETH maintains normal contango: 7D 2.39%, 30D 2.75%, 90D 3.03%, 180D 3.50%. This healthy term structure suggests the selloff is not systemic fear but rather leverage reset. BTC similar: 7D 2.87%, 30D 3.62%, 90D 3.70%, 180D 4.02%.
SOL Backwardation Signals Stress: SOL's negative 7D basis (-4.50%) indicates futures trading below spot - classic backwardation. This only occurs during acute selling pressure when shorts dominate and longs exit. The 30D basis at -0.06% suggests near-term stress is expected to persist.
Forward Signals: Basis recovery above 5% APR would signal sentiment normalization and renewed carry trade interest. Current compressed levels make long basis positions attractive for patient capital. Watch for SOL backwardation to resolve as a short squeeze signal. CME basis premium versus offshore venues indicates institutional positioning.
BITCOIN ETF FLOWS
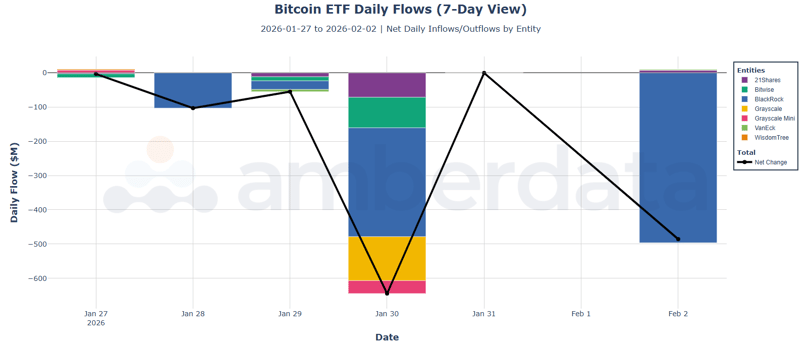
Weekly Outflows Accelerate: Bitcoin ETFs recorded -$1,292.4M in weekly outflows across 6 trading days - all negative. The exodus accelerated through the week: Jan 27 -$3.4M, Jan 28 -$103.2M, Jan 29 -$55.2M, Jan 30 -$644.4M, Jan 31 -$0.6M, Feb 2 -$485.6M. No positive flow days marked the first full week of uninterrupted selling since November.
BlackRock and Grayscale Lead Redemptions: IBIT suffered -$942.5M in outflows, representing 73% of total redemptions. Grayscale GBTC -$128.2M, Bitwise -$112.6M, 21Shares -$78.4M, Grayscale Mini -$29.8M. Only WisdomTree saw marginal inflows at +$2.8M. The concentrated IBIT outflows suggest institutional rebalancing rather than broad retail exodus.
AUM Declines to $110.3B: Total ETF AUM at $110.30B (-1.2% WoW from flows, additional decline from NAV). BlackRock maintains dominance at $58.98B (53.5% share), Fidelity $27.53B (25.0%), Grayscale $12.34B (11.2%). The 30D trend shows -$1,429M cumulative outflows - sustained selling pressure persisting through January.
Forward Signals: ETF flow reversal is the key catalyst to monitor. A single day of +$500M inflows would signal institutional re-engagement. Current outflows are orderly (not panic) and concentrated in largest products. Aggregate ETF cost basis around $79,800 provides structural support - current price hovering just below this level creates compelling entry for fresh institutional allocation.
STABLECOIN FLOWS
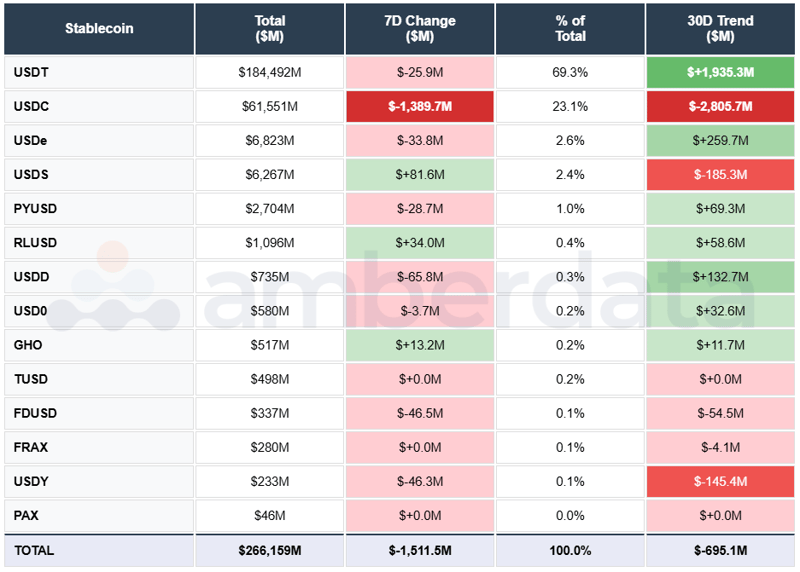
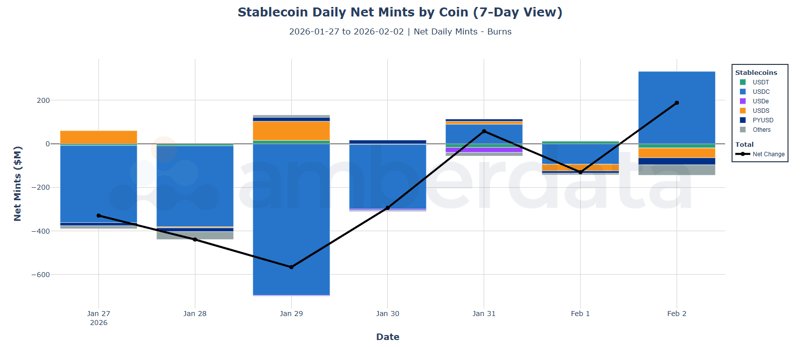
Weekly Contraction Signals Capital Flight: Total stablecoin supply contracted to $266.2B with -$1,511.5M in net burns over 7D - the largest weekly outflow since December. USDC bore the brunt with -$1,389.7M in burns as institutional/regulated capital exited. USDT saw modest -$25.9M, USDS (Sky/Maker) actually grew +$81.6M. The divergence shows retail/offshore (USDT) holding while institutional (USDC) retreated.
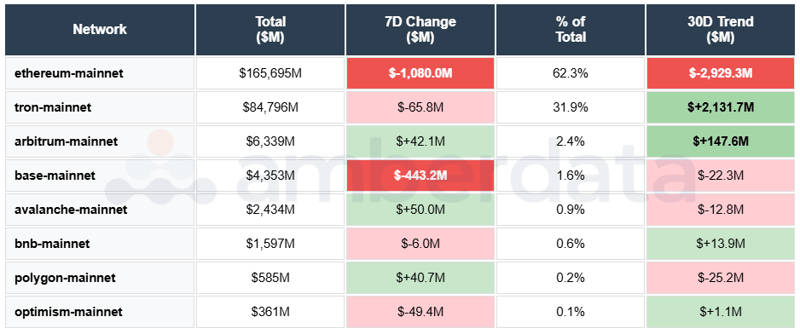
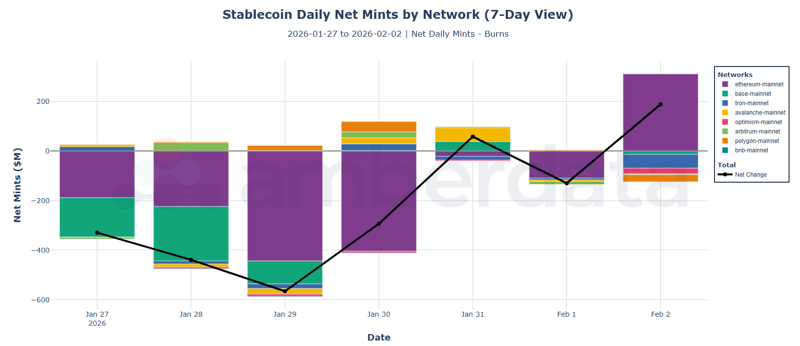
Network Flows Favor L2s: Ethereum mainnet saw -$1,080M in outflows, Base -$443.2M, Tron -$65.8M. Positive inflows on Avalanche +$50.0M, Arbitrum +$42.1M, Polygon +$40.7M. The L2 inflows suggest capital rotating to lower-cost chains for DeFi activity rather than leaving crypto entirely. Ethereum mainnet's outsized decline reflects institutional exodus.
Supply Composition Stable: USDT maintains dominance at $184.5B (69.3% share), USDC at $61.6B (23.1%), USDe $6.8B (2.6%), USDS $6.3B (2.4%). The USDT/USDC divergence persists - offshore preference over regulated. Total $266B represents substantial dry powder available for redeployment when sentiment shifts.
Forward Signals: Watch for USDC inflows turning positive as an institutional re-engagement signal. Net mints exceeding +$1B sustained would indicate significant capital formation. Current outflows are concerning but total supply remains near cycle highs - this is rotation/rebalancing, not structural collapse.
DEFI LENDING
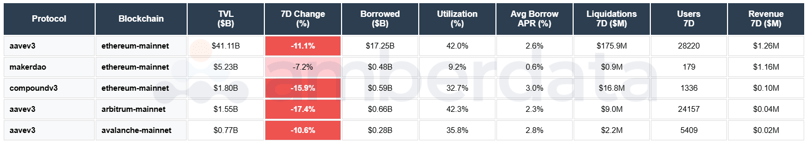
TVL Contracts But Credit Remains Healthy: Total DeFi lending TVL declined to $50.90B (-11.2% WoW), tracking broader market drawdown. Aave v3 Ethereum dominates at $41.11B (80.8% of tracked TVL). Despite the selloff, protocol concentration remains stable and no major protocol stress events occurred. The TVL decline is mark-to-market rather than withdrawal-driven.
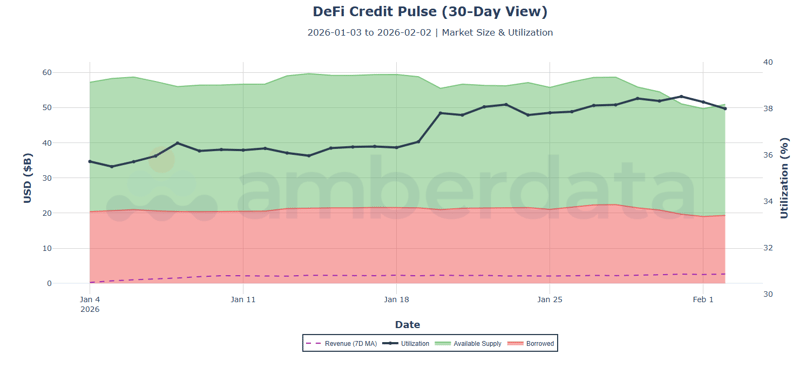
Utilization Low, Capacity Ample: Market-wide utilization at 38.0%, down slightly from prior week. Total borrowed $19.34B against $50.9B deposits leaves $31.6B in available lending capacity. Aave v3 utilization at 42.0%. These low utilization rates mean credit markets remain loose - no rate pressure or cascading liquidation risk from on-chain lending.
Liquidations Elevated But Contained: 7D DeFi liquidations reached $229.9M - elevated from near-zero prior weeks but remarkably contained given price moves. This is approximately 0.45% of TVL, well below stress thresholds. The moderate liquidations despite sharp price declines indicate DeFi users maintain conservative LTV ratios learned from previous cycles.
Forward Signals: Watch for utilization above 45% as a credit tightening signal. Liquidations exceeding $500M/week would indicate collateral stress. TVL stabilization above $50B confirms structural floor. Current readings show DeFi credit markets functioning well through volatility - a significant maturation from 2022 behavior.
Full-Market Research. Institutional Depth. Derivatives, ETFs, on-chain, DEXs, microstructure, risk signals - and more. Subscribe at the bottom of our page for research that covers every corner of crypto and visit Amberdata Research.
Access Amberdata Intelligence for institutional-grade digital asset intelligence, or contact our team to discuss custom solutions.

Links & Resources
Platform
Recommended Next Reads
Now available: 2026 Outlook: The End of the Four-Year Cycle - institutional flows as the marginal driver, a scenario map for 2026, and the indicators we are watching (basis APR, depth recovery, sustained ETF flows, 401(k) + regulatory announcements).
ETF Cost Basis Series
- Part 1/3: The $80,000 Floor (ETF Cost Basis)
- Part 2/3: Who Breaks First (ETF Cost Basis)
- Part 3/3: The Stress Test (ETF Cost Basis)
More Key Reads
- The ETF Exodus Decoded: Basis Arbitrage, Not Capitulation
- Bitcoin's Great Rotation: Who Bought the Dip and Why It Matters
- October 2025 Crash: How $3.21B Vanished in 60 Seconds
- Beyond the Spread: Market Impact and Execution
Disclaimers
The information contained in this report is provided by Amberdata solely for educational and informational purposes. The contents of this report should not be construed as financial, investment, legal, tax, or any other form of professional advice. Amberdata does not provide personalized recommendations; any opinions or suggestions expressed in this report are for general informational purposes only.
Although Amberdata has made every effort to ensure the accuracy and completeness of the information provided, it cannot be held responsible for any errors, omissions, inaccuracies, or outdated information. Market conditions, regulations, and laws are subject to change, and readers should perform their own research and consult with a qualified professional before making any financial decisions or taking any actions based on the information provided in this report.
Past performance is not indicative of future results, and any investments discussed or mentioned in this report may not be suitable for all individuals or circumstances. Investing involves risks, and the value of investments can go up or down. Amberdata disclaims any liability for any loss or damage that may arise from the use of, or reliance on, the information contained in this report.
By accessing and using the information provided in this report, you agree to indemnify and hold harmless Amberdata, its affiliates, and their respective officers, directors, employees, and agents from and against any and all claims, losses, liabilities, damages, or expenses (including reasonable attorney's fees) arising from your use of or reliance on the information contained herein.
Copyright © 2026 Amberdata. All rights reserved.