Share this blog:
This is Section 9, excerpted from our Amberdata Crypto Market Review 2025 and 2026 Outlook: Six Regimes, One Story. Our full report spans 14 sections - ETF flows, derivatives, on-chain, liquidity, and our complete 2026 outlook.
HODL waves, balance buckets, and the wealth transfer that defined 2025
|
KEY TAKEAWAYS |
|---|
|
While ETFs reported outflows and headlines declared capitulation, on-chain data told a different story. Mega Whales added 123,173 BTC. The 5+ year cohort held steady. Retail sold. This wasn't a crisis of confidence - it was a wealth transfer.
The 2025 market delivered no shortage of drama. October brought a 26% drawdown that triggered panic across traditional media. ETF flows turned negative. Social sentiment collapsed. But the blockchain tells a more nuanced story - one of conviction divergence, where sophisticated holders accumulated aggressively while retail capitulated at precisely the wrong moment.
This section examines the on-chain evidence of what we call "The Great Rotation" - the systematic transfer of Bitcoin from weak hands to strong hands that occurred throughout 2025, accelerating during periods of maximum fear. Understanding who bought, who sold, and why, provides critical context for interpreting 2026's market structure.
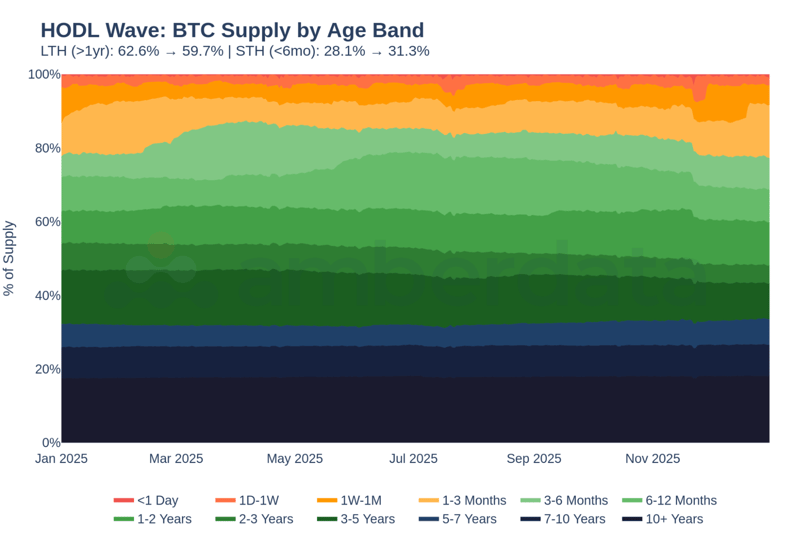
Figure 9.1: HODL Wave: BTC Supply by Age Band - Twelve age cohorts reveal holder conviction. Note the stability of the 5+ year bands (bottom) throughout 2025's volatility, while the 1-6 month bands (top) fluctuate with price action. The transition zone (6-12 months) shows the battleground between diamond hands and paper hands.
The HODL Wave Story: What Changed in 2025
Conviction Profile. HODL waves segment Bitcoin's circulating supply by the time since the coins last moved. Twelve distinct age bands - from coins moved within the past 24 hours to those dormant for over a decade - reveal the conviction profile of the market. When long-term holders distribute to short-term speculators, it signals potential tops. When short-term holders capitulate to long-term accumulators, it signals potential bottoms.
The Data. Long-term holders (LTH) - defined as wallets holding coins for more than one year - declined from 62.6% of supply at year-start to 59.7% by December, a 2.9 percentage point reduction. This wasn't panic selling. It was measured profit-taking from holders who bought during the 2022-2023 accumulation phase, now realizing gains as prices exceeded $100,000.
STH Increase. Simultaneously, short-term holders (STH) - coins held less than six months - increased from 28.1% to 31.3% of supply, a 3.2 percentage point gain. New buyers entered the market throughout the year, absorbing supply from those taking profits. The medium-term cohort (6-12 months) fluctuated most dramatically, serving as the transition zone where STH either graduated to LTH status or capitulated back to exchanges.
This STH increase reflected genuine new demand entering the market rather than mere speculation. On-chain velocity metrics showed these new buyers tended to acquire and hold rather than rapidly flip positions. The accumulation pattern suggested conviction buying - market participants who believed in the long-term thesis and were willing to build positions at prices previously considered cycle tops.
-2.9%
LTH supply change (62.6% to 59.7%). Not capitulation - measured profit-taking from 2022-2023 accumulators who found 100%+ gains too attractive to pass up.
What Didn't Happen. The 5+ year mega-holder cohort held remarkably steady throughout the year's volatility. These are holders who survived the 2017 bubble, the 2018 crash, the 2021 euphoria, and the 2022 collapse. They watched Bitcoin rise from four figures to six figures and back multiple times. October's 26% drawdown didn't move them. The subsequent rally didn't trigger distribution. They simply held.
This behavioral divergence is significant. The LTH decline came primarily from the 1-3 year cohort - holders who accumulated during the 2022-2023 bear market and found 100%+ gains too attractive to pass up. The oldest coins, representing the deepest conviction, remained locked. This suggests the rotation wasn't a cycle top distribution pattern, but rather a healthy rebalancing within the holder base.
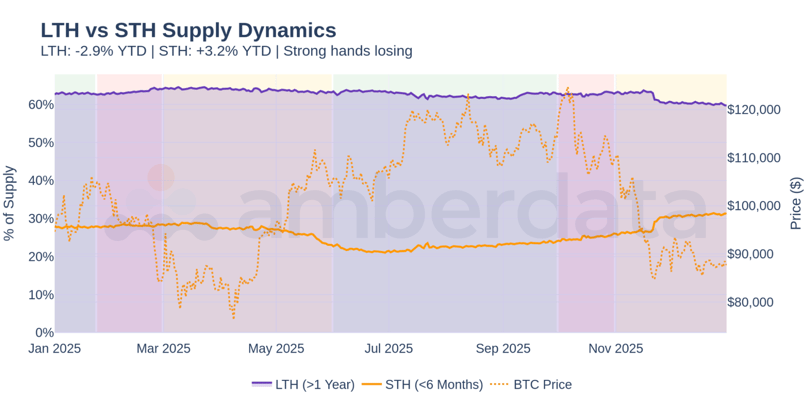
Figure 9.2: LTH vs STH Supply Dynamics - The inverse relationship reveals classic rotation: as LTH declines (profit-taking), STH rises (new buyers absorbing). Note the widening gap in October - STH capitulated while LTH held steady.
The Balance Bucket View: Who Bought, Who Sold
Holder Classification. While HODL waves reveal when coins last moved, balance buckets reveal who holds them. Addresses are categorized by their Bitcoin holdings:
Plankton: <0.1 BTC
Shrimp: 0.1-1 BTC
Crab: 1-10 BTC
Fish: 10-100 BTC
Shark: 100-1K BTC
Whale: 1K-10K BTC
Mega Whale: 10K+ BTC
This classification system allows us to track the flow of wealth across holder cohorts.
The Pattern. The 2025 data reveals an unmistakable trend: supply moved systematically from small holders to large holders throughout the year. Mega Whales - addresses holding more than 10,000 BTC, representing institutional-scale positions - accumulated 123,173 BTC over the course of 2025, a 4.41% increase to their collective holdings. This accumulation accelerated during periods of maximum fear, with the October drawdown triggering the most aggressive buying.
The sheer scale of Mega Whale accumulation demands attention. At an average 2025 price of approximately $100,000, this represents over $12 billion in acquisitions. These aren't speculative trades - they're strategic allocations by entities with the resources and conviction to deploy capital at scale.
Perhaps more revealing than the total accumulation is its timing. Mega Whale buying didn't peak during price rallies when sentiment was positive. It peaked during corrections when sentiment was most negative. This countercyclical behavior demonstrates the informational and psychological advantages of institutional capital.
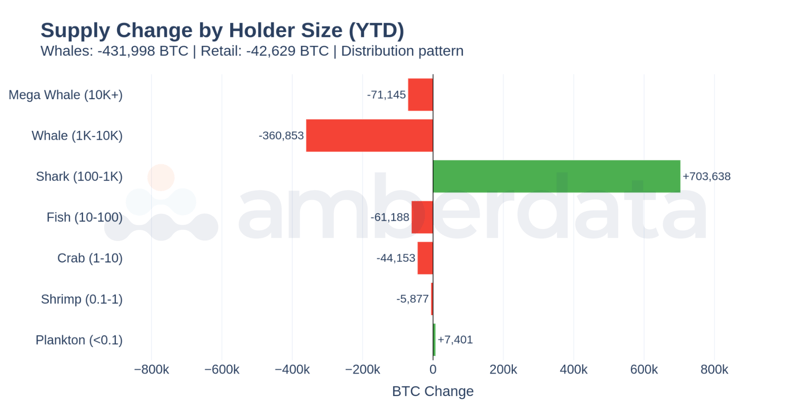
Figure 9.3: Supply Change by Holder Size (YTD) - Green bars (accumulation) dominate the right side (large holders) while red bars (distribution) dominate the left (retail). The wealth transfer is visible in a single chart.
Retail Distribution. On the opposite end of the spectrum, retail cohorts (Plankton, Shrimp, and Crab combined) distributed 15,330 BTC throughout the year. The pattern was consistent: small holders sold during price strength and capitulated during weakness, while whales accumulated in both conditions but particularly during corrections.
Retail distribution wasn't uniform across the year. The data shows two distinct phases: profit-taking during Q1 and Q2 as prices rallied, followed by panic selling during the October correction. In the first phase, small holders were selling into strength - a reasonable strategy for those with shorter time horizons. In the second phase, they were selling into weakness - the classic capitulation pattern that marks local bottoms and transfers supply to stronger hands.
+123,173 BTC
Mega Whale accumulation YTD (+4.41%). At an average 2025 price of ~$100K, this represents over $12 billion in strategic acquisitions during volatility.
Middle Cohorts. The Shark cohort (100-1K BTC) showed mixed behavior, with some addresses graduating to Whale status through accumulation while others distributed. Fish (10-100 BTC) generally accumulated, suggesting this cohort - often representing high-net-worth individuals or small funds - shared the institutional conviction pattern rather than the retail panic pattern.
While ETFs reported outflows, Mega Whales added 123,173 BTC. The Great Rotation wasn't visible in headlines - it was written on the blockchain.
The Great Rotation Thesis: Why This Pattern Matters
Wealth Transfer. The simultaneous data from HODL waves and balance buckets tells a coherent story we call "The Great Rotation." This isn't capitulation - it's wealth transfer. When retail sells and institutions buy, supply concentrates into fewer, stronger hands. When short-term holders panic and long-term holders accumulate, the market's conviction base strengthens even as its price weakens temporarily.
The mechanics of The Great Rotation are straightforward but their implications are profound. Every Bitcoin that moves from a retail wallet to an institutional cold storage address represents a fundamental shift in supply dynamics. Retail holders, on average, sell during volatility. Institutional holders, on average, accumulate during volatility. Over time, this behavioral asymmetry concentrates supply in addresses that won't sell except under extreme circumstances.
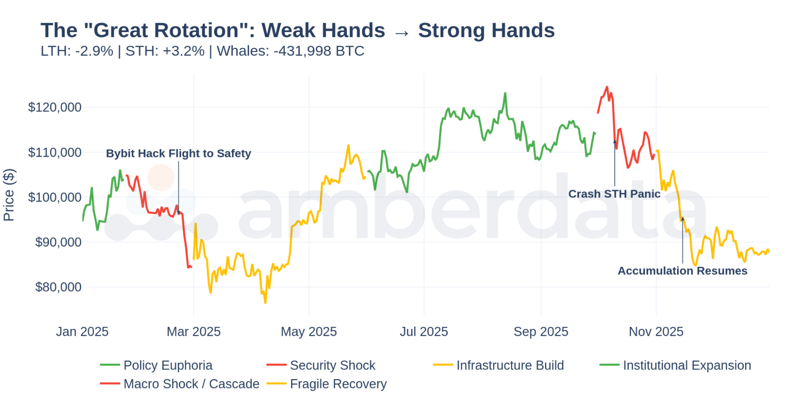
Figure 9.4: The Great Rotation: Weak to Strong - Sankey diagram showing supply flows from retail cohorts (left) to whale cohorts (right). The width of each flow represents BTC volume transferred.
The Mechanism. Supply held by conviction holders is effectively removed from the liquid market. Mega Whales don't sell at the first sign of volatility - they've demonstrated this repeatedly across multiple cycles. Each Bitcoin that moves from a retail wallet to an institutional cold storage address represents one fewer coin available to meet future demand.
Historical Precedent. This pattern has preceded significant rallies. The 2018-2019 bear market saw similar rotation, with whales accumulating at lows while retail capitulated. Following that rotation, Bitcoin rallied from $3,200 to $64,000. The 2022 bottom showed identical signatures - and Bitcoin subsequently rallied from $15,500 to over $100,000. The mechanism is consistent: concentrated supply + returning demand = amplified price moves.
The 2025 rotation occurred at higher price levels than previous cycles, suggesting institutional conviction now extends well above the $100,000 level. Mega Whales weren't just buying the dip - they were buying at prices that would have seemed absurd just two years prior. This behavioral shift indicates a maturing market where sophisticated capital views six-figure Bitcoin as a reasonable entry point rather than a speculative peak.
|
SO WHAT? The Great Rotation is the on-chain story of 2025. Supply moved from weak hands (retail, short-term holders) to strong hands (whales, long-term holders) during volatility. This pattern historically precedes major rallies because it reduces liquid supply while increasing holder conviction. The 123,173 BTC accumulated by Mega Whales won't return to market quickly - they're playing a multi-year game. |
The October Crash: Rotation in Action
Maximum Fear. October 2025 provided the clearest example of The Great Rotation in action. Bitcoin dropped 26% from its August highs, triggering a cascade of negative sentiment. Headlines declared the bull market dead. ETF outflows dominated the news cycle. Social media amplified the panic. On the surface, it appeared the market had lost conviction.
The fear was real and widespread. Crypto Twitter sentiment hit its lowest point of the year. Google searches for "Bitcoin crash" spiked. Mainstream financial media ran stories questioning whether the bull market was over. But sentiment indicators often peak precisely when smart money finds the best opportunities.
What the Blockchain Showed. Balance bucket data showed Mega Whales accelerating their accumulation precisely as fear peaked. While retail rushed for the exits, institutional-scale addresses added to positions at the fastest pace of the year. The 4.41% increase in Mega Whale holdings represents billions of dollars of patient capital absorbing the panic selling.
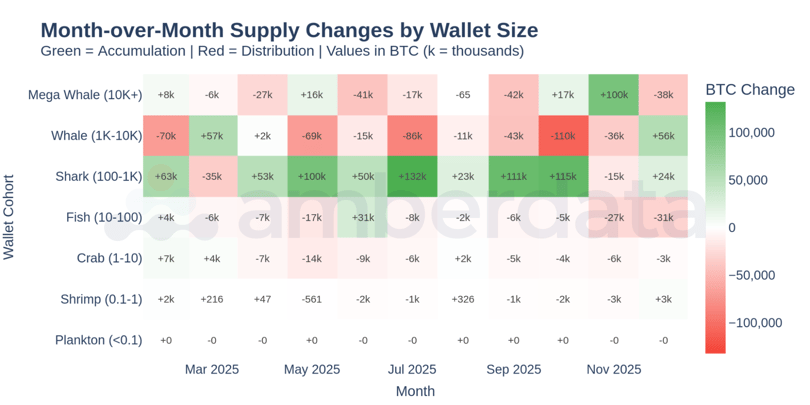
Figure 9.5: Month-over-Month Supply Changes - Heatmap showing cohort behavior by month. October's column reveals the divergence: deep red (distribution) in retail rows, deep green (accumulation) in whale rows. The rotation accelerated during maximum fear.
HODL Wave Confirmation. HODL wave data from October reinforces this narrative. The STH cohort saw accelerated distribution as recent buyers - those who entered during the summer rally - panicked and sold at losses. Meanwhile, the percentage of supply held by 1+ year holders actually increased during the crash, as LTH simply held through the volatility while STH supply contracted.
This conviction divergence is precisely what separates cyclical bottoms from genuine market tops. At tops, long-term holders distribute to euphoric new entrants. At bottoms, long-term holders accumulate from panicking short-term speculators. October showed the latter pattern despite occurring at historically elevated price levels - a powerful signal of institutional conviction.
-15,330 BTC
Retail distribution YTD. Small holders sold into strength (Q1-Q2) and capitulated into weakness (October). This is a classic behavioral pattern that creates future demand when they attempt to re-enter at higher prices.
The 5+ Year Cohort: Diamond Hands in Action
Ultimate Diamond Hands. Perhaps the most remarkable finding from the 2025 HODL wave data is the stability of the 5+ year cohort. These are the ultimate diamond hands - holders who accumulated before Bitcoin reached five figures and held through every subsequent milestone. They watched their holdings appreciate from four-figure prices to six-figure prices without selling. They endured multiple 80%+ drawdowns. They've seen every headline declaring Bitcoin dead.
And in 2025, they held steady. Despite Bitcoin trading above $100,000 - prices that would have seemed impossible when these holders accumulated - the 5+ year cohort showed minimal distribution. This wasn't because they couldn't sell; on-chain liquidity was abundant throughout the year. It was because they chose not to sell. Their conviction has moved beyond price considerations to something more fundamental.
Different Investment Thesis. The contrast with the 1-3 year cohort is instructive. Holders who accumulated during the 2022-2023 bear market showed willingness to take profits at 100%+ gains - a rational response to a successful investment. But the oldest cohort, sitting on 10-50x returns, showed no comparable distribution. This suggests a fundamentally different investment thesis: these aren't traders optimizing for returns, but conviction holders who view Bitcoin as a permanent allocation.
The 5+ year cohort held steady. These holders survived 2017's peak, 2021's euphoria, and 2025's volatility. They're not selling - and their supply is effectively removed from circulation.
This behavioral pattern has significant implications for supply dynamics. Coins held by the 5+ year cohort represent the most stable portion of Bitcoin's supply - effectively permanent holders who reduce the circulating float that responds to price signals. Each passing year that these coins remain dormant strengthens the supply squeeze thesis, as more supply becomes behaviorally illiquid.
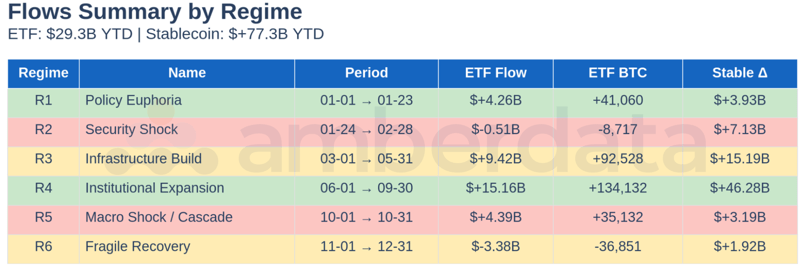
Figure 9.6: Flows Summary by Regime - Reference table showing holder behavior patterns across 2025's six market regimes. LTH accumulated during weakness (R2, R5), retail distributed during both strength and weakness. The 5+ year cohort remained stable across all regimes.
The 2026 Implications: What the Rotation Means
Supply Concentration. More Bitcoin now sits in fewer, stronger hands. Mega Whales and long-term holders control a larger percentage of supply than at any point since early 2024. This concentration reduces the liquid supply available to meet future demand. In a supply squeeze scenario - where new demand meets constrained supply - prices can move aggressively to the upside.
Latent Demand. The 15,330 BTC that left retail wallets represents potential buyers who may return during the next euphoria cycle. When fear turns to greed, these former holders often become aggressive re-accumulators, driving demand at precisely the moment supply is most constrained.
This retail re-entry dynamic has been consistent across previous cycles. Holders who sold during the 2018 crash became buyers during the 2020-2021 rally. Holders who capitulated in 2022 re-entered during 2023-2024. The pattern suggests that retail distribution creates latent demand that resurfaces during subsequent bull phases - often at higher prices than where they sold.
Reduced Sell Pressure. The 123,000 BTC accumulated by Mega Whales won't return to market quickly. These holders have demonstrated through multiple cycles that they measure their investment horizons in years, not months. Their accumulation during 2025's weakness suggests they expect significantly higher prices ahead.
Supply Floor. The stability of the 5+ year cohort establishes a floor of supply that won't respond to normal market volatility. These coins are functionally removed from circulation until something truly extraordinary occurs.
The combined effect of these dynamics is a market structure increasingly favorable to holders. Supply is concentrated in patients' hands. Retail capitulation has created latent future demand. Institutional conviction extends above $100,000. The 2025 rotation has set the stage for what comes next - though the timing and magnitude remain uncertain, the supply dynamics are increasingly constructive for long-term price appreciation.
|
SO WHAT? Historical pattern: Whale accumulation during corrections precedes major rallies. Watch for demand catalysts in 2026 - 401(k) launches, Fed cuts, macro risk-on shifts. The supply dynamics established by 2025's rotation create conditions for potential supply squeeze if institutional demand returns. Reduced liquid supply + concentrated ownership = amplified price response to demand changes. |
|
THE BOTTOM LINE |
|---|
|
The Great Rotation is the on-chain story of 2025. While headlines focused on price and ETF outflows, supply was moving from weak hands to strong hands. Mega Whales accumulated 123,000 BTC (+4.41%). The 5+ year cohort held steady - diamond hands didn't sell despite the year's volatility. Supply moved up the wealth ladder, from retail to institutions. This rotation pattern historically precedes major rallies, as it reduces liquid supply while concentrating ownership among high-conviction holders. The Amberdata Crypto Market Review 2025 connects this rotation to valuation metrics (Section 10) and 2026 scenarios (Section 14). |
This analysis builds on (S8)'s examination of ETF flows and stablecoin supply - the institutional capital flows that complemented the on-chain rotation.
From here, (S10) examines on-chain valuation metrics - MVRV, realized price, and thermocap - to assess whether current prices represent opportunity or risk. (S14) incorporates the rotation data into 2026 scenario modeling. (S3)'s regime framework provides the market context for understanding when accumulation and distribution occurred.
This article provides the on-chain rotation analysis. The full Amberdata Crypto Market Review 2025 goes deeper:
- The $80,000 floor: What happens when ETF cost basis breaks?
- Which ETF issuer is already underwater? The entity-level breakdown reveals all
- October's "capitulation"? The data says arbitrage - here's the carry trade proof
- 123,173 BTC: The mega whale accumulation hiding in plain sight
- Six regimes, 14 sections: One framework that explains everything
- Early or late cycle? On-chain valuation signals decoded
- $60K or $180K? 2026 scenarios with specific price targets
- DeFi's $2B security crisis: What broke and why it matters
- SAB 121 to 401(k): The regulatory timeline reshaping crypto
- And more...

Full-Market Research. Institutional Depth. Derivatives, ETFs, on-chain, DEXs, microstructure, risk signals - and more. Subscribe at the bottom of our page for research that covers every corner of crypto and visit the Amberdata Research Blog.
Access Amberdata Intelligence for institutional-grade digital asset intelligence, or contact our team to discuss custom solutions.
Links & Resources
Platform
Recommended next reads
ETF Cost Basis Series
- Part 1/3: The $80,000 Floor (ETF Cost Basis)
- Part 2/3: Who Breaks First (ETF Cost Basis)
- Part 3/3: The Stress Test (ETF Cost Basis)
More key reads
- The ETF Exodus Decoded: Basis Arbitrage, Not Capitulation
- Bitcoin's Great Rotation: Who Bought the Dip and Why It Matters
- October 2025 Crash (7 charts): How $3.21B Vanished in 60 Seconds
- Beyond the Spread: Market Impact and Execution
Disclaimers
The information contained in this report is provided by Amberdata solely for educational and informational purposes. The contents of this report should not be construed as financial, investment, legal, tax, or any other form of professional advice. Amberdata does not provide personalized recommendations; any opinions or suggestions expressed in this report are for general informational purposes only.
Although Amberdata has made every effort to ensure the accuracy and completeness of the information provided, it cannot be held responsible for any errors, omissions, inaccuracies, or outdated information. Market conditions, regulations, and laws are subject to change, and readers should perform their own research and consult with a qualified professional before making any financial decisions or taking any actions based on the information provided in this report.
Past performance is not indicative of future results, and any investments discussed or mentioned in this report may not be suitable for all individuals or circumstances. Investing involves risks, and the value of investments can go up or down. Amberdata disclaims any liability for any loss or damage that may arise from the use of, or reliance on, the information contained in this report.
By accessing and using the information provided in this report, you agree to indemnify and hold harmless Amberdata, its affiliates, and their respective officers, directors, employees, and agents from and against any and all claims, losses, liabilities, damages, or expenses (including reasonable attorney's fees) arising from your use of or reliance on the information contained herein.
Copyright © 2026 Amberdata. All rights reserved.