Share this blog:
This is Section 7, excerpted from our Amberdata Crypto Market Review 2025 and 2026 Outlook: Six Regimes, One Story. Our full report spans 14 sections - ETF flows, derivatives, on-chain, liquidity, and our complete 2026 outlook.
Open interest, funding rates, and the mechanics of crypto's largest-ever liquidation cascade
|
KEY TAKEAWAYS |
|---|
|
October 10, 2025: $2.3 billion liquidated in a single day. 86% from forced selling of longs. The largest single-day liquidation event in Bitcoin's history unfolded not through panic selling, but through mechanical forced closures as margin calls cascaded through an overleveraged system.
The warning signs were visible for weeks. Funding rates had sustained above 15% APR. Open interest had climbed to record highs. The market was positioned for continuation, and when continuation failed, the leverage unwound violently. Understanding how leverage creates systemic fragility is essential for anyone managing risk in crypto markets.
The Open Interest Story: Building the Powder Keg
Real-Time Leverage Measure. Open interest - the total value of outstanding derivative contracts - serves as a real-time measure of leverage in the system. In 2025, BTC open interest told a story of building fragility that culminated in October's cascade.
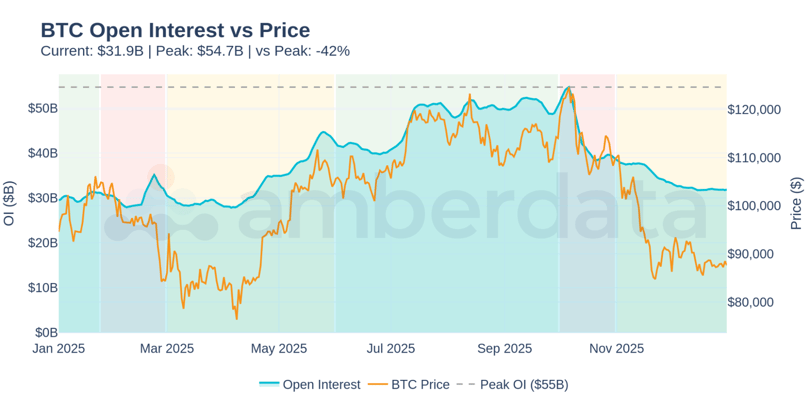
Figure 7.1: BTC Open Interest vs Price - Note the divergence between OI peak ($54.7B) and price peak. Leverage accumulated faster than price appreciation - a classic fragility indicator.
The Build Phase (R1-R4). Open interest climbed steadily from $30B at year start to $54.7B peak during R4 (Institutional Expansion). This 82% increase represented the largest aggregate leverage position in Bitcoin history.
Average OI by Regime. How open interest evolved across 2025:
R1 Policy Euphoria: $30.2B
R2 Security Shock: $30.5B
R3 Infrastructure Build: $33.2B
R4 Institutional Expansion: $47.4B
The steady build reflected growing institutional participation and retail speculation converging into a single directional bet.
One-Sided Positioning. What made this build particularly dangerous was its one-sided nature. Long positions dominated, creating asymmetric liquidation risk. When everyone is positioned the same way, there is no natural buyer for forced selling - only more forced selling.
$54.7B
Peak open interest reached during R4 (August-September). The largest aggregate leverage position in Bitcoin history - and the fuel for October's cascade.
The Collapse. October's correction triggered forced liquidations that reduced OI by 42% from peak. Current open interest sits at $31.9B - below where the year started. This represents genuine deleveraging, not temporary position reductions.
The OI collapse pattern reveals cascade mechanics. Initial price decline triggers margin calls. Forced closures add selling pressure. Lower prices trigger more margin calls. The feedback loop continues until leverage is purged from the system. October proved this mechanism operates at unprecedented scale in modern crypto markets.
|
SO WHAT? Open interest levels relative to historical averages serve as a fragility indicator. When OI significantly exceeds prior peaks, the system is primed for cascade risk. Current OI at $31.9B (42% below peak) represents meaningfully reduced systemic risk - but also reduced speculative appetite for the next move. |
Funding Rates: The Sentiment Indicator That Warned
Cost of Leverage. Perpetual futures funding rates reflect the cost of holding leveraged positions. Positive funding means longs pay shorts - indicating bullish positioning dominance. The magnitude of funding reveals how crowded that positioning has become.
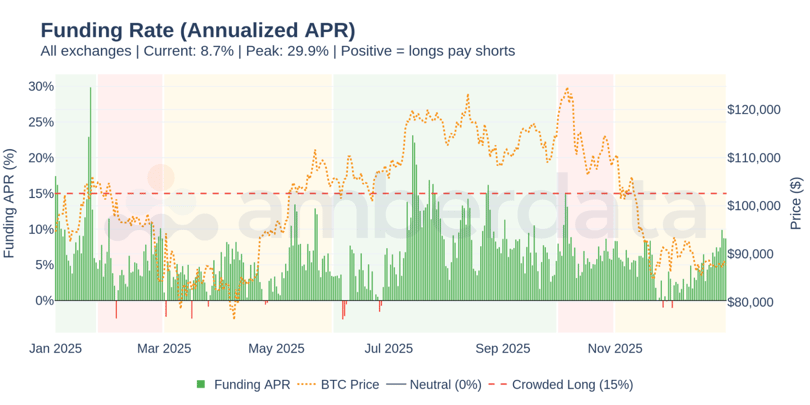
Figure 7.2: Funding Rate (Annualized APR) - Funding exceeded 15% (crowded long territory) repeatedly during R4. The persistence of elevated funding preceded the October correction by weeks.
The Warning Threshold. Funding rates above 15% APR historically signal crowded long positioning. During R4, funding peaked at 29.9% APR - nearly double the warning threshold. This wasn't a brief spike but sustained elevation across multiple weeks.
Interpretation Framework. How to read funding rates:
Above 15%: Crowded longs - warning signal
5-15%: Bullish sentiment
0-5%: Neutral
Negative: Shorts paying - bearish positioning
Funding rates above 15% APR for extended periods have preceded every major correction in 2025. The signal was visible - the question was timing.
Regime Patterns. Average funding by regime reveals sentiment evolution:
R1 Policy Euphoria: 10.6% (post-ETF euphoria)
R2 Security Shock: 5.4% (Bybit shock reset)
R3 Infrastructure Build: 4.4% (quiet building)
R4 Institutional Expansion: 7.3% (accumulation - peak readings exceeded 29%)
R5 Macro Shock: 6.8% (crash period)
R6 Fragile Recovery: 4.5% (recovery caution)
Current Conditions. Current funding at 8.7% APR sits in neutral-to-bullish territory - elevated but not crowded. The deleveraging process reset positioning to sustainable levels. Traders are rebuilding exposure cautiously rather than aggressively.
The Liquidation Cascade: Anatomy of a Deleveraging Event
Total Liquidations. Total liquidations in 2025 reached $31.4B - with $19.0B (60%) coming from forced long closures. This asymmetry reveals the one-sided nature of positioning that preceded major corrections.
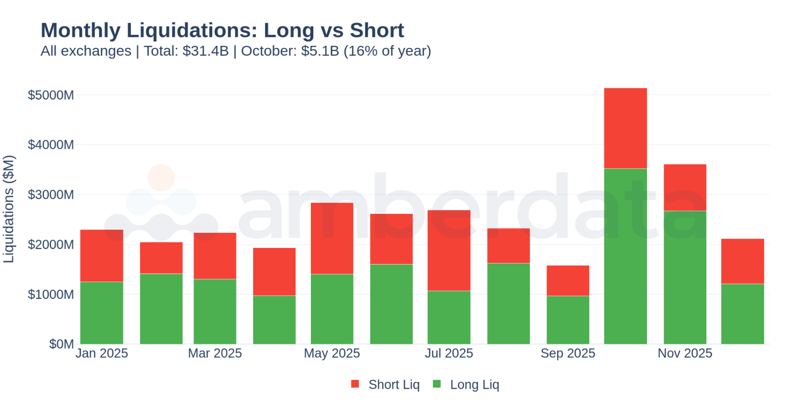
Figure 7.3: Monthly Liquidations: Long vs Short - October stands out with $5.1B in liquidations (16% of annual total). Note the consistent long-side dominance across most months.
86%
Percentage of October 10 liquidations from forced long closures. The market was catastrophically one-sided before the cascade began.
October 10: The Cascade Day. The single largest liquidation day in 2025 saw $2.3B in forced closures, with 86% from long positions. This concentration reveals how crowded long positioning had become. When the liquidation cascade began, there was only one direction for forced selling to flow.
Cascade Mechanics. The mechanics are straightforward but relentless: initial price drop triggers margin calls, forced closures add selling pressure, additional price decline triggers more margin calls, and the cycle continues until leverage is exhausted.
The speed of cascade propagation matters as much as magnitude. Modern exchange liquidation engines can process billions in forced closures within hours. This compressed timeline means traditional risk management approaches - waiting for support levels, scaling into positions - fail when cascades accelerate beyond human reaction time.
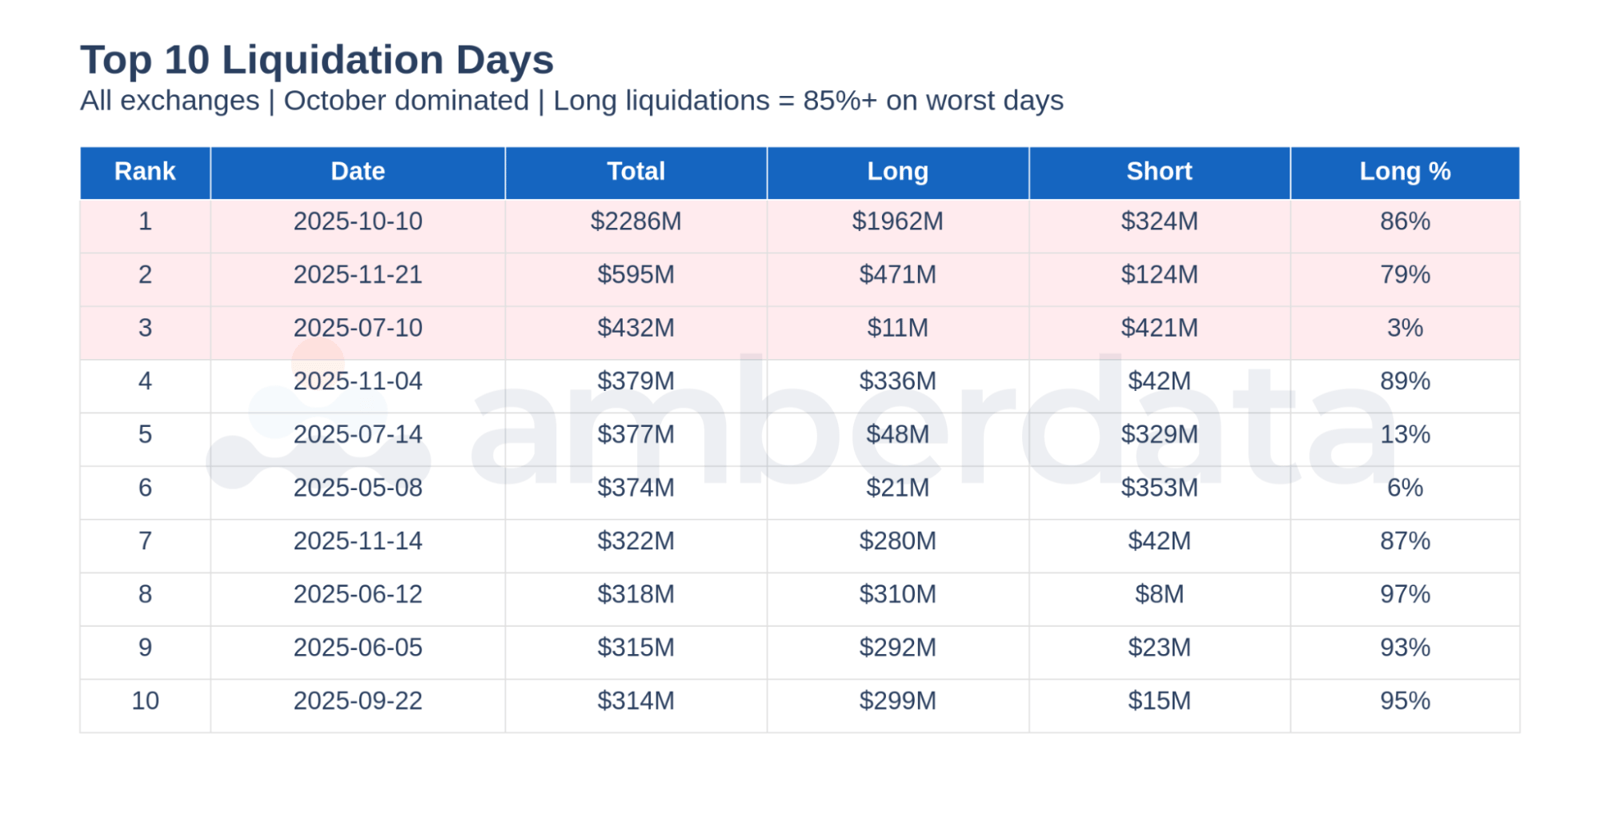
Figure 7.4: Top 10 Liquidation Days - October 10 dominates at $2.3B - nearly 4x the second-largest day. The concentration of liquidation risk into a single event demonstrates cascade mechanics.
Liquidation Intensity. Liquidation intensity (daily liquidations / open interest) peaked at 4.82% during October - approaching the 5% threshold that indicates extreme cascade risk.
Intensity Thresholds. How to interpret liquidation intensity:
0.5-2%: Normal intensity
2-5%: Elevated - signals stress
Above 5%: Systemic cascade - forced selling overwhelms organic buying
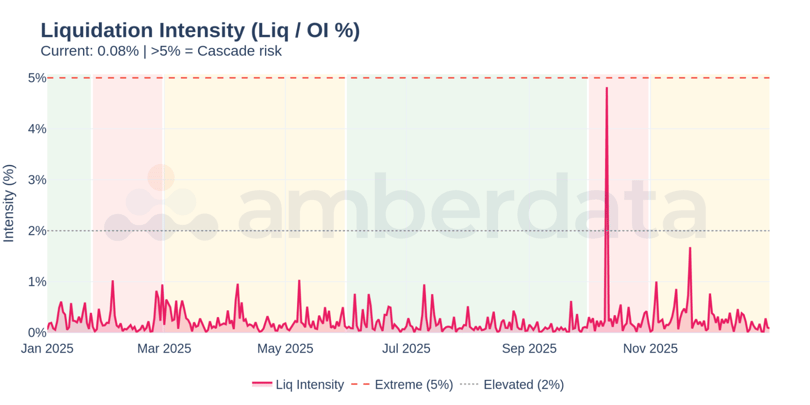
Figure 7.5: Liquidation Intensity (Liq / OI %) - The October spike to 4.82% intensity represents extreme stress - just below the 5% cascade threshold. Current readings at 0.08% indicate normalized conditions.
|
SO WHAT? Liquidation intensity above 2% signals elevated stress; above 5% indicates potential cascade. Monitoring this ratio provides early warning of systemic risk. Current intensity at 0.08% reflects the post-deleveraging quiet - but also means the market lacks the fuel for sharp moves in either direction. |
Exchange Concentration: Where Leverage Lives
Systemic Risk Sources. Understanding where open interest concentrates helps identify systemic risk sources. In 2025, leverage remained concentrated across a handful of major venues.
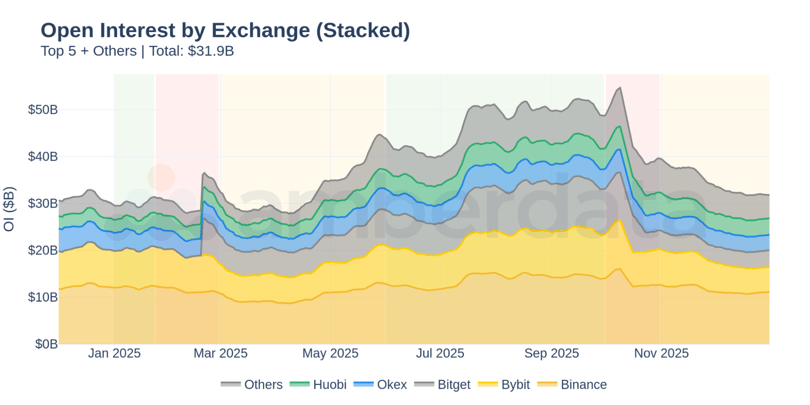
Figure 7.6: Open Interest by Exchange - Binance dominates with $11.1B (35% share). Top 5 exchanges account for 85%+ of total BTC futures OI.
Binance Dominance. Binance maintains the largest share of BTC open interest at $11.1B - approximately 35% of total. This concentration means Binance liquidation engine behavior significantly impacts market-wide cascade dynamics. When Binance begins processing large-scale liquidations, the selling pressure propagates to other venues through arbitrage and crosses order books.
Exchange Distribution. BTC futures open interest by exchange:
Binance: $11.1B (35%)
Bybit: $5.5B
Bitget: $3.5B
OKX: $3.5B
Huobi: $3.5B
Others: $4.8B
Together, the top five exchanges account for 85%+ of BTC futures open interest. The concentration among top venues creates both risks and opportunities - risks from correlated liquidation cascades, opportunities from cross-exchange arbitrage during stress events.
Cascade Propagation. Exchange concentration creates correlated liquidation risk. When cascades begin on major venues, they propagate across smaller exchanges through price arbitrage. The interconnected nature of crypto derivatives means no venue operates in isolation - price dislocations on one exchange create arbitrage opportunities that transmit selling pressure across the entire market.
For risk managers, this concentration suggests monitoring the top five exchanges provides sufficient coverage for systemic risk. Unusual activity patterns on these venues - sudden OI spikes, funding rate divergences, or liquidation clusters - often precede broader market moves.
Leverage by Regime: The Full Picture
Positioning Evolution. Mapping leverage metrics to the year's six regimes reveals how positioning evolved through different market conditions.
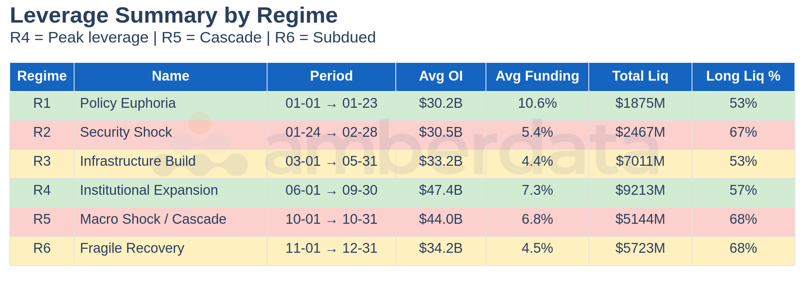
Figure 7.7: Leverage Summary by Regime - R4 shows peak OI ($47.4B avg) with elevated funding (7.3%), setting up October's liquidation concentration. R6 shows meaningful deleveraging.
R1 - Policy Euphoria. OI $30.2B average, funding 10.6% APR, liquidations $1.9B. Post-ETF launch excitement drove elevated funding, but OI remained moderate. Liquidations stayed contained.
R2 - Security Shock. OI $30.5B average, funding 5.4% APR, liquidations $2.5B. The Bybit hack triggered brief deleveraging. Funding reset to neutral as optimism cooled.
R3 - Infrastructure Build. OI $33.2B average, funding 4.4% APR, liquidations $7.0B. Gradual leverage rebuild began. Funding stayed neutral as traders rebuilt positions cautiously.
R4 - Institutional Expansion. OI $47.4B average, funding 7.3% APR, liquidations $9.2B. The build-up phase. OI reached record highs as institutions accumulated. Funding elevated but not extreme on average - though peak readings exceeded 29%.
R5 - Macro Shock. OI $44.0B average, funding 6.8% APR, liquidations $5.1B. The cascade period. Despite fewer days, October's concentrated liquidations represented extreme intensity.
R6 - Fragile Recovery. OI $34.2B average, funding 4.5% APR, liquidations $5.7B. Deleveraging continued through year-end. Positioning remains cautious with funding in neutral territory.
R4's record open interest ($47.4B average) combined with crowded long positioning created the conditions for October's cascade. The leverage existed - the catalyst was simply a matter of timing.
2026 Implications: Monitoring Leverage Risk
Baseline Metrics. The 2025 leverage cycle provides baseline metrics for monitoring systemic risk going forward. Several key thresholds emerged from this year's experience.
OI Thresholds. Current OI at $31.9B represents 58% of peak. Recovery above $45B would signal renewed leverage build-up. Sustained readings above $50B should trigger heightened risk awareness.
Funding Warnings. Persistent funding above 15% APR preceded October's correction. Brief spikes are normal; sustained elevation (14+ days above threshold) historically precedes corrections.
Intensity Monitoring. Liquidation intensity above 2% signals stress. Above 5% indicates cascade risk. Current readings at 0.08% reflect post-deleveraging calm. Establishing baseline intensity levels during quiet periods helps calibrate alerts for when readings elevate.
Exchange Concentration Risk. With 85%+ of OI concentrated on five exchanges, monitoring the largest venues provides sufficient coverage for systemic risk assessment. Unusual activity patterns on Binance, in particular, deserve immediate attention given its 35% market share.
The deleveraging of 2025 created healthier market structure. Lower aggregate leverage means reduced cascade risk - but also reduced fuel for sharp rallies. The market must rebuild speculative positioning before the next major move, which takes time and requires sustained directional conviction. This rebuilding process is already underway, but OI remains well below the levels that preceded October's cascade.
|
THE BOTTOM LINE |
|---|
|
Leverage is the amplifier. Without October's $54.7B in peak open interest, the cascade couldn't have reached $31.4B in annual liquidations. The 2025 experience demonstrated that crowded positioning (86% long liquidations on cascade day), persistent funding warnings (29.9% peak APR), and concentrated exchange exposure (Binance 35% share) combine to create systemic fragility. Current OI at $31.9B (-42% from peak) represents genuine deleveraging. The market is structurally healthier - but that health came at the cost of $31B in forced liquidations. |
This analysis builds on (S5)'s examination of carry trade mechanics (how basis compression forced arbitrage unwinds that added to liquidation pressure) and (S6)'s liquidity analysis (the order book conditions that allowed cascades to propagate so rapidly).
From here, (S8) examines the flow consequences: where capital moved during and after the deleveraging event, including ETF outflows that proved to be arbitrage unwinds rather than fundamental selling. (S14) incorporates these leverage metrics into 2026 risk scenarios.
This article provides the leverage analysis. The full Amberdata Crypto Market Review 2025 goes deeper:
- The $80,000 floor: What happens when ETF cost basis breaks?
- Which ETF issuer is already underwater? The entity-level breakdown reveals all
- October's "capitulation"? The data says arbitrage - here's the carry trade proof
- 123,173 BTC: The mega whale accumulation hiding in plain sight
- Six regimes, 14 sections: One framework that explains everything
- Early or late cycle? On-chain valuation signals decoded
- $60K or $180K? 2026 scenarios with specific price targets
- DeFi's $2B security crisis: What broke and why it matters
- SAB 121 to 401(k): The regulatory timeline reshaping crypto
- And more...

Full-Market Research. Institutional Depth. Derivatives, ETFs, on-chain, DEXs, microstructure, risk signals - and more. Subscribe at the bottom of our page for research that covers every corner of crypto and visit the Amberdata Research Blog.
Access Amberdata Intelligence for institutional-grade digital asset intelligence, or contact our team to discuss custom solutions.
Links & Resources
Platform
Recommended next reads
ETF Cost Basis Series
- Part 1/3: The $80,000 Floor (ETF Cost Basis)
- Part 2/3: Who Breaks First (ETF Cost Basis)
- Part 3/3: The Stress Test (ETF Cost Basis)
More key reads
- The ETF Exodus Decoded: Basis Arbitrage, Not Capitulation
- Bitcoin's Great Rotation: Who Bought the Dip and Why It Matters
- October 2025 Crash (7 charts): How $3.21B Vanished in 60 Seconds
- Beyond the Spread: Market Impact and Execution
Disclaimers
The information contained in this report is provided by Amberdata solely for educational and informational purposes. The contents of this report should not be construed as financial, investment, legal, tax, or any other form of professional advice. Amberdata does not provide personalized recommendations; any opinions or suggestions expressed in this report are for general informational purposes only.
Although Amberdata has made every effort to ensure the accuracy and completeness of the information provided, it cannot be held responsible for any errors, omissions, inaccuracies, or outdated information. Market conditions, regulations, and laws are subject to change, and readers should perform their own research and consult with a qualified professional before making any financial decisions or taking any actions based on the information provided in this report.
Past performance is not indicative of future results, and any investments discussed or mentioned in this report may not be suitable for all individuals or circumstances. Investing involves risks, and the value of investments can go up or down. Amberdata disclaims any liability for any loss or damage that may arise from the use of, or reliance on, the information contained in this report.
By accessing and using the information provided in this report, you agree to indemnify and hold harmless Amberdata, its affiliates, and their respective officers, directors, employees, and agents from and against any and all claims, losses, liabilities, damages, or expenses (including reasonable attorney's fees) arising from your use of or reliance on the information contained herein.
Copyright © 2026 Amberdata. All rights reserved.