Share this blog:
Crypto order books reveal the micro-structure of markets and the intentions of market participants. Exchanges are venues that bring together buyers and sellers to facilitate trade, which leads to price discovery for digital assets.
Global notional value reveals intent
How can you predict where an asset trend is going? How do you know which exchange is the best to trade on? By analyzing the asset through the lens of exchange-based context. This type of analysis relies on several key pieces of digital asset data to look at the prices and volumes traders are willing to establish as the assets value.
Trades occur when a buyer (bids) and seller (asks) are matched, establishing the precise executed and negotiated asset value. Orders, on the other hand, establish a threshold of value, where the negotiation has not yet occurred. When looking at trades, one can start to see trends emerging over time, but how can you understand how the market is moving?
Looking at both trade volume and order book notional depth, is the same thing as saying “what happened, and what is likely to happen next?” Understanding trade volume allows us to know exactly where the market is moving—i.e., the value traders are bidding and asking.
Order books are simply the signal of value with the volume or size representing the weight of the potential trade. In an active crypto market, many participants act upon different models, analysis, and beliefs, expressing intent with orders to buy and sell at specified prices. In aggregate, the total interest in an order book is referred to as the depth of the market. This is represented visually by a market depth chart, order book summary & trades list.
You can see below what this looks like:
.gif?width=1000&height=423&name=Amberdata%20Blog%20(1).gif)
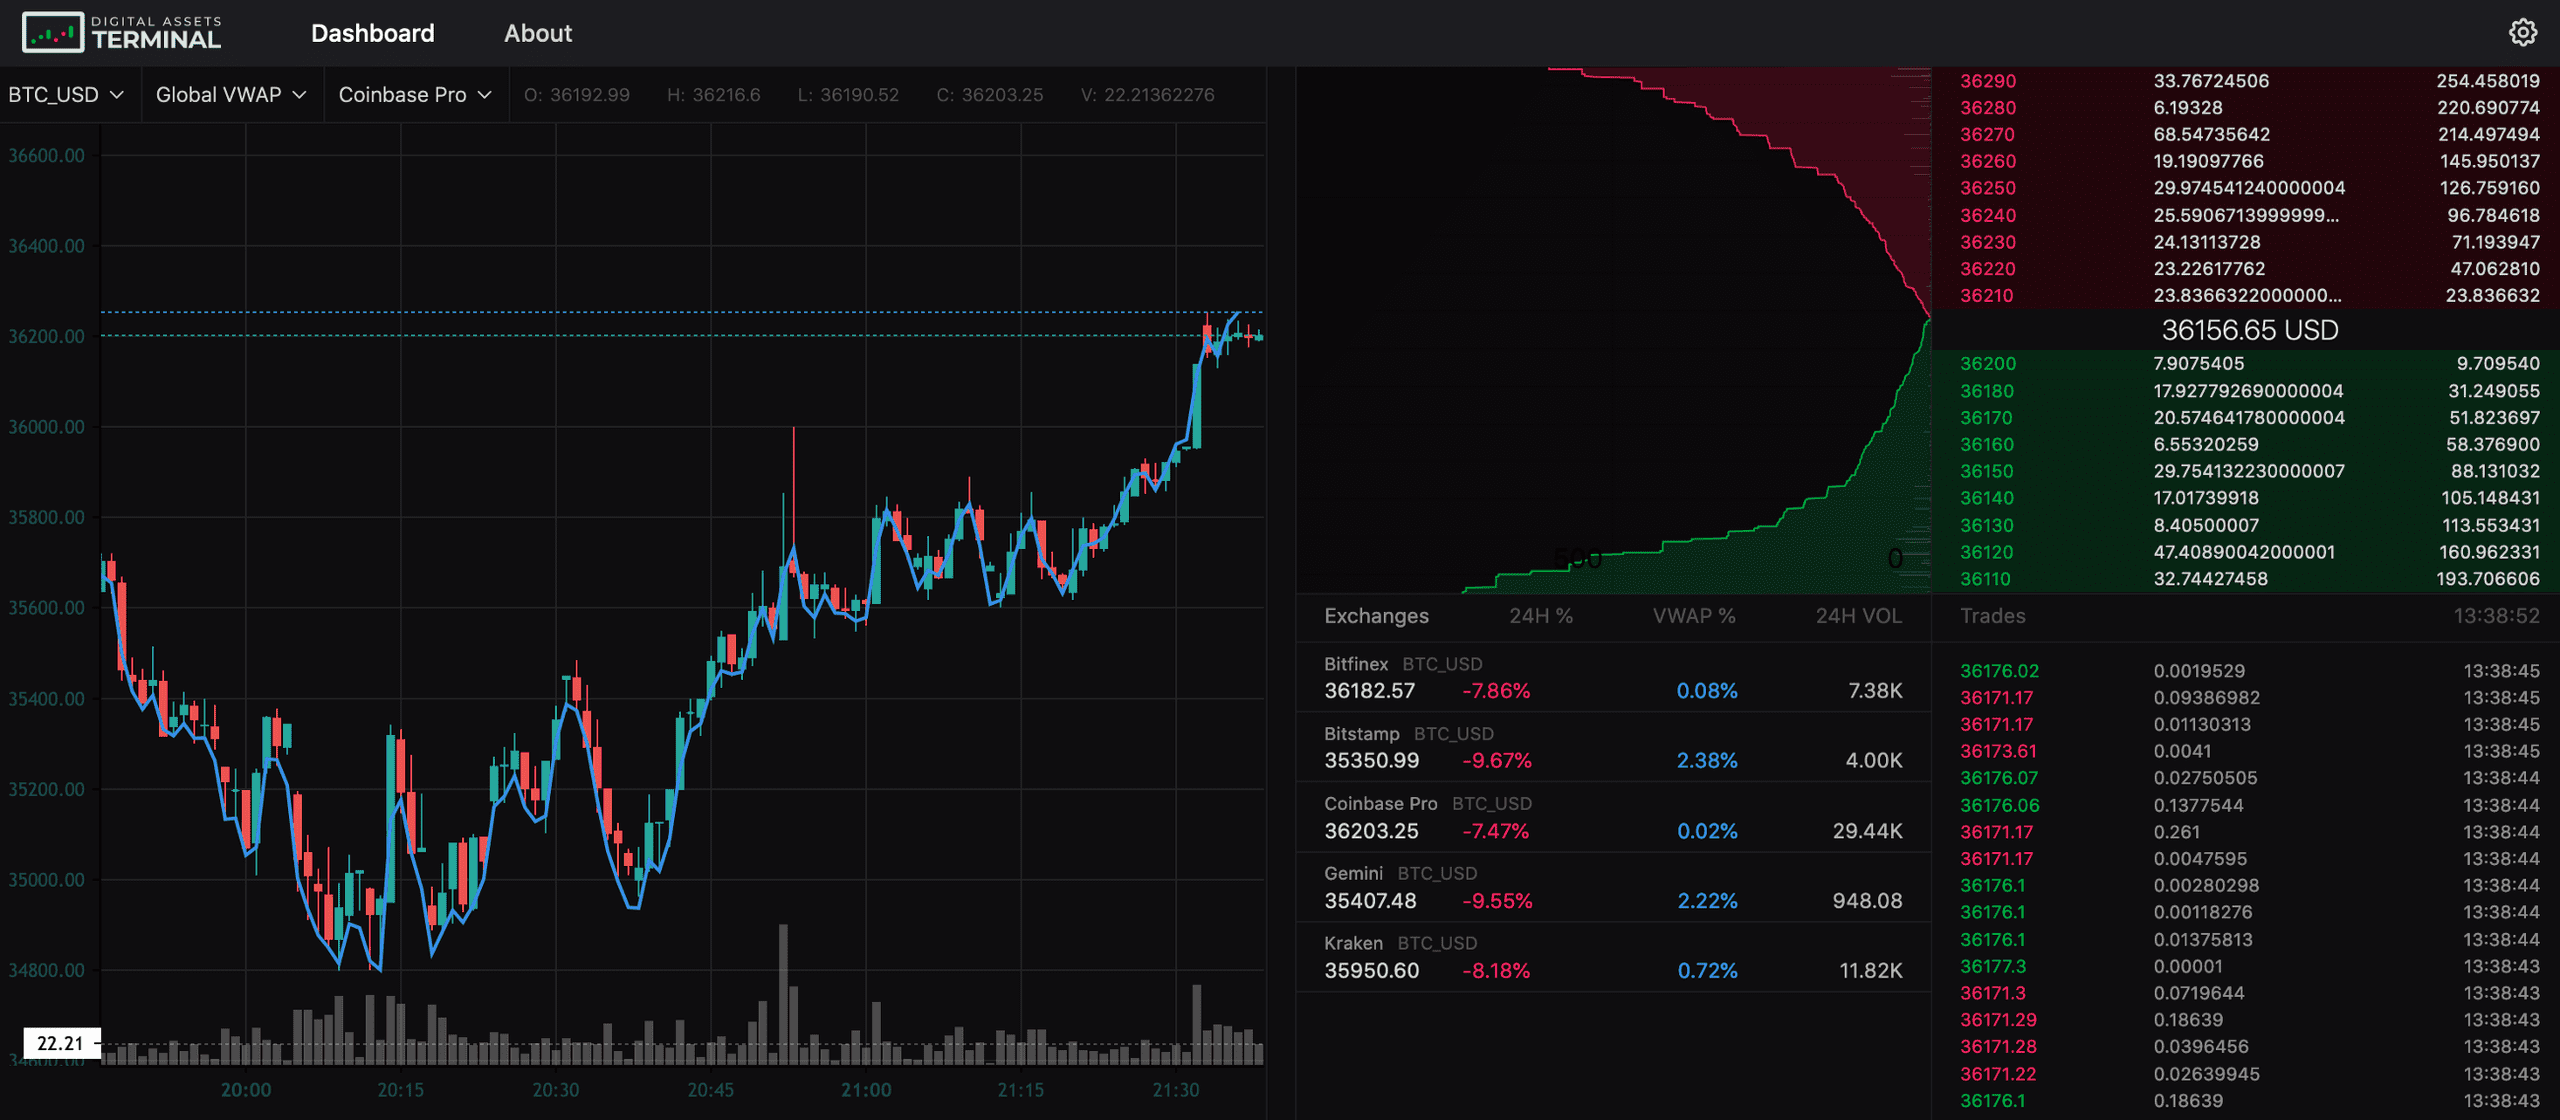
Orders & Market Depth for BTC_USD on Coinbase Pro — Amberdata.io
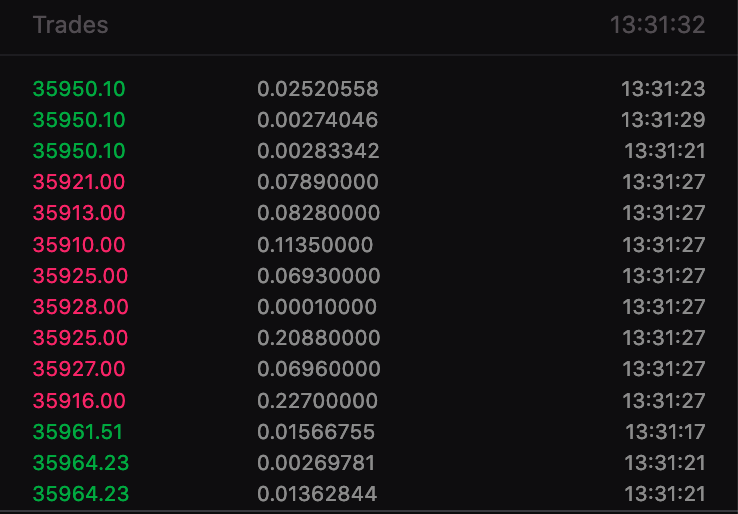
Trades for BTC_USD on Coinbase Pro—Amberdata API
Market depth portrays the scaled high level view of price levels and their volume allocation in a easy to understand chart. The other two list views give a much more precise view of data as its occurring.
Cross-exchange view using global order books and trades
Cryptocurrencies are still young, and can produce a very volatile asset. They trade at many venues in different regions where local price discoveries can happen, which can drift and deviate. This can create opportunities for traders and arbitrageurs to bring those prices back in line with other markets. Similar to the FX market, cryptocurrencies trade on spot, swaps and derivatives markets across many venues around the world, around the clock.
Moving to a 1,000-foot view across exchanges, we can finally see what is actively traded and how the market finds equilibrium. The following is a dashboard combining global order books, global market depth, combined trades list, VWAP and an OHLCV comparison:
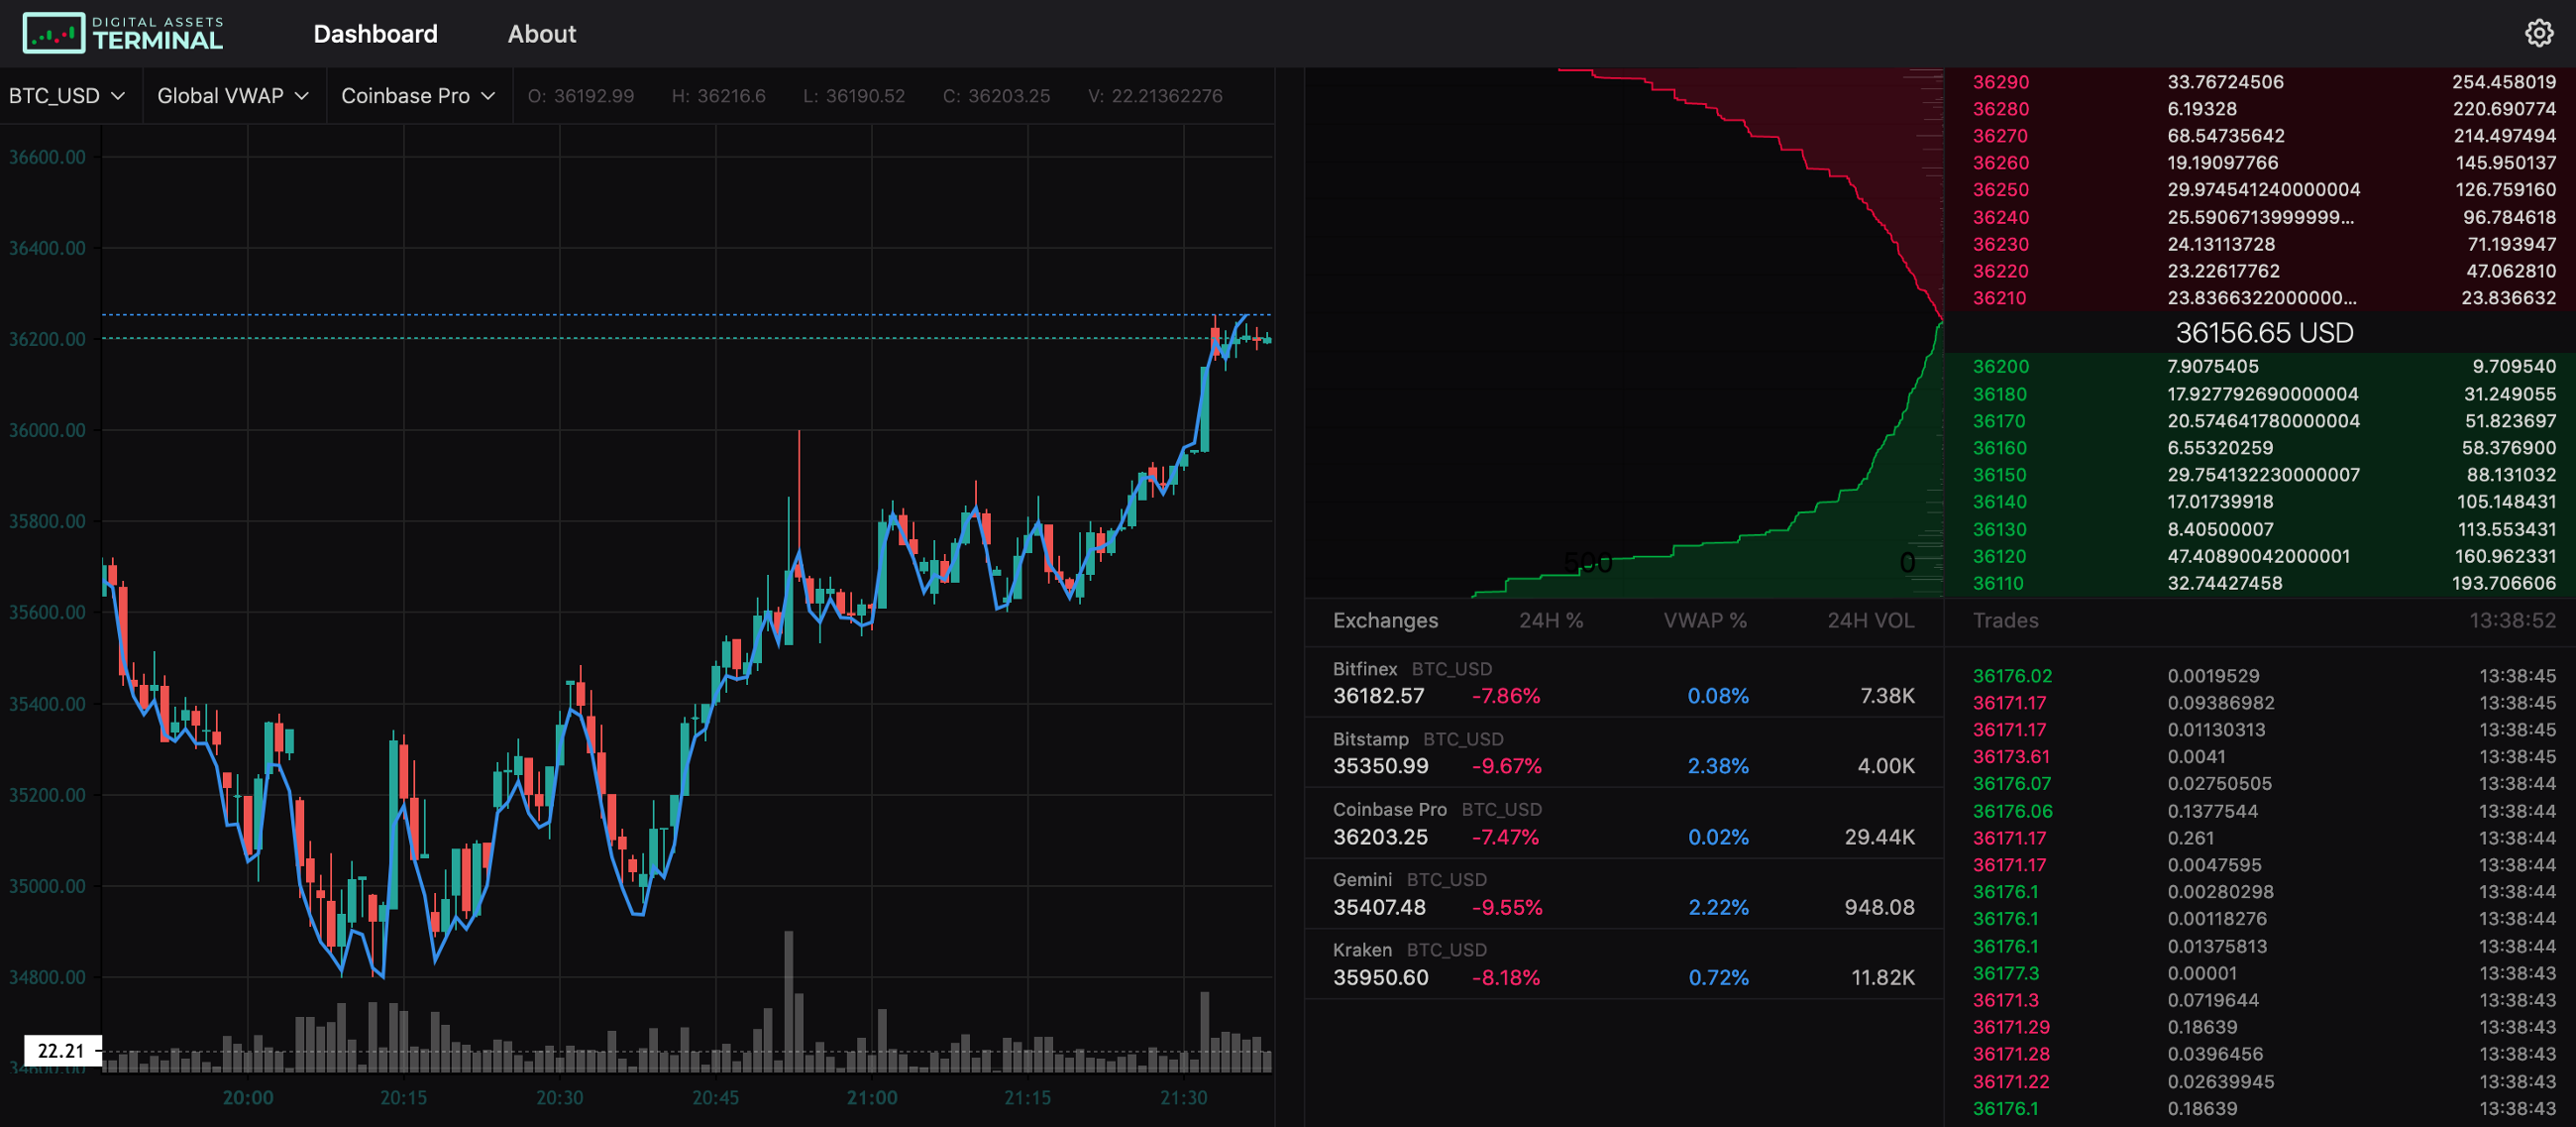 Global Order Books, Trades, OHLCV & VWAP of BTC_USD —Amberdata API
With a global view, you get a full picture of total volumes across the price spectrum. This allows you to see if an asset is liquid or illiquid, how much volatility the asset could experience in price and how much commitment there is to maintain a certain price level. It’s also able to help trade actions when seeing the landscape of liquidity across exchanges, because this shows how volumes could affect prices. Take the following image as an example:
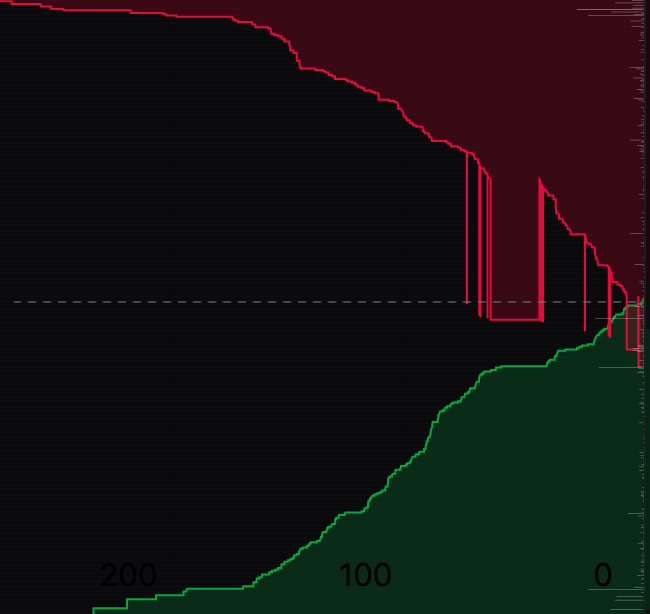
This shows a combined order book of all exchanges, where the non-conformant line represents differing volumes exceeding the mid of the order book. We can then extrapolate which exchange has accumulated more volume above and below the mid, which will aid the best value for making trades per exchange. Note: This is merely representing the potential price impact from order volumes, however, we can also look at the finalized trade price as well.
Let’s briefly look at a comparison of exchange OHLCV and VWAP.
Here, VWAP is represented in blue, and OHLCV is represented as the red and green candles:
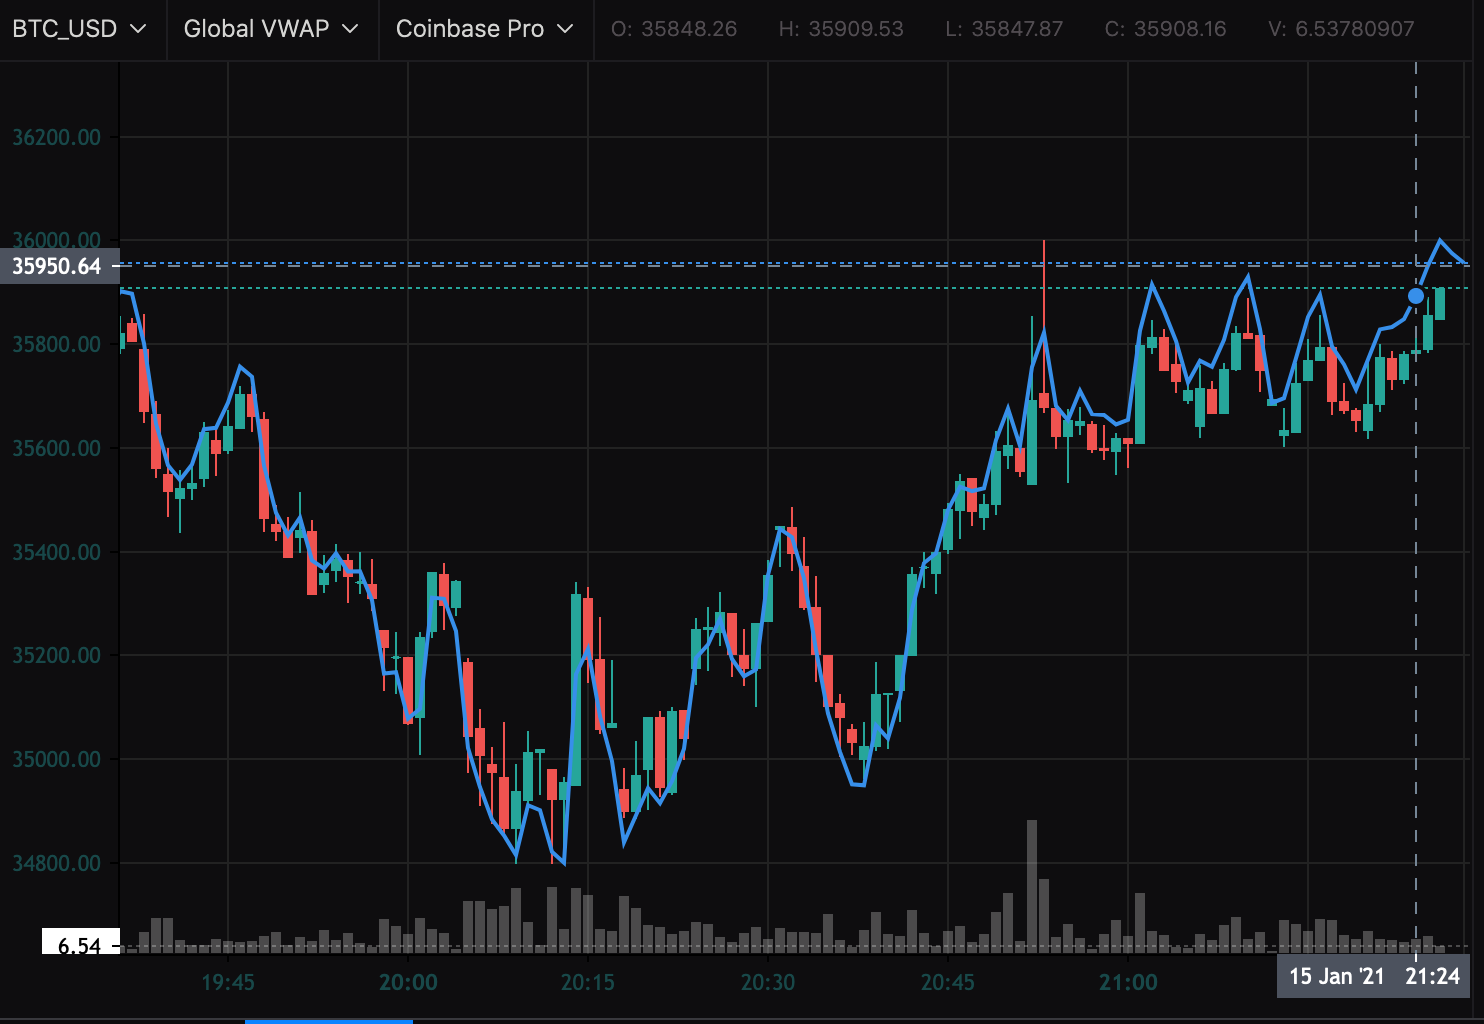 BTC_USD VWAP & OHLCV Coinbase Pro—Amberdata API
Understand the global price action in a single number
Order books give us the potential outcome and the forecasting, where OHLCV and VWAP give us the finalized and fully executed outcome. VWAP is often used as a momentum indicator, if the price of the last bar (over some time frame) crosses over/under VWAP, then the current market price has exceeded the average price and maybe a bullish or bearish indication. VWAP price is a “volume weighted average price” that tells us if a trade price was better or worse than across the entire market. Using the image above, you can see there are points in the chart where the VWAP line is above or below the OHLC candle, indicating good trades when the candle is below the VWAP line.
Want to take your crypto trading business next level?
Amberdata provides real time, snapshot & multiple aggregations for crypto market data. All of the above examples use data that is available in the Amberdata API via REST, Websockets, and RPC (DEX Data sets). Request a demo today to learn more.