Share this blog:
Binance, one of the leading cryptocurrency exchanges, is celebrating its second year anniversary of their deployed ERC20 Ethereum contract. Operating a top tier application is not easy, today we’re looking at the past two years and the metrics that tell us about BNB token.
TLDR; We’re looking at the metrics of Binance utilizing Amberdata.io API to obtain specific a blockchain data and aggregations needed to understand the bigger picture. The following methods are outlined for you to replicate and assess your Ethereum application.
Analysis Summary
When operating any application on Ethereum, it is critical to understand certain metrics that help you understand your business. Questions like: What is the usage of my contract? What percentage of my token holders are whales? Is the transaction activity trading or are people mostly hodling? We’ve got data sets to answer these questions, time to dig into Binance by looking at the results side-by-side code examples.
Where did it all begin?
Let’s first look at the original transaction that deployed the contract here. The BNB contract was deployed on 2017–07–05, from another contract. It is a standard ERC20, utilizing SafeMath, and burn/freeze/unfreeze functions. Keep this in mind for question #2 when we talk about supply and holdings over time.
1. How many token holders does Binance have?
316,124
Total Holders
At time of writing (2019–07–05), current statistics are:
Supply Market Cap Price USD16,579,517.055 4,530,079,663.12 $32.65Getting this data is a simple query:
// BNB Ethereum Addressconst address = ‘0xb8c77482e45f1f44de1745f52c74426c631bdd52’const url = `https://web3api.io/api/v1/addresses/${address}/information`axios.get(url, { headers: { ‘x-api-key’: AMBERDATA_API_KEY } }).then(res => { const d = res.data.payload console.log(‘Holders:’, d.numHolders)})2. How has the supply and holders changed over time?
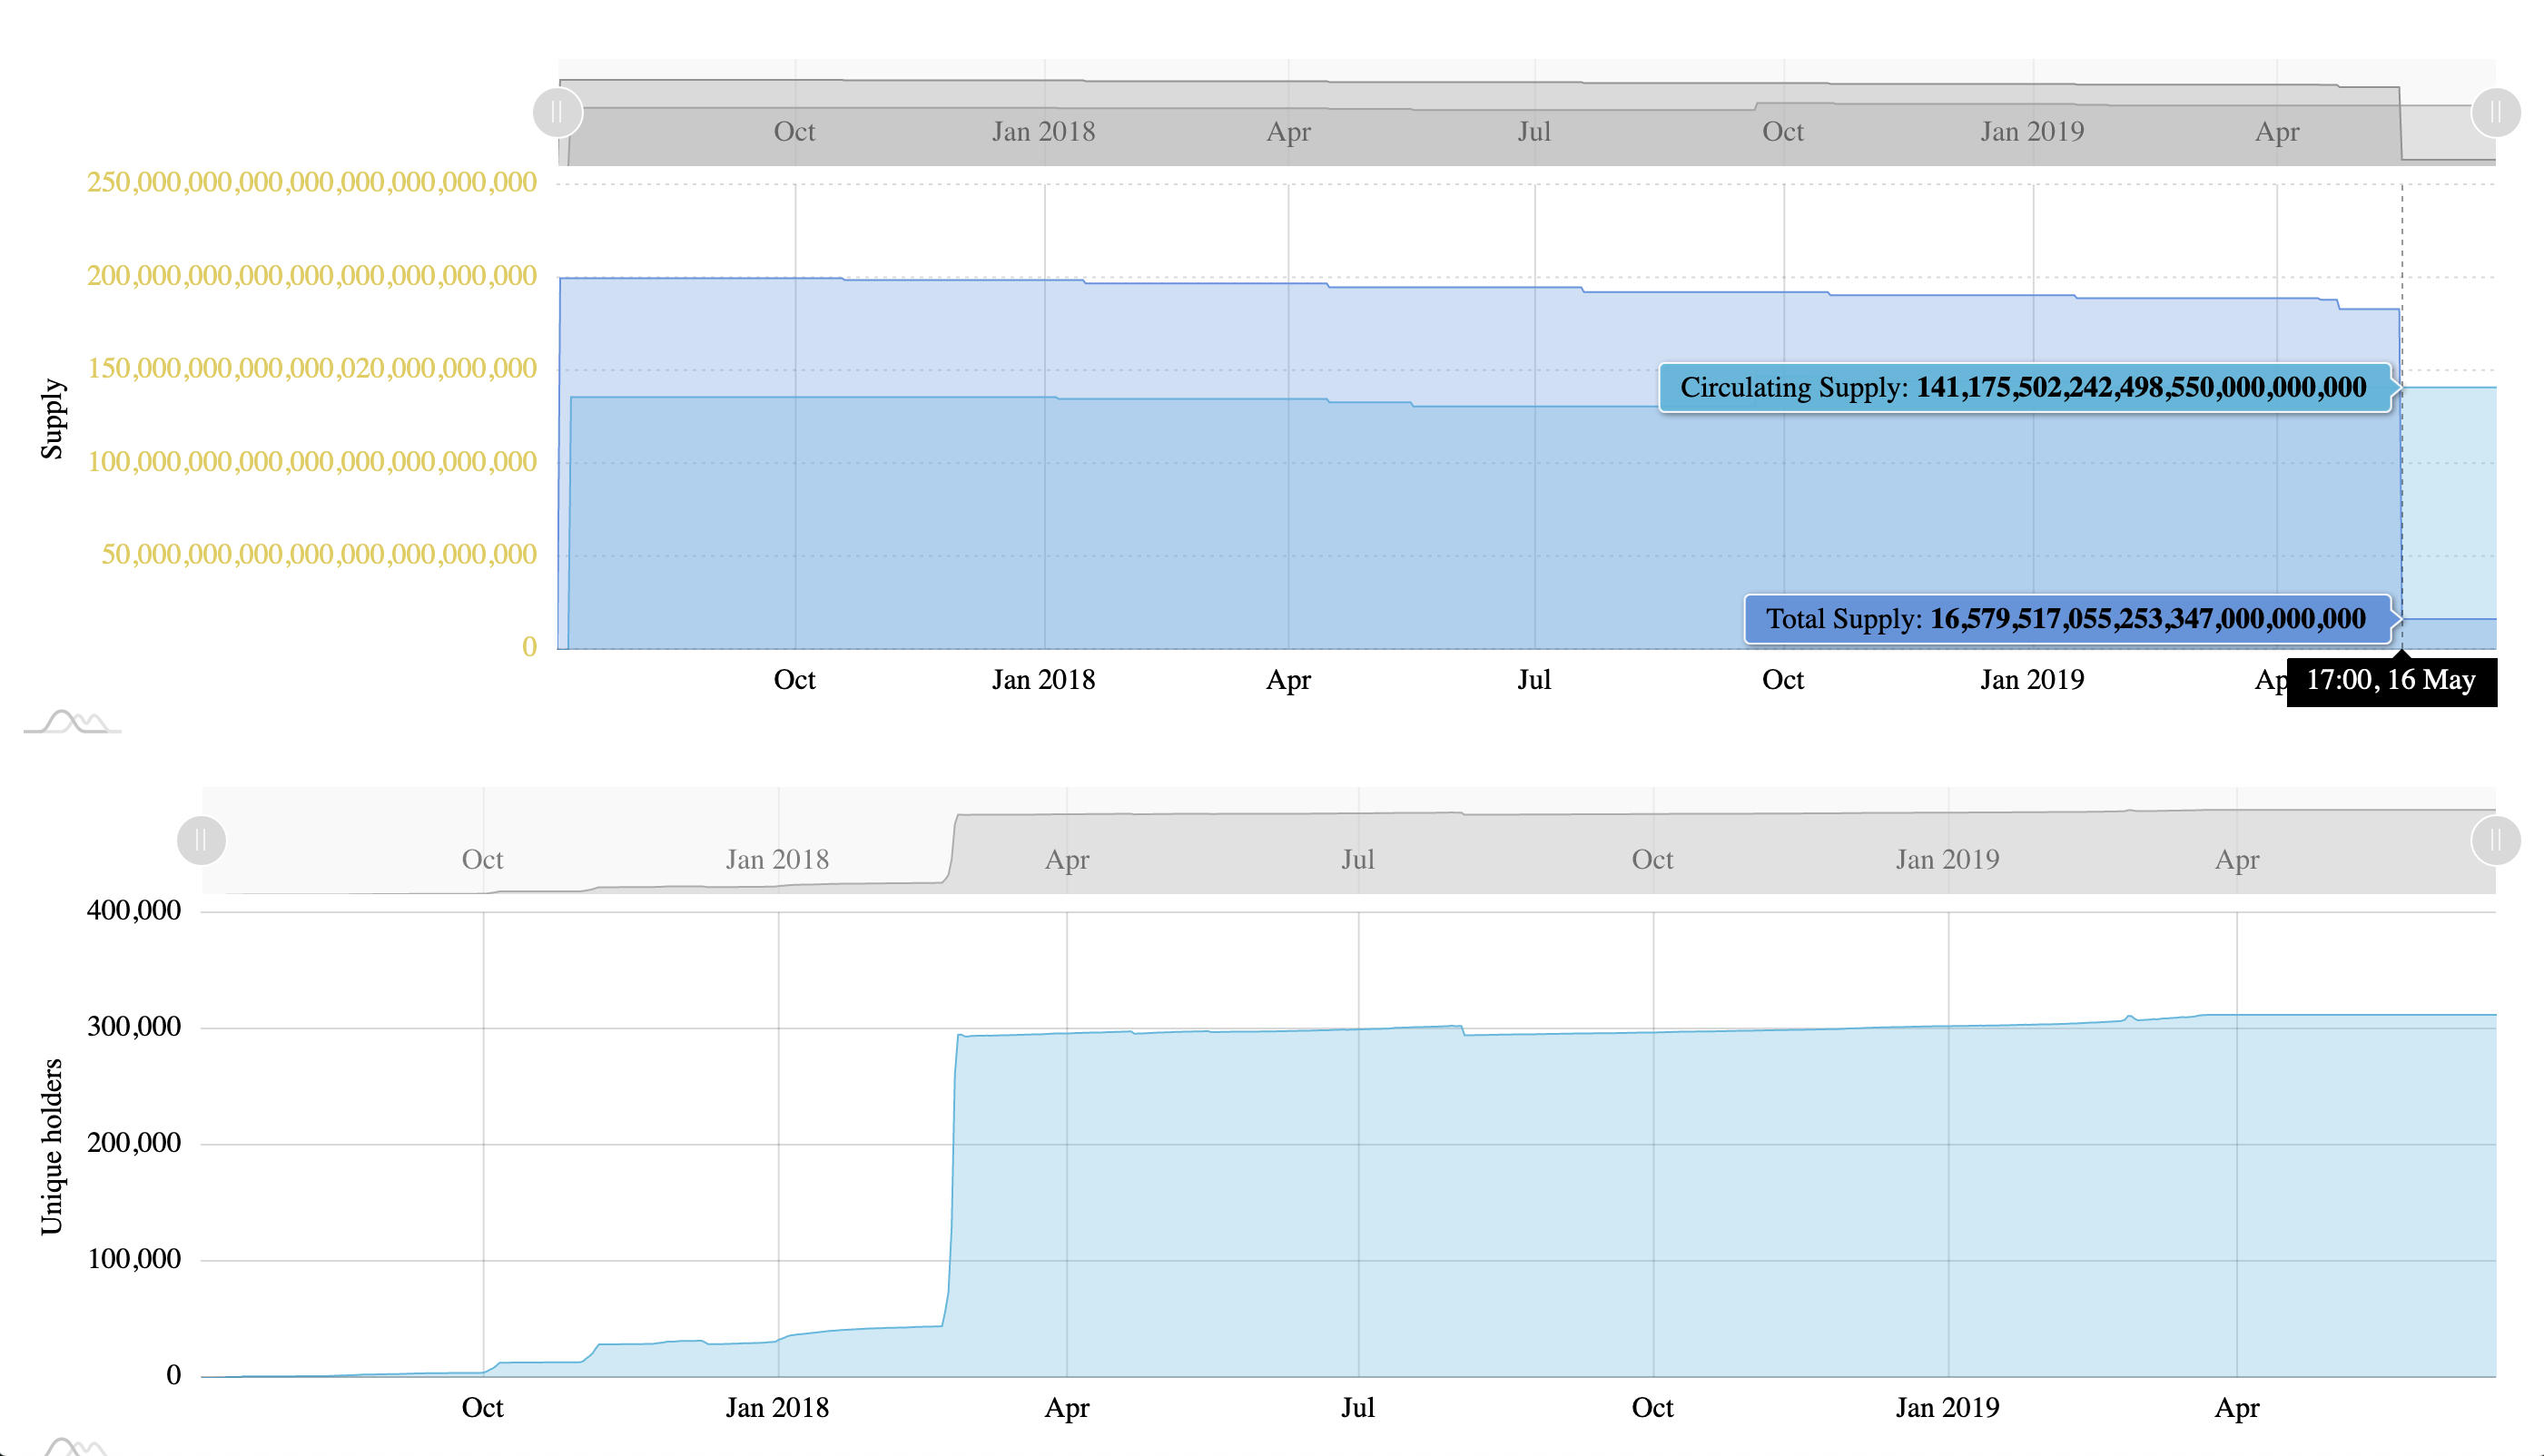
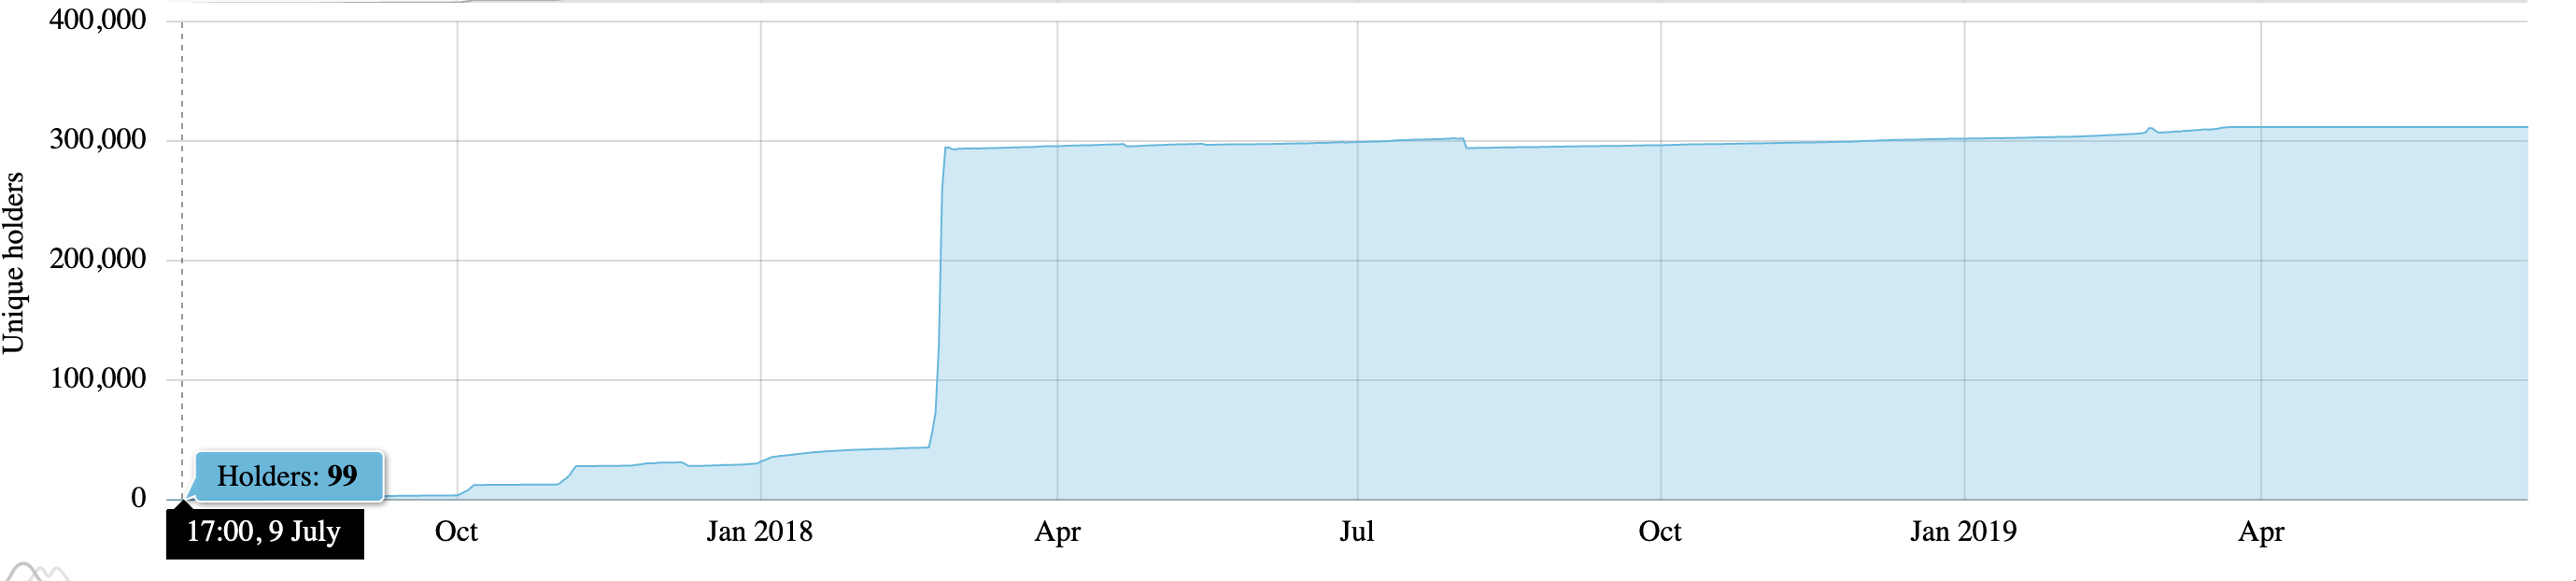
Binance is two years old, there are a couple points of interest with the historical data. On July 9th the first 99 holders got BNB token. On February 26th BNB holders went from 73,788 to 295,362 a very significant distribution, the highest change in the lifetime of the token. Since then, holdings have been steady as seen in the chart above.
For this summary, I used historical data with aggregation counts:
// BNB Ethereum Addressconst address = ‘0xb8c77482e45f1f44de1745f52c74426c631bdd52’const url = `https://web3api.io/api/v1/tokens/${address}/supplies/historical`axios.get(url, { headers: { ‘x-api-key’: AMBERDATA_API_KEY } }).then(res => { const d = res.data.payload.data // console.log(d) Returns: // [ // { // date: 1501891200000, // holders: 1501, // circulating: “136000000000000000000000000”, // total: “200000000000000000000000000” // }, // … // ]3. How many BNB tokens does my average holder have?
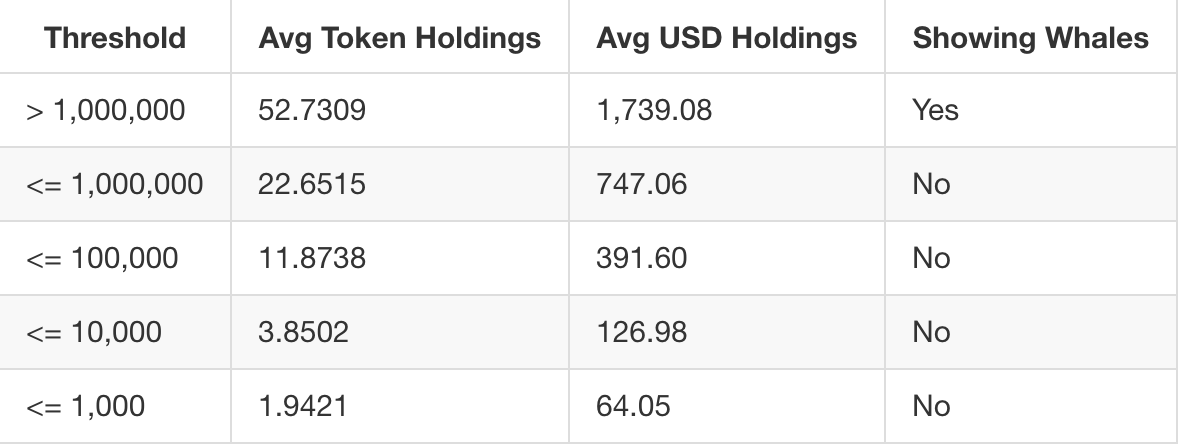
Since there are a large number of holders, let’s check how many BNB tokens are held. This is a good way to check distribution overall, and make sure its not another “airdopped” fake token. The following table shows a few snapshots including and excluding token “whales” (a term used for holders with significantly large holdings.) Its setup to show different segments, the interesting row being the last one: Of the BNB holders, those with less than 1000 BNB, is it just a single token indicating airdop? It appears to be a low but semi even distribution otherwise I’d expect to see a whole number.
// BNB Ethereum Addressconst address = ‘0xb8c77482e45f1f44de1745f52c74426c631bdd52’const url = `https://web3api.io/api/v1/tokens/${address}/holders/latest`axios.get(url, { headers: { ‘x-api-key’: AMBERDATA_API_KEY } }).then(res => { const d = res.data.payload.records // Example data available: // address, tokens, percent, usd, usd_percent // 0x3f5ce5fbfe3e9af3971dd833d26ba9b5c936f0be, 4957651117594556779229397, 29.902264951823108156, 159052556.8653411416850106525770537555, 3.511693927250585177})4. What percentage of my token holders are whales?
A few examples here: 1MM in tokens, 1MM in USD, etc
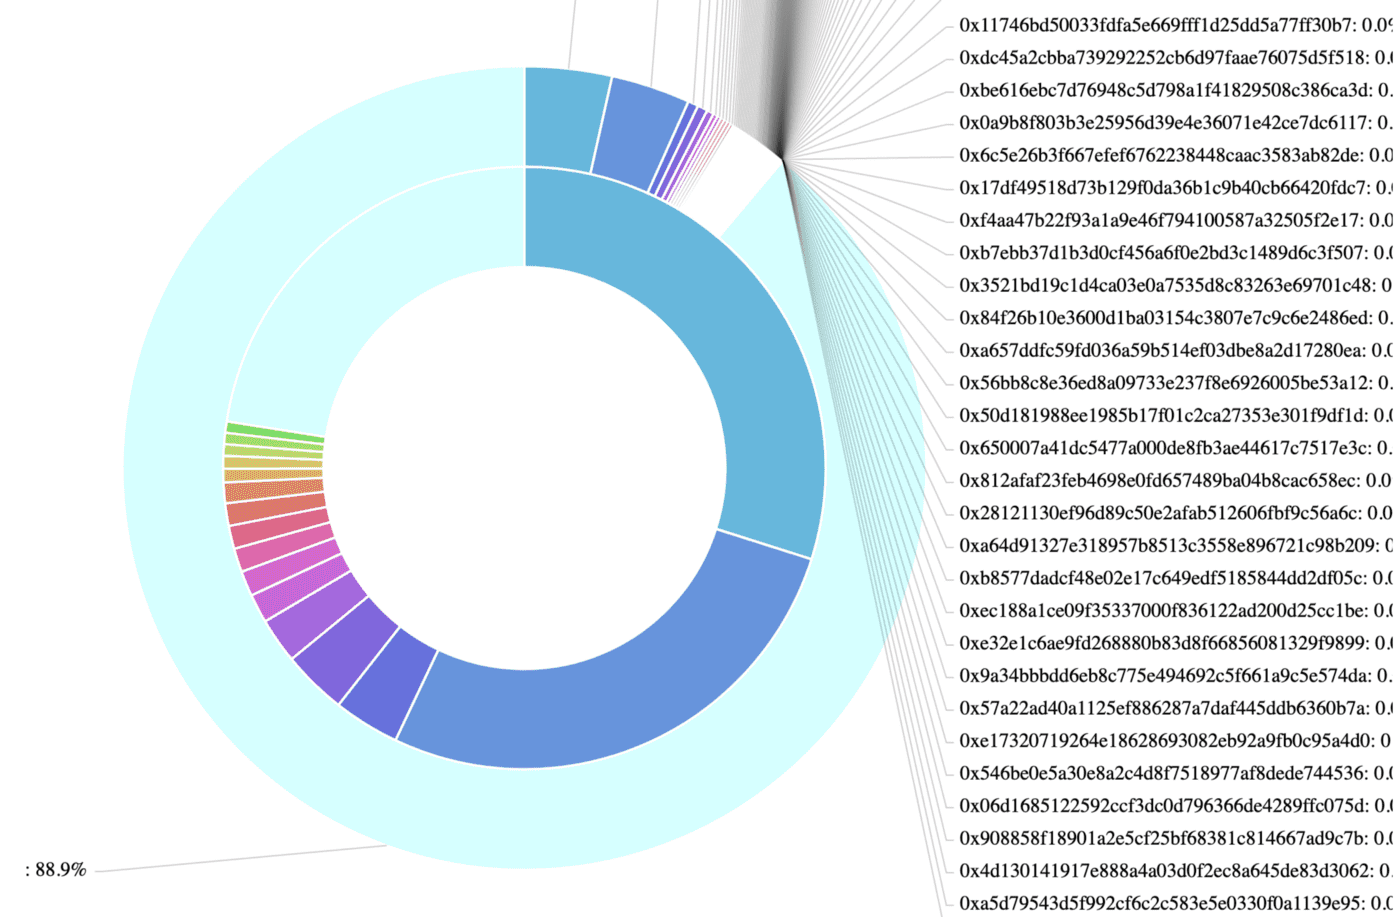
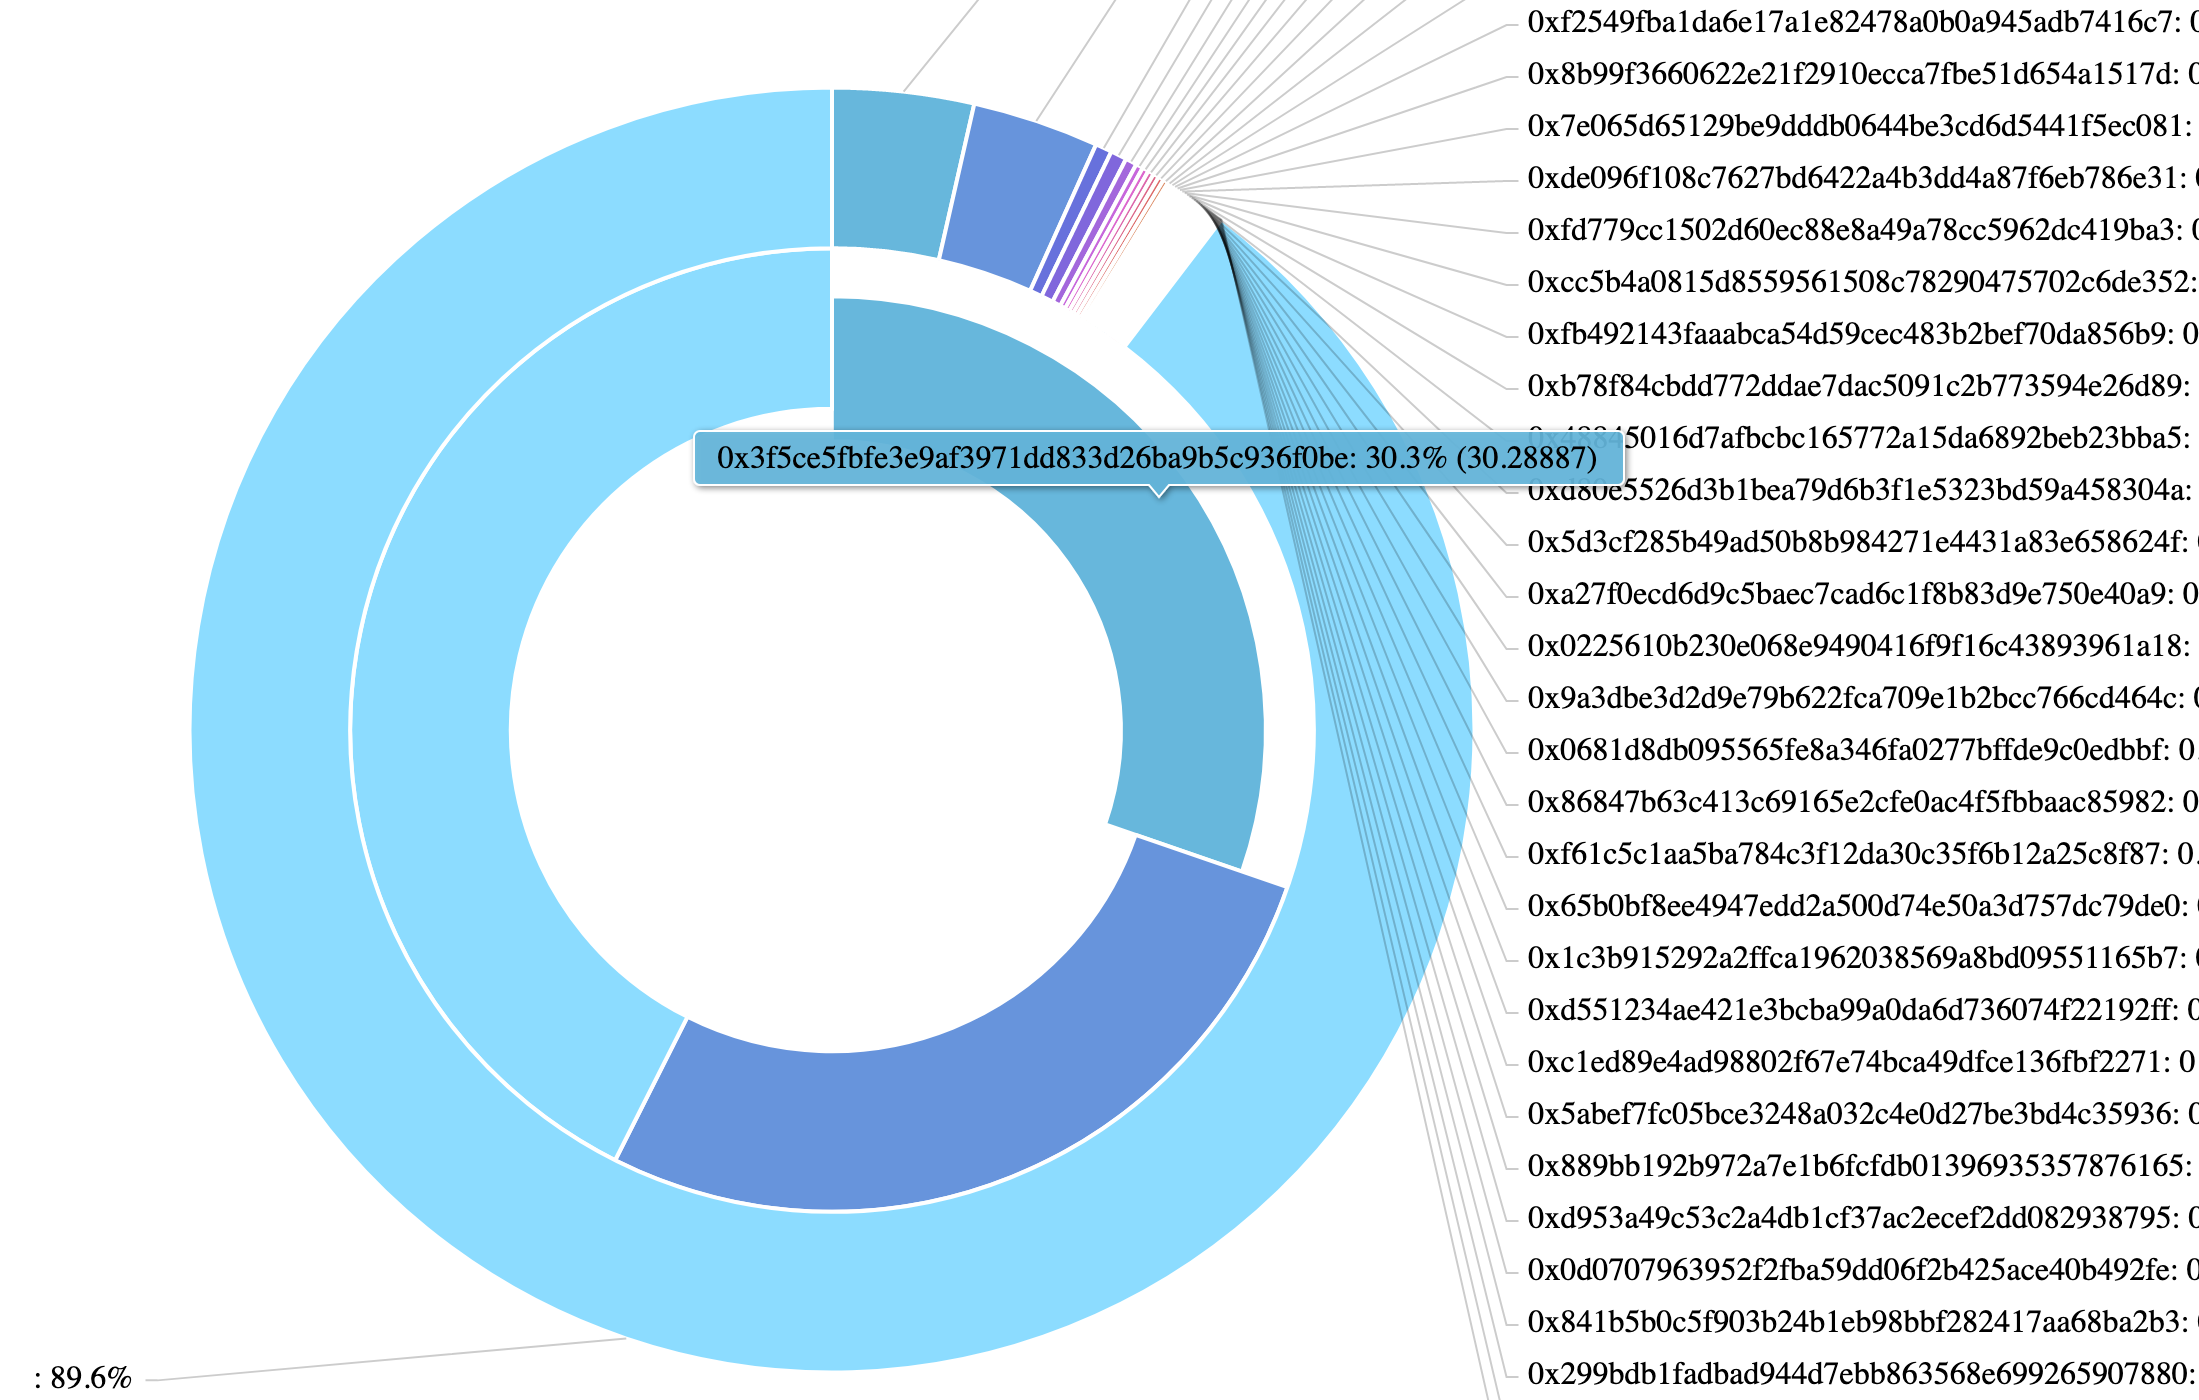
The chart below shows the overview of all token holdings by percentage, filtering results to token holdings above 1MM tokens (outer circle) and $1MM dollars (inner circle):
The next chart shows holding percentages filtered to 100k tokens (outer circle) and $100k dollars (inner circle):

In these examples, we are using the same data set used in #2, this time filtering the low values and showing percentages for large token holdings. The math is quite simple, for each holder above the defined threshold:
(Token Holding Amount / Total Available Supply) * 100 = Percent Holdings5. What other tokens do my token holders usually hold?
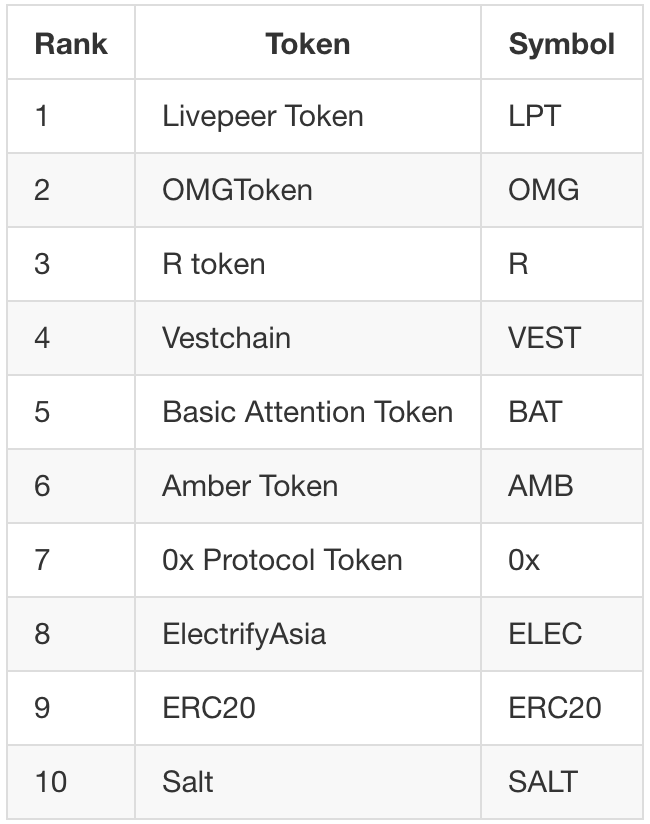
Since this is an exchange, it would be interesting to see what other tokens each holder holds. This could be an indicator of other popular tokens available or that are likely to be traded. It could even be tokens that are entirely meaningless or fake, to combat this, I used price as an indicator of a trade-able asset (something not all tokens have) and also filtered for uniques. The rankings are very interesting:
This data was achieved by using the initial holders addresses list generated by #3, then iterating each holder and mapping/tallying unique tokens. Note: this process took quite a while, as there are a large about of BNB holders. The following endpoint is used for viewing each holders token holdings:
// BNB Ethereum Addressconst address = ‘0xb8c77482e45f1f44de1745f52c74426c631bdd52’const url = `https://web3api.io/api/v1/addresses/${address}/tokens$`axios.get(url, { headers: { ‘x-api-key’: AMBERDATA_API_KEY } }).then(res => { const d = res.data.payload.records // Example data available: // address, tokens, percent, usd, usd_percent // 0x3f5ce5fbfe3e9af3971dd833d26ba9b5c936f0be, 4957651117594556779229397, 29.902264951823108156, 159052556.8653411416850106525770537555, 3.511693927250585177})Conclusion
This is just the tip of the iceberg, but as you can see we start to see an interesting picture into the usage and story of Binance on Ethereum.
The code is available here:
amberdata/amberdata-example-token-analysis
A set of scripts to understand core usage for a given address. - amberdata/amberdata-example-token-analysis
github.com
Getting started is easy, here’s a few quick steps:
1. Signup on Amberdata.io
2. Get an Amberdata API key
3. Follow the examples above
NOTE: for questions #2, #3, you will need a professional or on-demand API Key.
We hope you enjoyed this post! Leave us comments or questions below or find us on social:
- Website: Amberdata.io
- Twitter: Amberdataio