Share this blog:
Welcome to Amberdata Derivatives Fresh New Features where we go in-depth on features that have recently been built for our ADD customers. Analyzing the Volatility Smile in both Strike View & Delta View.
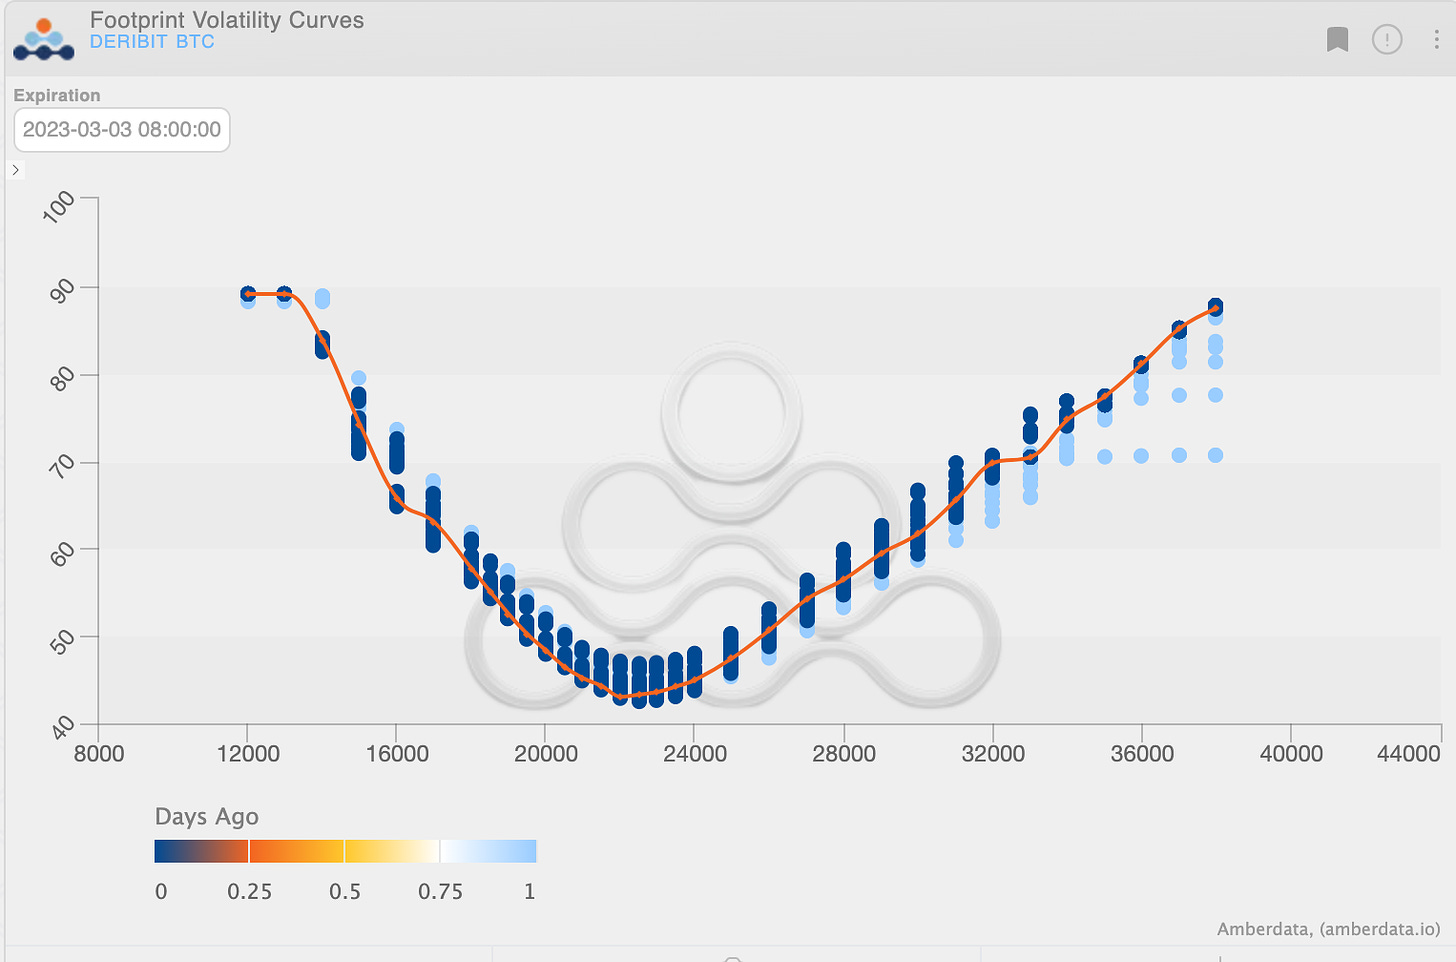
Footprint Volatility Curves
We’ve added a cleaner way to analyze the current and past behavior of the volatility smiles.
Combine these charts with the “Volatility footprint” (below) for truly holistic insights.
Shadow Skew Strikes
This Amberdata Derivatives chart depicts for the selected expiration, the implied volatility curves time, across a strike space.

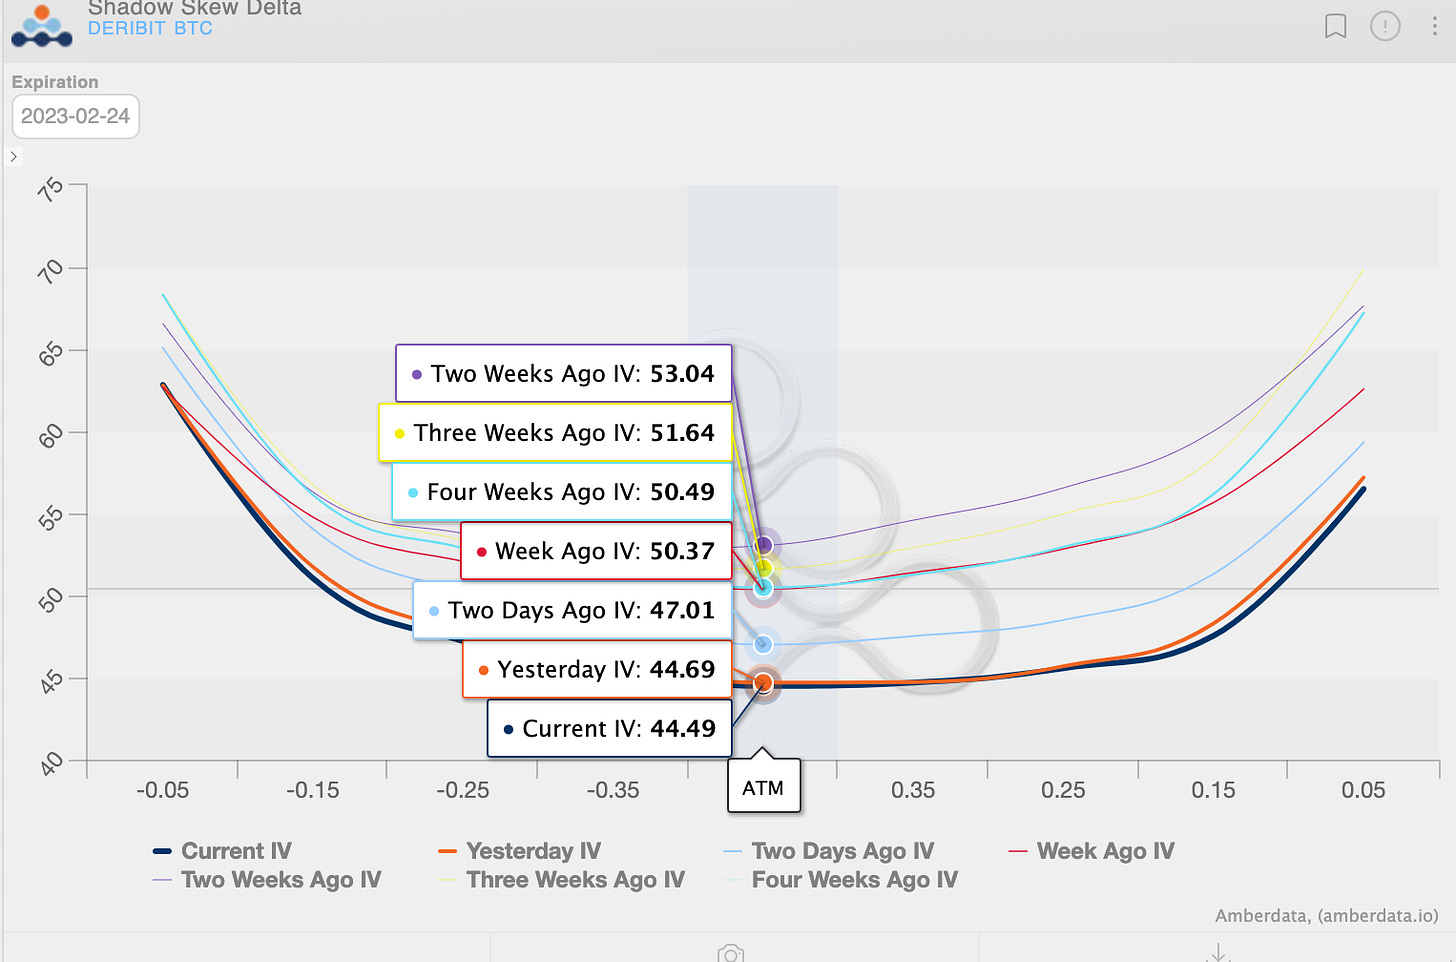
Shadow Skew Delta
This chart depicts for the selected expiration, the implied volatility curves time, across a delta space. Using delta, instead of specific strikes gives the possibility to compare curves in time without any distortion caused by underlying price move.
How to find this chart? Options → Deribit → Historical
Find the chart HERE:
Click here to learn more about Amberdata.
