November 11, 2022
Share this blog:
Welcome to Amberdata Derivatives Fresh New Features where we go in-depth on features that have recently been built for our ADD customers.
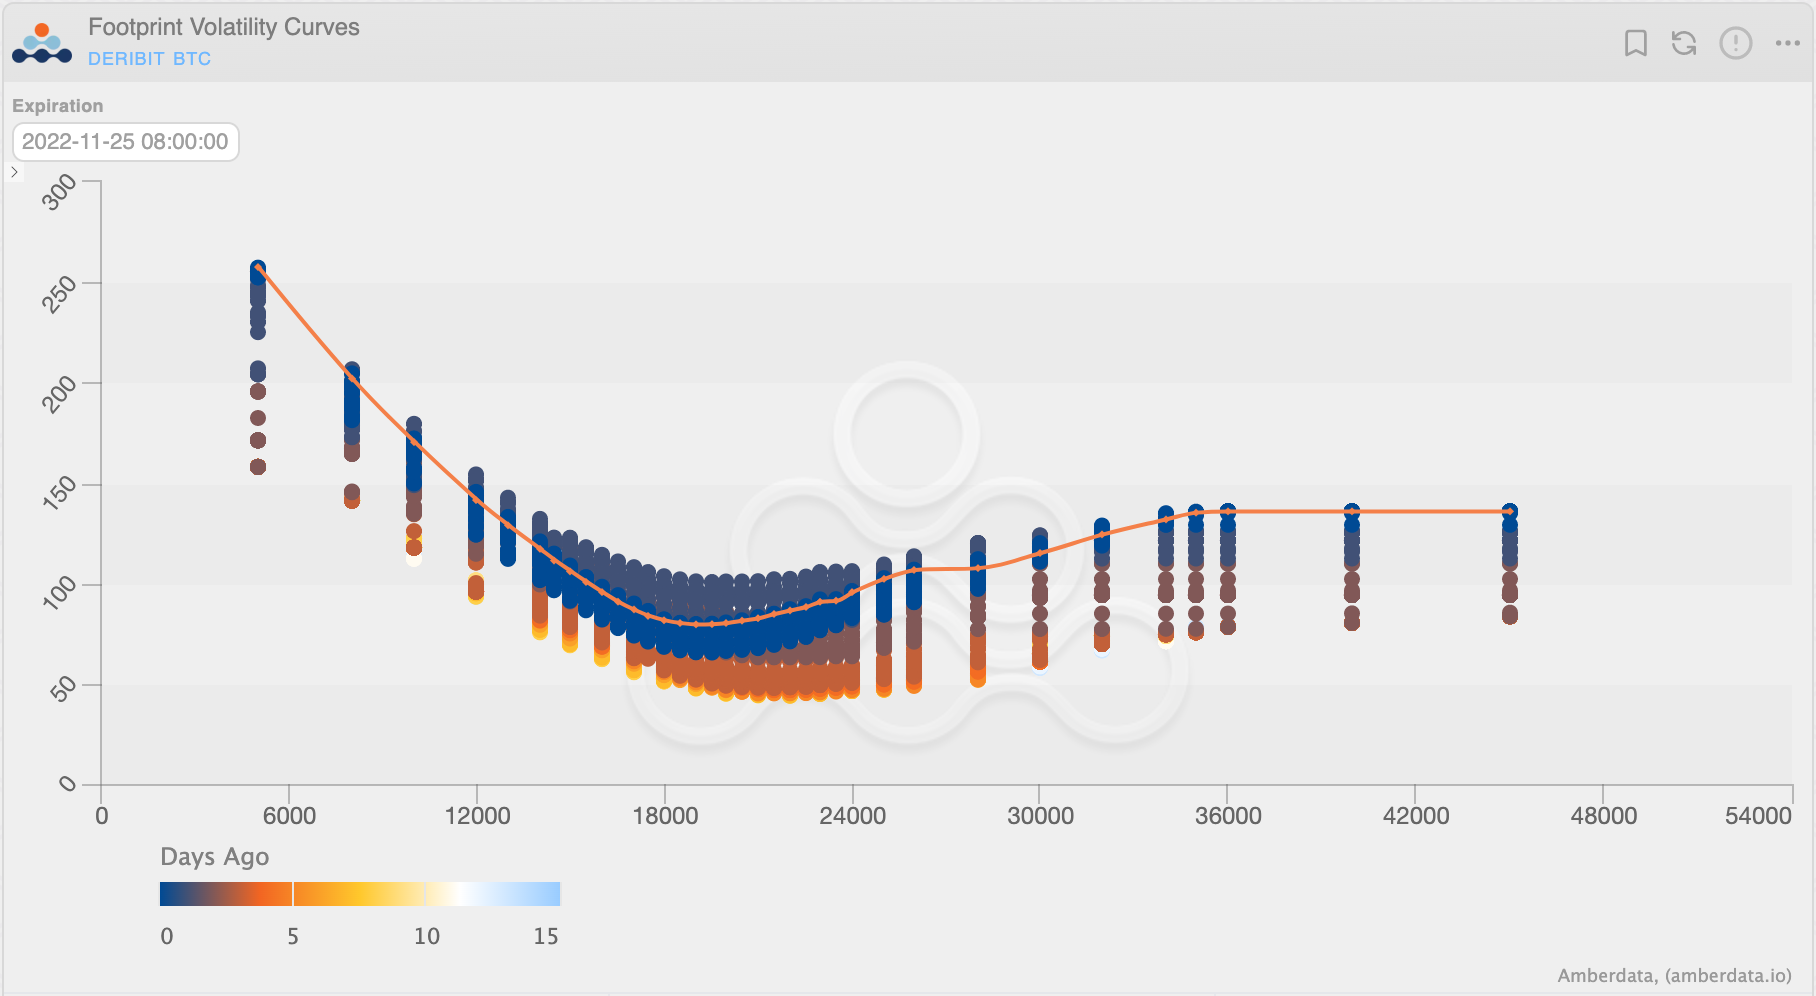
With the current volatility, we’re seeing a wide range of variance in option surfaces.
Our new feature, the “Footprint Volatility Curves”, allows traders to quickly see the recent time lapses of IV smiles (VS) where pricing currently resides.
A quick glance like this helps traders not only gauge IV level but also the change in curvature!

How to find this chart? Options → Deribit → Historical
Find the chart HERE:
Click here to learn more about Amberdata.
