Share this blog:

Welcome to Amberdata Derivatives Fresh New Features where we go in-depth on features that have recently been built for our ADD customers. Analyzing ATM IV With Box Plots!
This will quantify the Quartile distribution of the ATM IV term structure.
The chart depicts the boxplots of atm volatility in constant maturity.
Besides the information about the percentile distribution (0.25, 0.50, 0.75), the lower and upper fences are calculated using the standard metrics of Q1 - 1.5 * IQR and Q3 + 1.5 * IQR (where IQR = Q3-Q1).
This powerful tool helps to identify cheap/rich implied volatility compared to its historical values.
The dotted line represents the current (the most recent) value. Data available as of 1st Apr 2019.
Chart: YTD (VS) Current TS
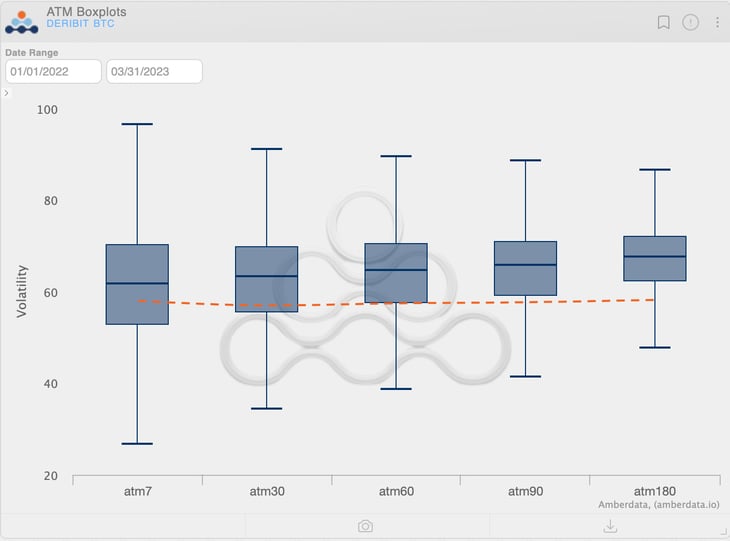
Chart: 2022 (VS) Current TS
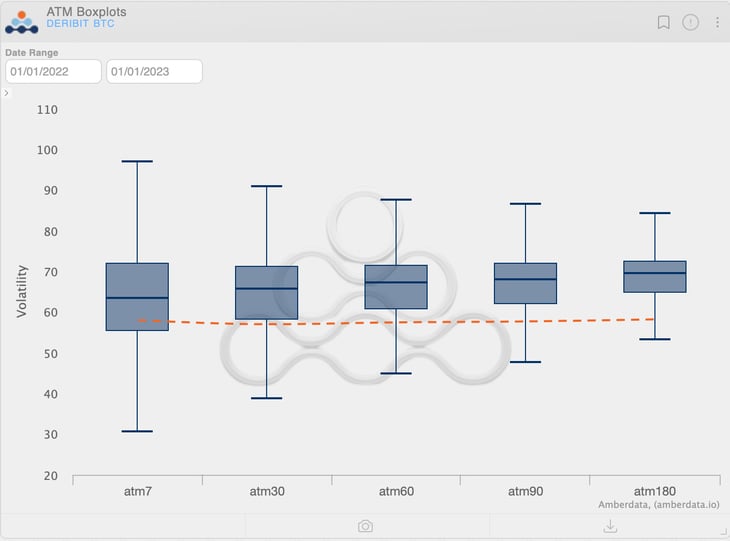
Chart: 2021 (VS) Current TS
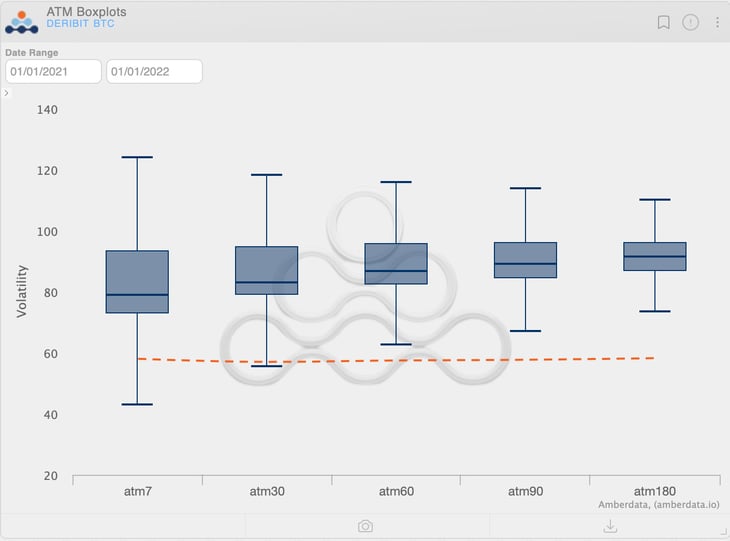
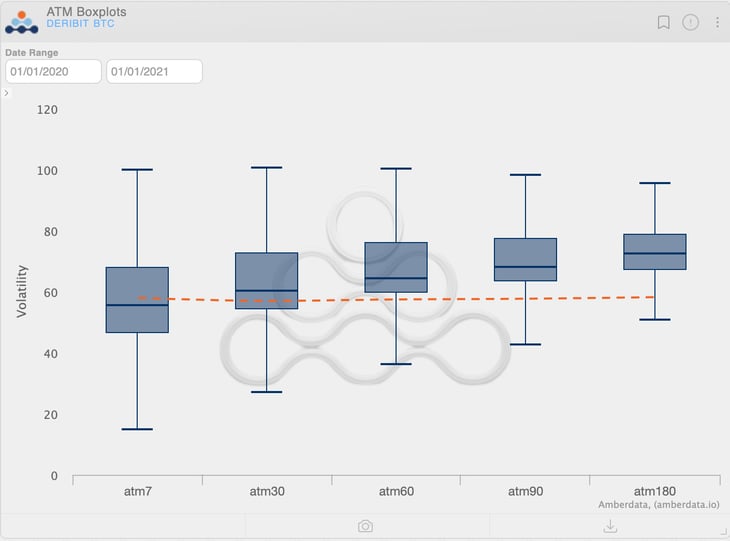
Chart: 2020 (VS) Current TS
How to find this chart? Options → Deribit → Historical
Find the chart HERE:
Click here to learn more about Amberdata.
