Share this blog:

-
Tuesday 9:00 am - Home Prices, S&P Case Shiller Index
-
Wednesday 8:15 am - ADP employment
-
Wednesday 2 pm - Fed Beige Book
-
Thursday 9:15 am - ISM
-
Friday 8:30 am - NFP Employment Report
Disclaimer: Nothing here is trading advice or solicitation.
This is for educational purposes only.
Math-minded people here, pardon any typos.

MACRO THEMES: Debt Ceiling + Fed Minutes → NFP = WAIT & SEE
Last week’s PCE figure came in stronger than expected. Core PCE rose +4.7% YoY vs +4.6% Yoy in March.
Combine this fresh data with FOMC minutes released last Wednesday that showed the Fed members were split regarding continued rate hikes… We’re currently 10 consecutive hikes in with current rates at 5%-5.25%
This week’s employment numbers are likely to be a big mover if we deviate from consensus in either direction but the Fed is still stuck between inflation and bank stressors. We’re all in the same boat together, waiting for more economic numbers.
We reached more debt ceiling developments. This created a “pop” for spot prices for two key reasons (in my opinion):
-
As Stan Druckenmiller noted, the debt limit is a symptom of the core underlying problems… which are massive national deficits… essentially inflationary if continue to keep them unchecked.
-
A technical debt default would have likely raised borrowing costs, which raises yields, which would have made the dollar “yield more” and hence stronger (arguable, but that’s my view).
Crypto moved higher off the debt ceiling talks.
In TradFi this will likely bring VIX lower.
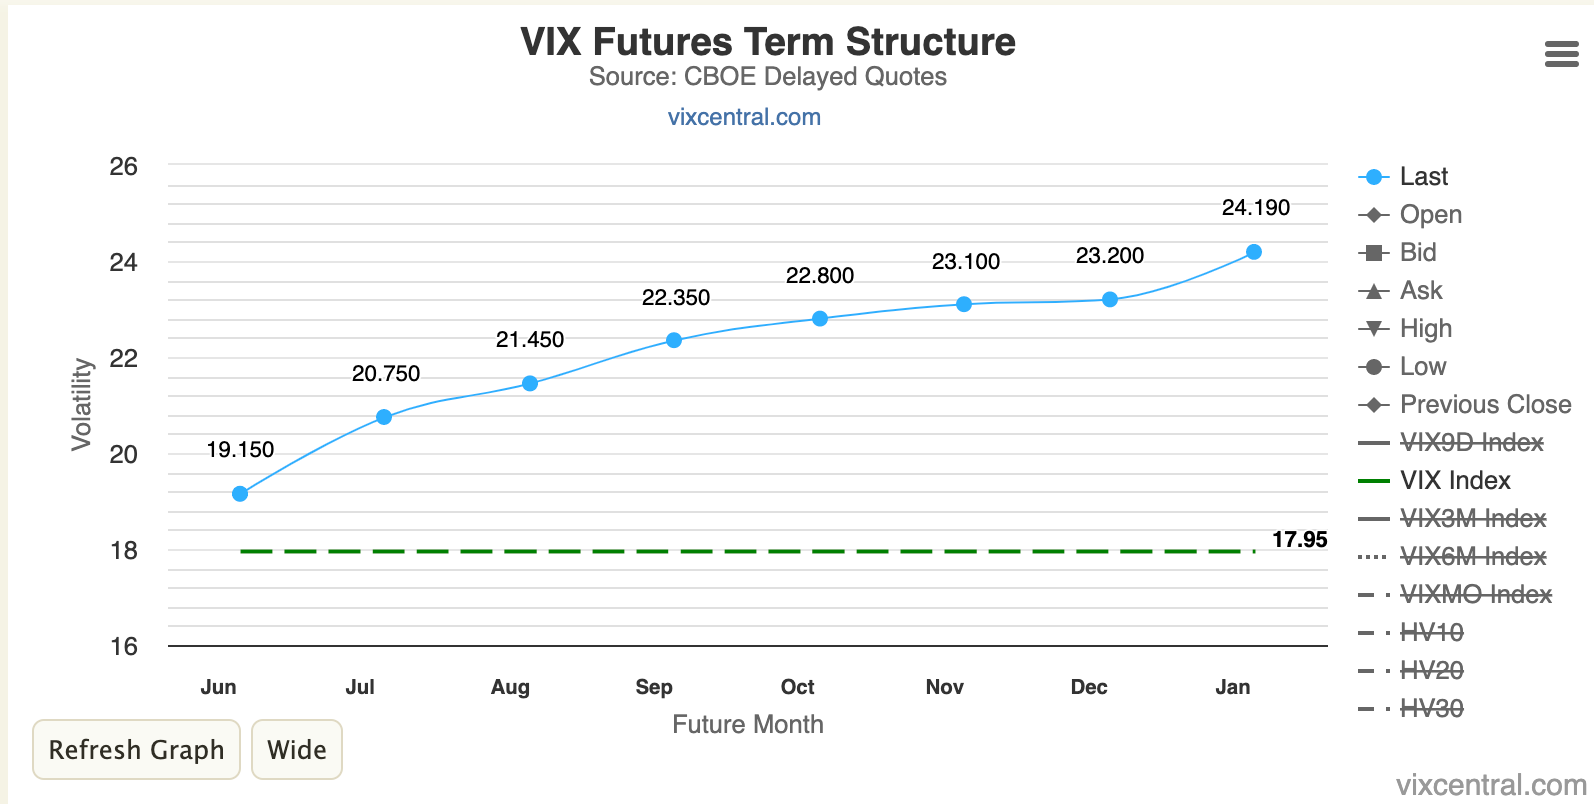
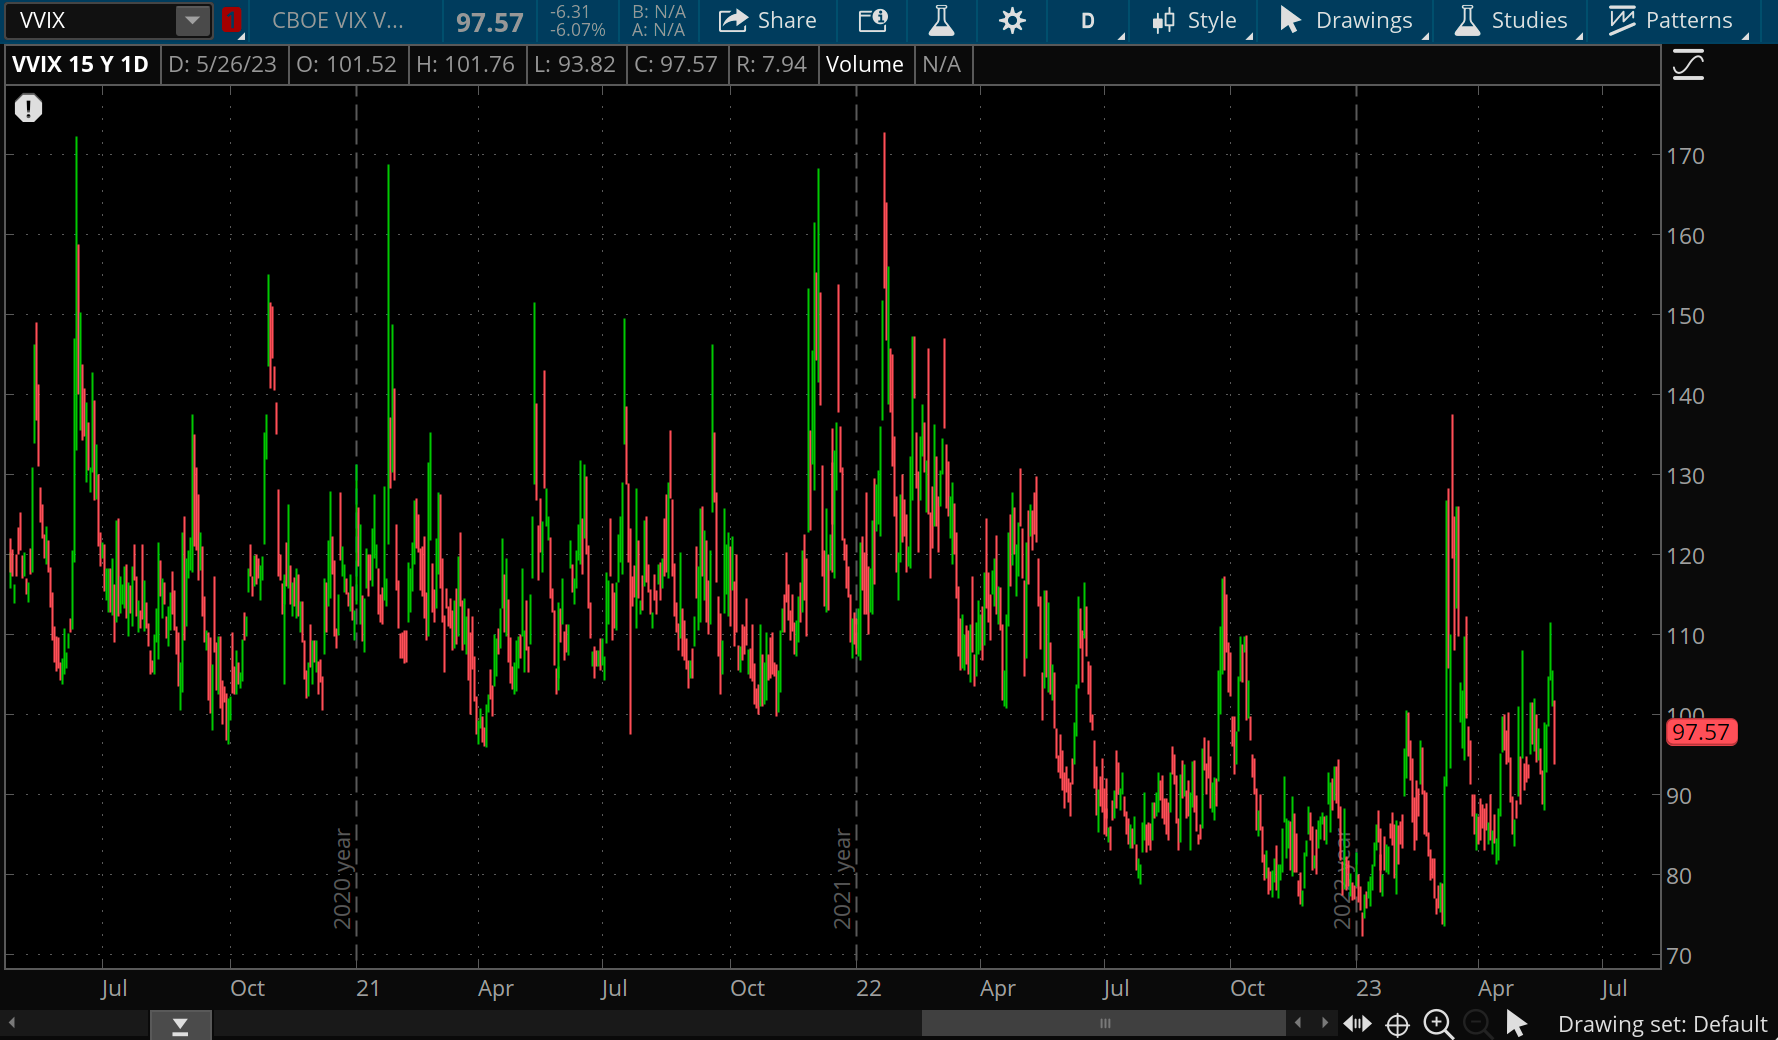
We currently have a steep VIX term structure with elevated VVIX.
Vix future option traders are pricing in the upcoming VIX movement (in my opinion, likely lower post-economic releases this week).

BTC: $28,108 (+5.3% / 7-day)
ETH :$1,918 (+5.4% / 7-day)
SOL: $20.86 (+6.6% / 7-day)
As noted, debt ceiling developments created some spot RV reactions in BTC.
This was enough to move implied higher on the short end of the curve creating another opportunity to short a flat-term structure.
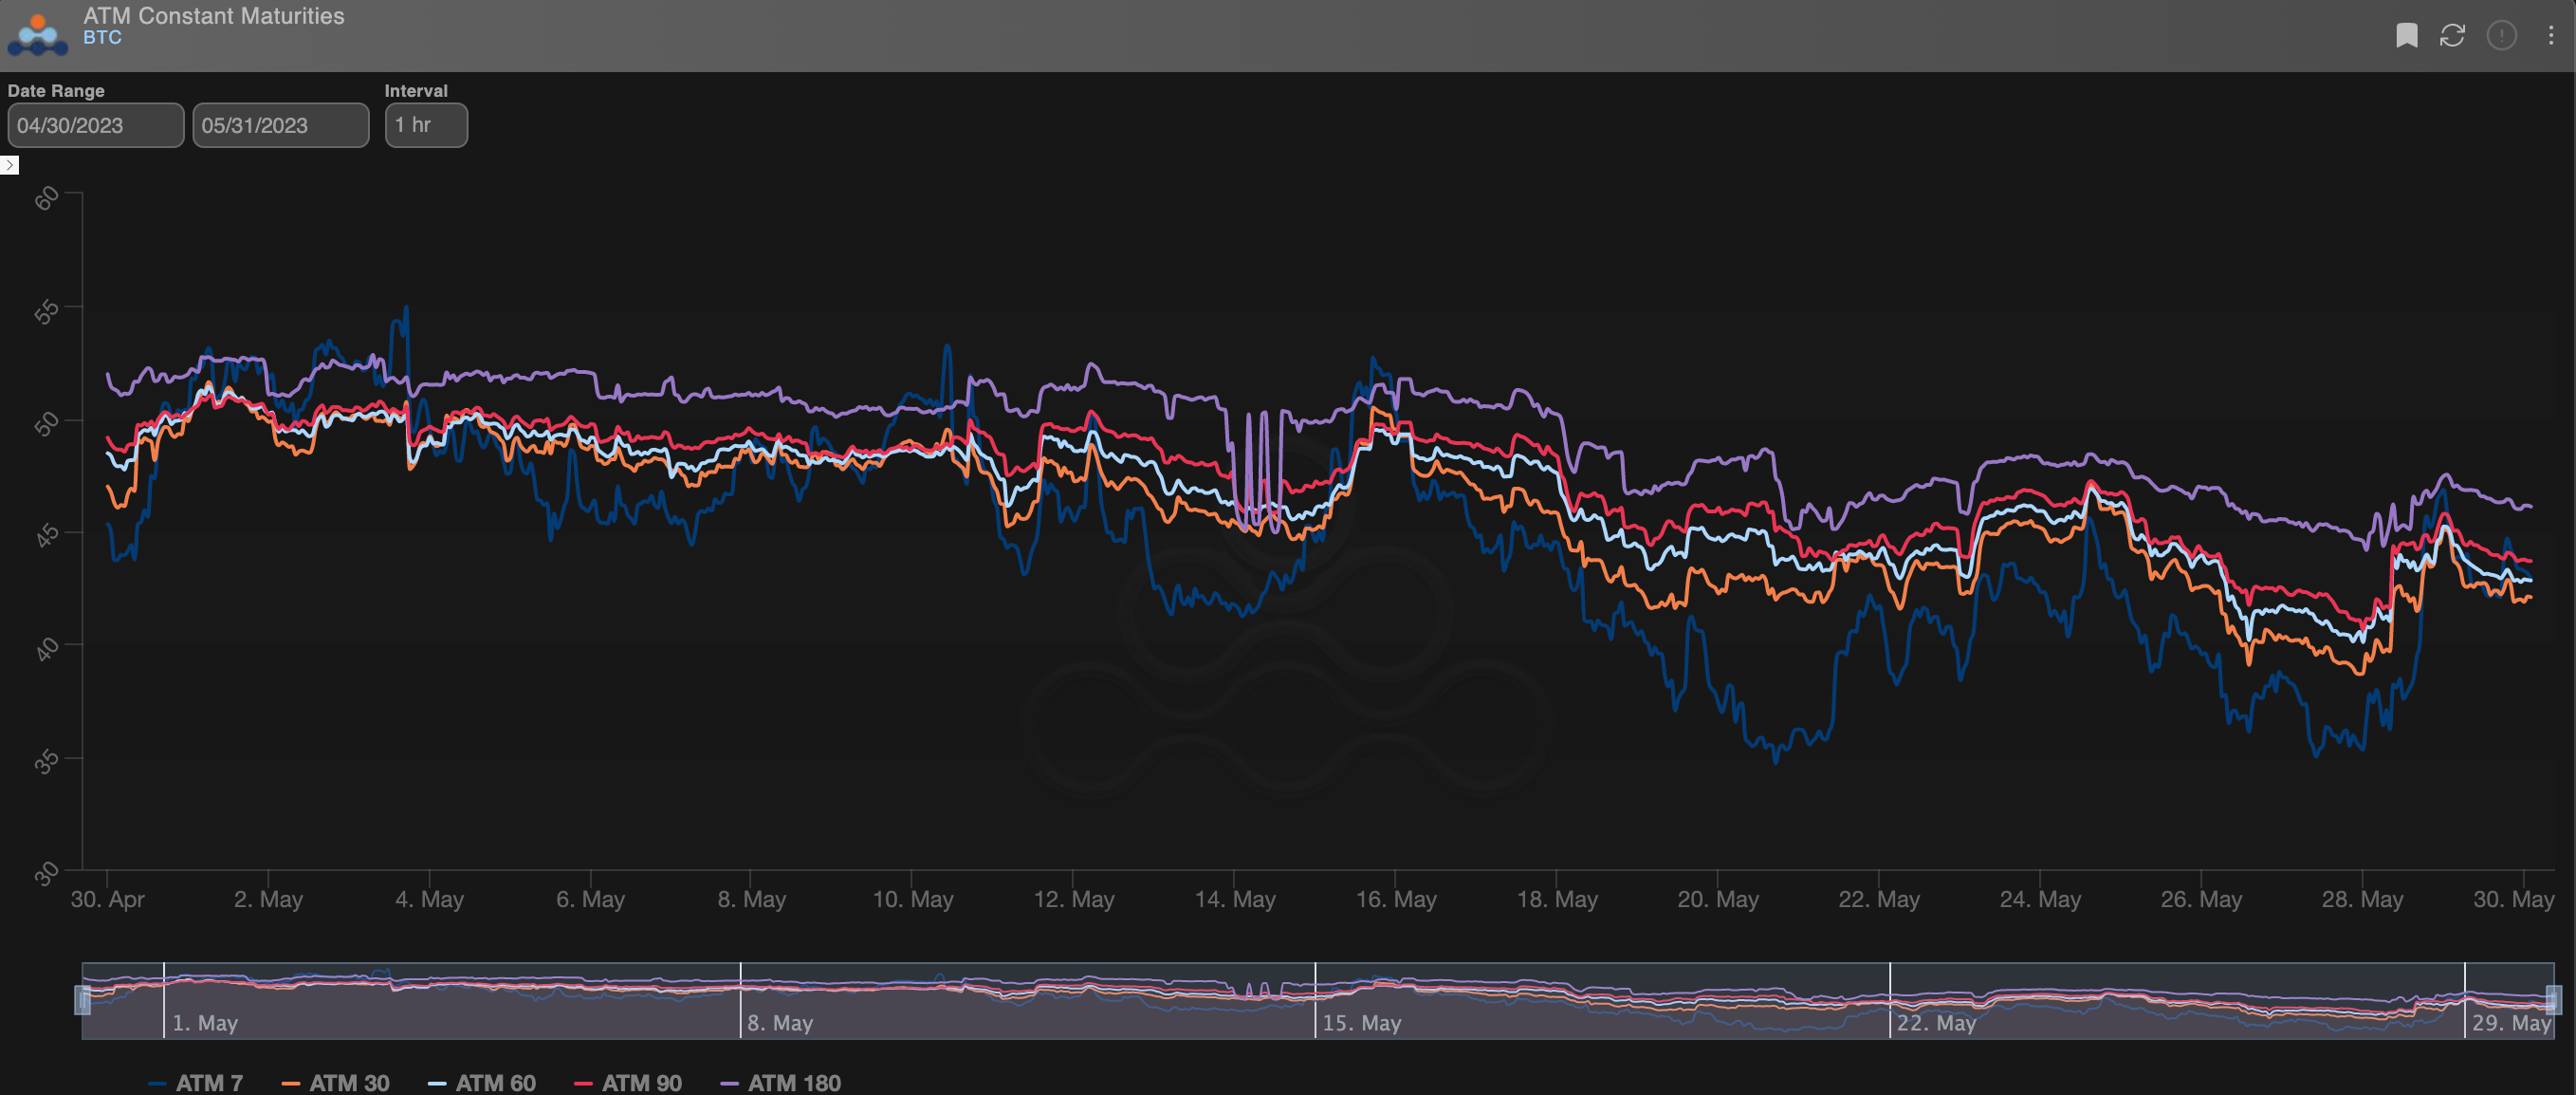 (BTC Fixed Maturity Term Structure)
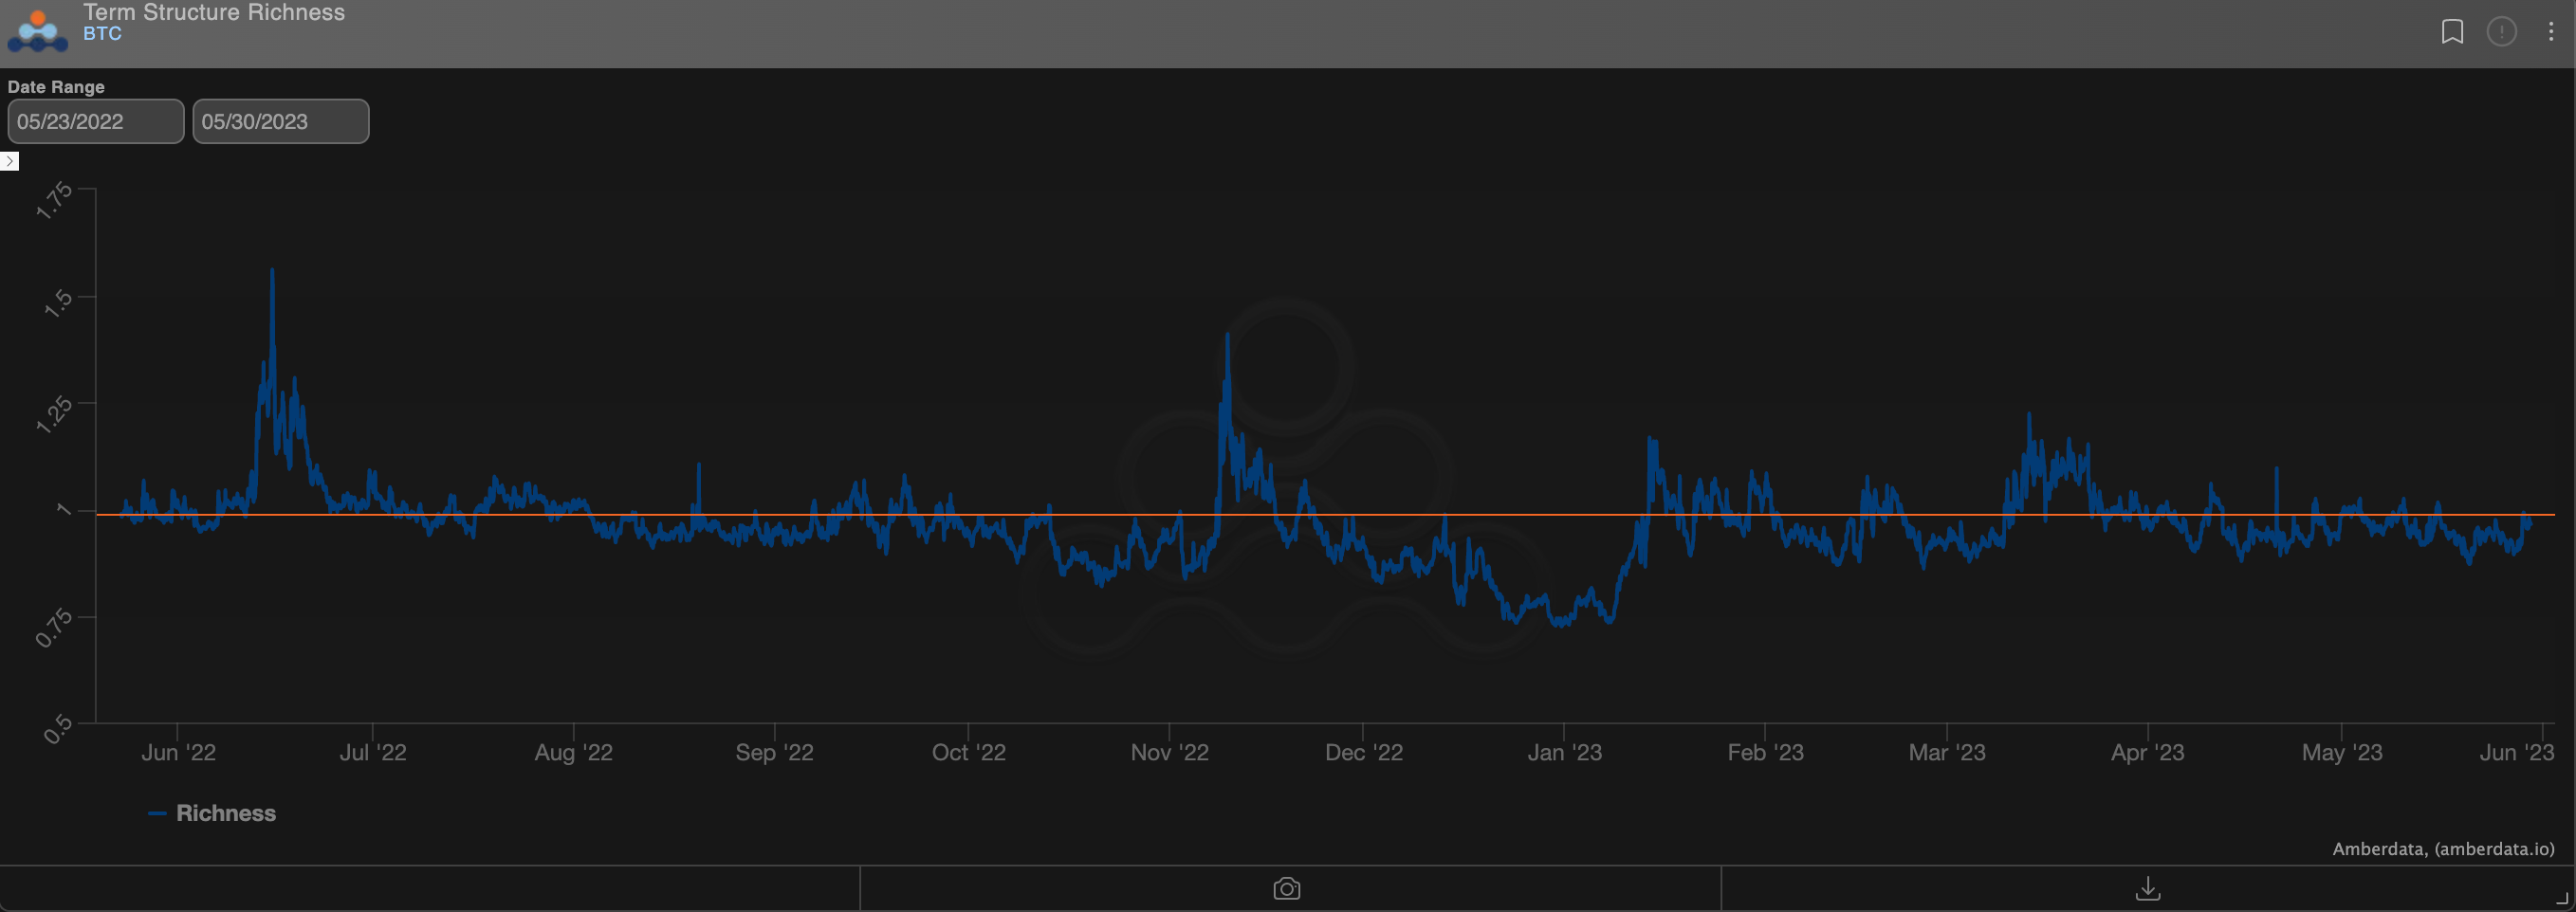 (BTC Term Structure Richness/Discount)
We can see using the chart above that there was another pop in the term structure bringing us back nearly to 1.00
Granted 7-day options will have NFP activity priced in, but given the VRP chart below, NFP will need quite a surprise number to justify buying short-dated vol here.
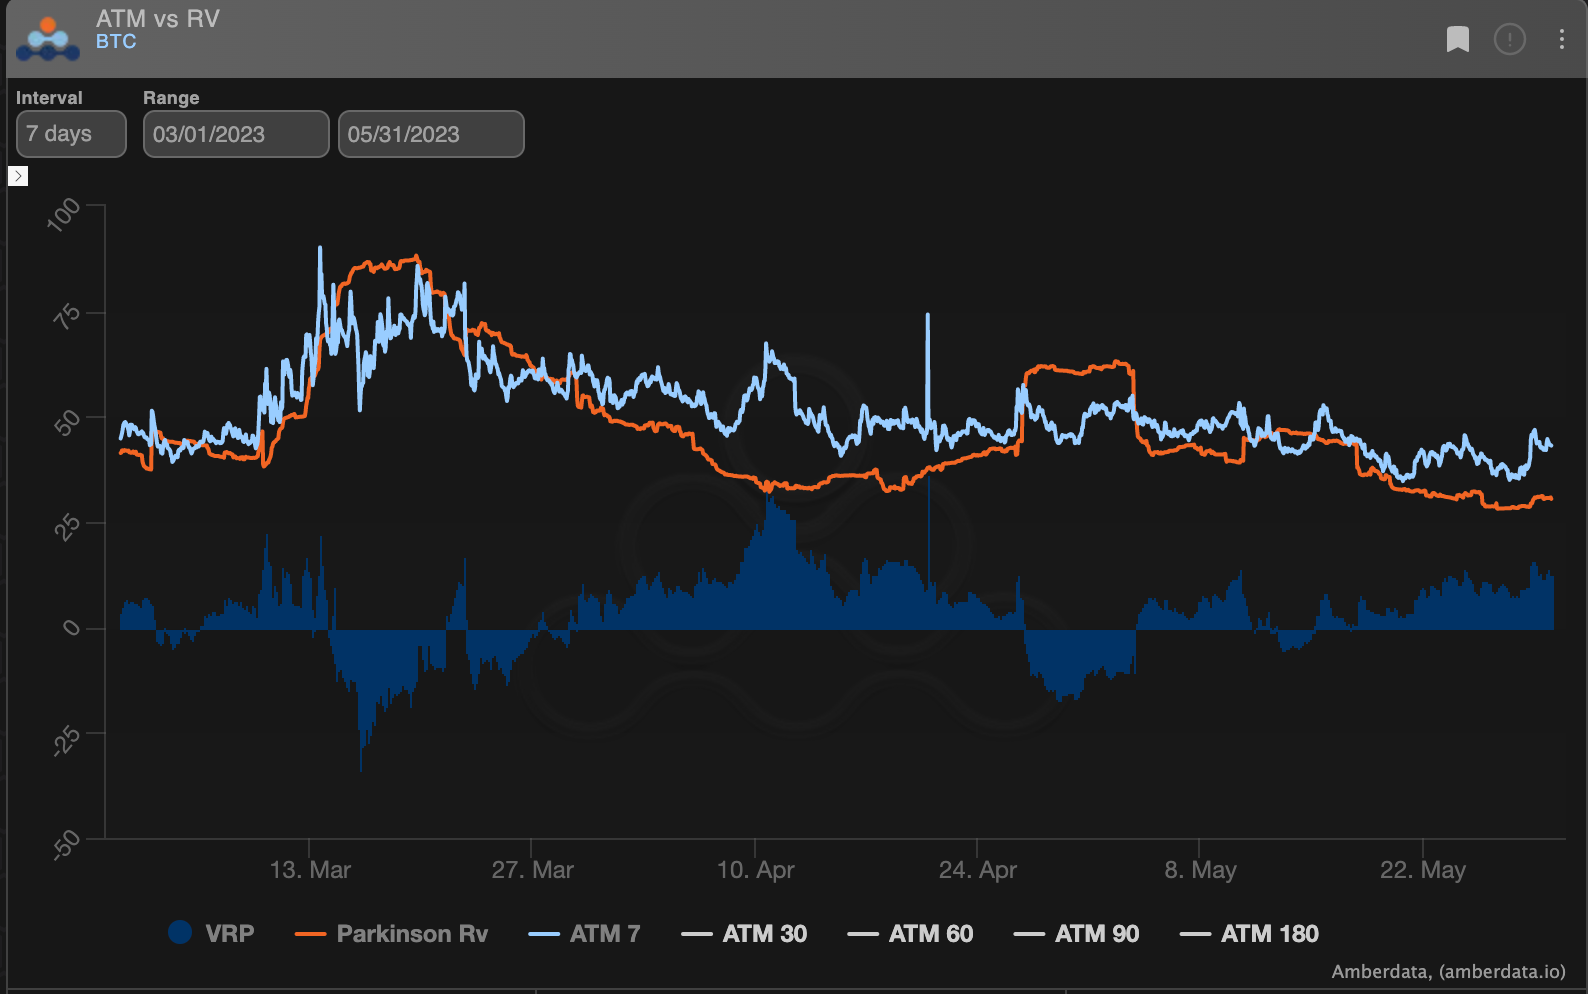 (BTC 7-day VRP)
There’s about 13pts of vol “Carry” here and BTC has a well tested spot price range that traders can rely on.
To me, the current set-up favors selling front-end BTC vol again, given the flat-ish term structure, in a massively low RV environment and fact that NFP may guide FOMC but BTC will likely only react to FOMC.
This means we’re likely in for more “wait and see”, regardless of NFP.
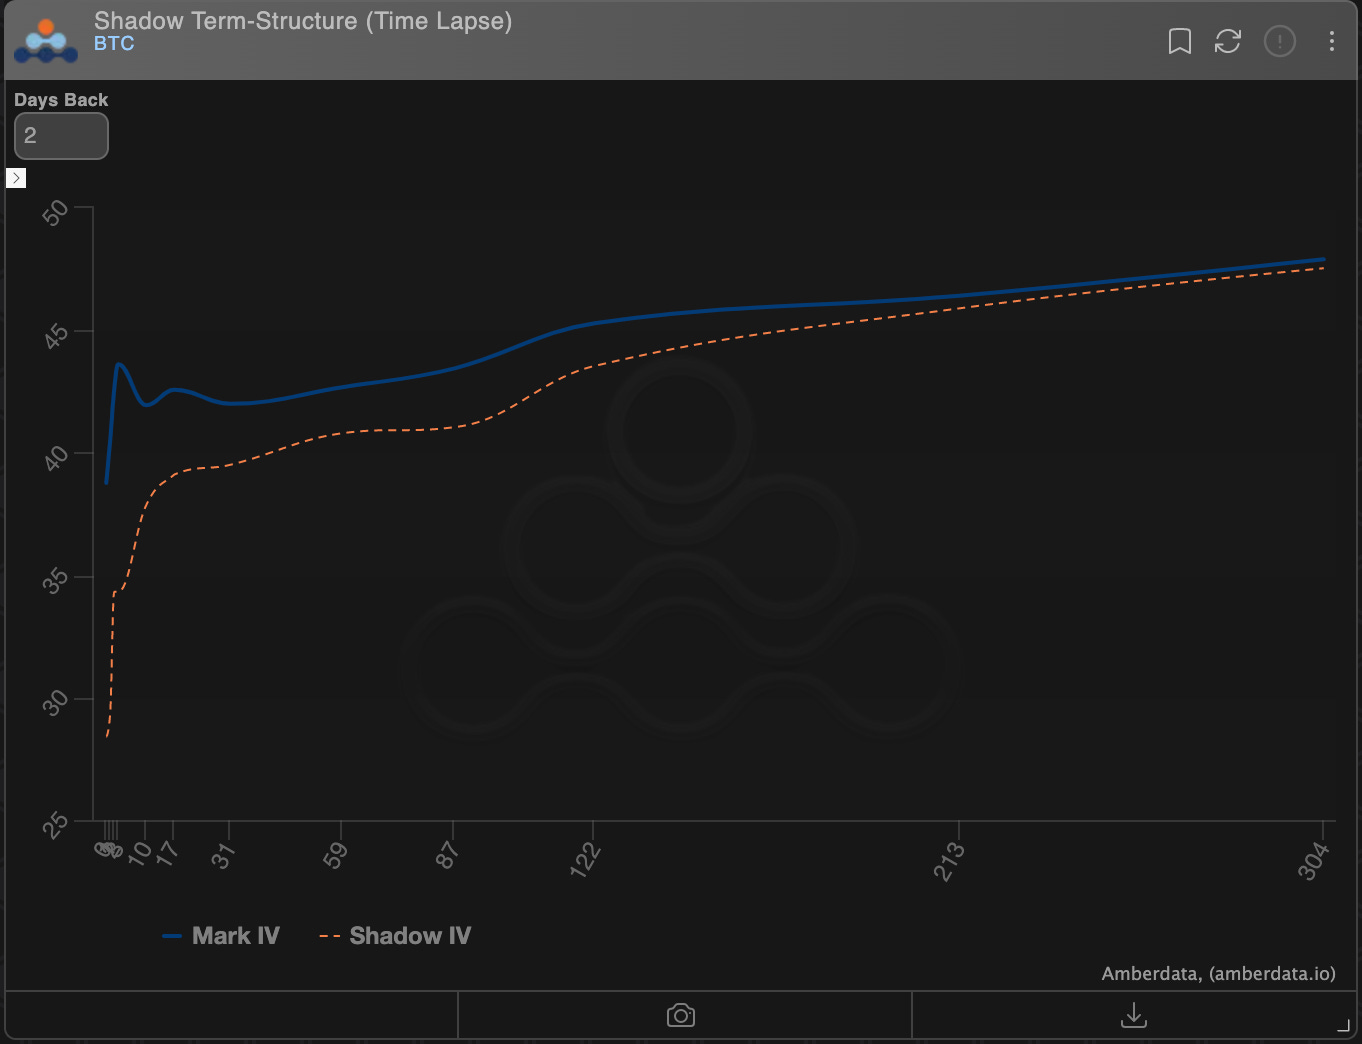 (BTC Term Structure vs 2-days ago “shadow”)
PROPRIETARY “GVOL-DIRECTION” FLOWS - @Gravity5ucks
The unresolved price action trapped in the $25k-$30k range seems to be driving the constant decline in weekly volumes, with timid buyers (fearing the bleeding theta) and aggressive sellers (enthusiastic about selling short-term vol with juicy VRP).
In fact, this can be considered a summary of the market over the past two months.
Regarding Bitcoin, we note a renewed upside exposure with the purchase of July $28k calls (closing the previous position at $34k in June).
The "Gravity chart" highlights traders' sensitivity this week to the $27k spot level: bullish positions (long calls, short puts) are opened above it, and closed below it.
The $30k (sold this week) remains a key turning point in the short term.
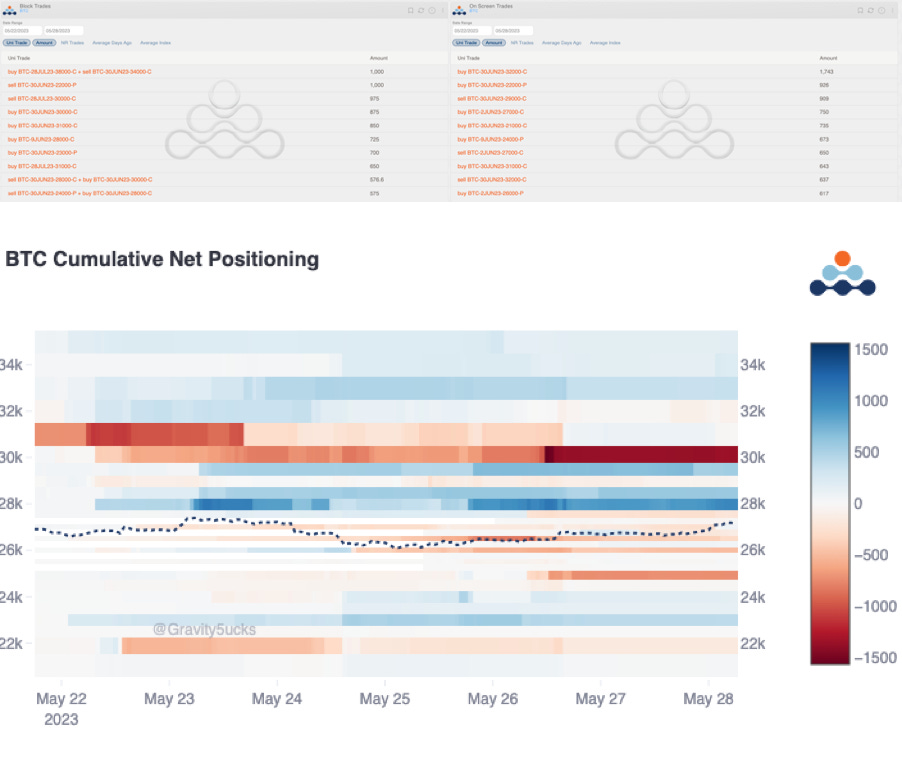 (BTC AD Direction tables with uni_trade - Options Scanner section)
Furthermore, on an atypical Sunday for low liquidity, we highlight an exceptional trade with more than 2k contracts bought on-screen of $34k calls in July and August.
This trade had a substantial impact on the order book, drawing significant attention.
Last week, we discussed the short call roll on Ethereum, from June to September.
This week, we are witnessing the "same" roll with the sale of $2.1k July calls, accompanied by the simultaneous closure of the short position in June.
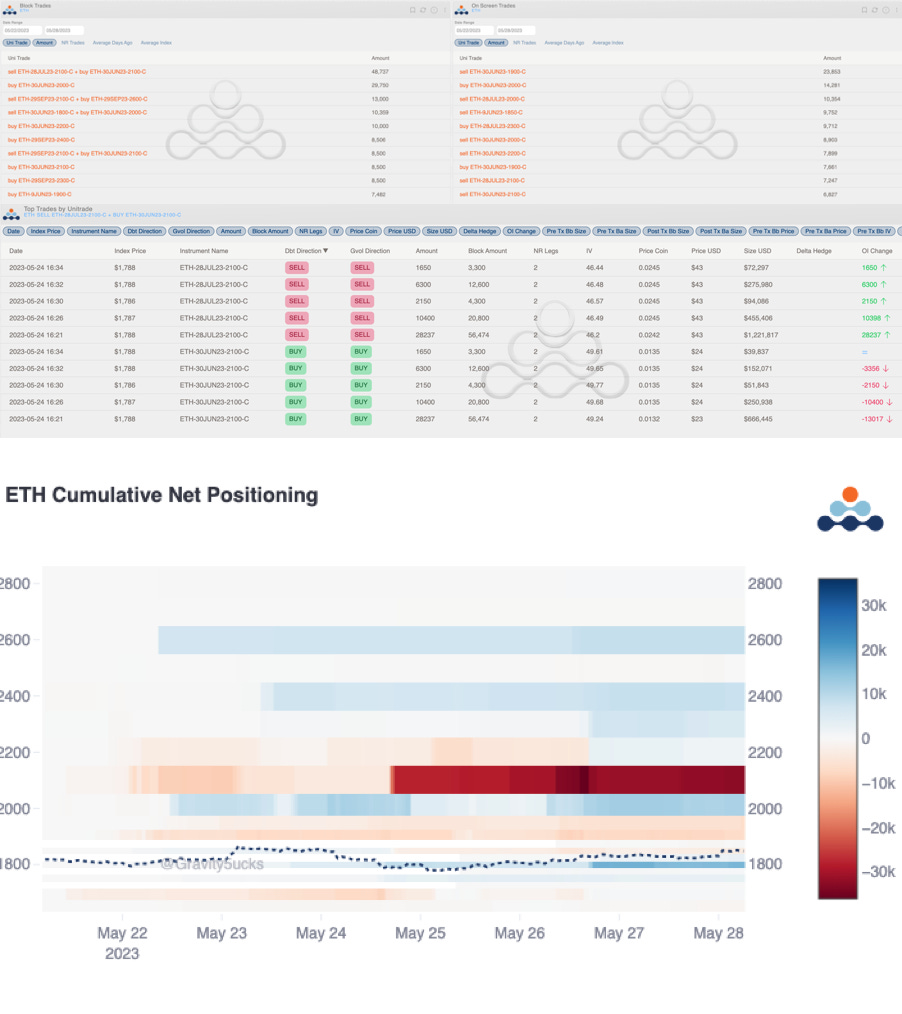 (ETH AD Direction tables with uni_trade - Options Scanner section)
The Squeethcosystem Report
Majors struggled early in the week, just to find a bid into the weekend on the positive developments with the US debt ceiling resolution. ETH ended the week +.64%, and oSQTH ended the week roughly +1.69%
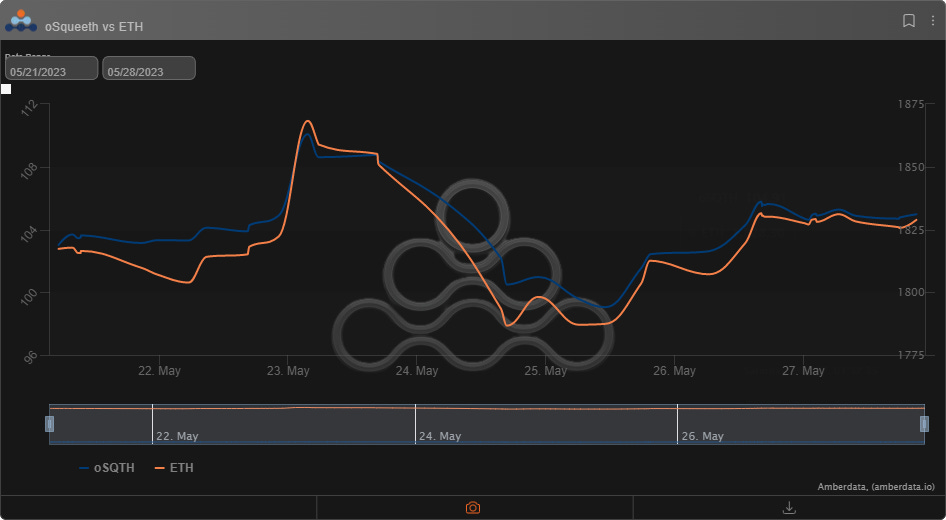
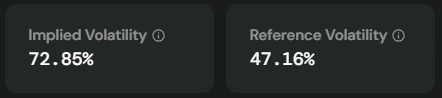
Volatility
Squeeth continues to trade rich to its reference volatility.
Volume
The 7-day total volume for oSQTH via Uniswap oSQTH/ETH pool was $601.61k
May 22nd saw the most volume, with a daily total of $163.45k traded. Another $113,075 was traded via OTC this week.
Crab Strategy
Crab ended the week at -1.18% in USDC terms.

Twitter: https://twitter.com/opyn
Discord: discord.gg/opyn


